[Preprint]. 2025 Oct 6:2025.10.03.680353.
doi: 10.1101/2025.10.03.680353.

Aging Leads to Altered Physiological Reactivity in Response to Repeated Social Separation Stress in a Nonhuman Primate Model

Affiliations

Aging Leads to Altered Physiological Reactivity in Response to Repeated Social Separation Stress in a Nonhuman Primate Model

Aaryn Mustoe et al. bioRxiv. .

Abstract

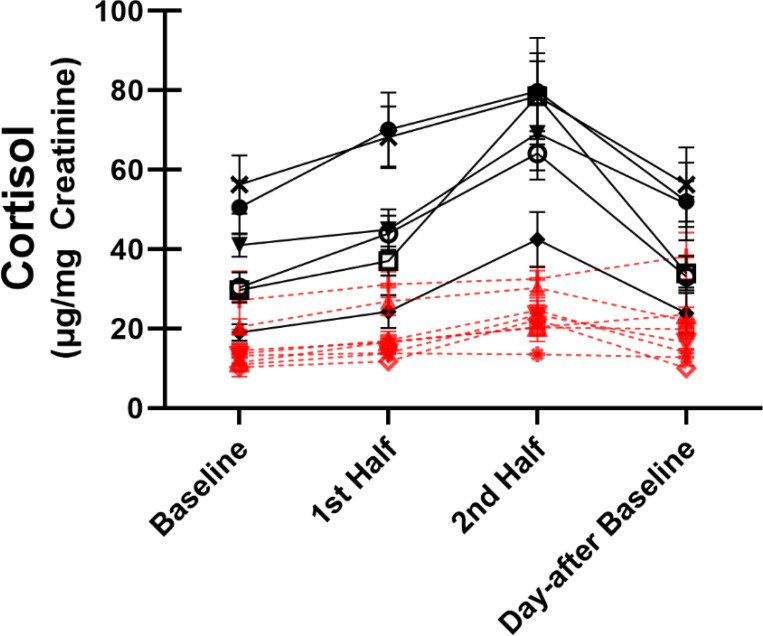
Social relationships are critical for maintaining physical health and psychological wellbeing. Since nearly 1 in 4 adults aged 65 years or older are socially isolated, there is a strong need to understand how repeated social stress negatively impacts health outcomes. Using a nonhuman primate model of social aging (i.e., marmosets), we examined whether individuals transitioning into old age ("peri-geri") or individuals who were already geriatric ("very-geri") showed differences in measures of hypothalamic-pituitary axis (HPA) activity, markers of metabolic and immune function, and reunion social behavior in response to repeated social separation challenges (SSC). We found female marmosets, especially peri-geri females, had higher HPA reactivity and better HPA recovery than male marmosets, but this difference diminished in older, very-geri marmosets. HPA activity was correlated with multiple outcomes including locomotive behavior and grooming, changes in blood glucose levels, and neutrophil counts. Moreover, marmosets who approached their partner more and were groomed less during reunions had higher cortisol levels the following day. Interestingly, we found two distinct HPA profiles among our marmosets with half showing strong HPA responses (reactors) and the other half showing little or no HPA response (non-reactors). Non-reactors had less weight gain/more weight loss; elevated levels of calcium, phosphorus, and white blood cells; and received less grooming and social contact time during reunion. Overall, old-aged marmosets who show attenuated HPA responses may have different vulnerabilities to negative health and behavioral outcomes during social stress, and male marmosets appear more likely to present with this HPA non-reactor phenotype earlier in aging.

Keywords: cortisol; inflammation; marmosets; metabolism; social aging; stress reactivity.


Figures

Figure 1.
Figure 1.
Schematic and timeline of procedures and sample collection for an individual Social Separation Challenge (SSC). SSCs were repeated 10 times for each individual marmoset twice per week for 5 weeks. First or baseline urine samples (both day-of and day-after) were collected at ~0700AM upon awakening. SSCs lasted from 0730–1100AM with video isolation observations occurring from 0730–0800AM and the live homecage social reunion observations occurring immediately after the SSC (at 1100AM).
Figure 2.
Figure 2.
Average urinary cortisol ± SEM across all SSCs for all marmosets. *= p<.05; **= p<.01; ns = not significant.
Figure 3.
Figure 3.
Average urinary cortisol ± SEM across all SSCs. Marmosets are grouped by reactors (black, solid line) and non-reactors (red, dashed line) based on difference in urinary cortisol change (HPA reactivity) during SSC. Each individual line corresponds to the averaged SSC response for an individual marmoset.
Figure 4.
Figure 4.
HPA and reunion behavior heatmap clustered by reactor (Reactive) and non-reactor (NR) phenotypes. Each column represents an individual marmoset. Higher color intensity reflects higher value outcome. Tr = move transitions; SM = scent marking; GD = genital display. See methods/Table 1 for full name descriptions.
Figure 5.
Figure 5.
Average urinary cortisol ± SEM across all SSCs by age group (peri-geri and very-geri), and mean differences in urinary cortisol ± SEM in each of the HPA reactivity and HPA recovery parameters by age group. Individual data points reflect individual marmoset averaged responses.
Figure 6.
Figure 6.
Average urinary cortisol ± SEM across all SSCs by sex. and mean differences in urinary cortisol ± SEM in each of the HPA reactivity and HPA recovery parameters by sex. Individual data points reflect individual marmoset averaged responses. * indicates p<.05.
Figure 7.
Figure 7.
Average urinary cortisol ± SEM across all SSCs by both sex and age group, and mean difference ± SEM in recovery% by both sex and age group. Individual data points reflect individual marmoset averaged responses.
Figure 8.
Figure 8.
Average urinary cortisol ± SEM across the first three and last three SSCs separated by age group and sex. Averaged move transitions, max reactivity, approaches, and approach to leave ratio each showed significant differences and interaction effects between first three and last three SSCs and sex.
Figure 9.
Figure 9.
Representative significant correlations between cortisol AUC and cortisol recovery with reunion behavior parameters. Parameters presented on the X-axis are outcomes that precede the outcomes presented on the Y-axis (i.e., cortisol reactivity occurred before social reunion and social reunion occurred before cortisol recovery). Shaded area represents 95% confidence intervals.
Figure 10.
Figure 10.
Representative significant correlations between HPA reactivity and recovery and health parameters. 6M Weight change is the weight change (g) from the beginning of the SSC sessions and 6 months after the start of SSCs. The maximum % weight change reflects the largest observed weight change by % measured over the course of the recent year during SSCs. Change in glucose and change in neutrophil cell count % reflect post SSC – pre SSC values. Conversely, the change in cytokine/chemokine CCL4 and CXCL10 reflect the change in plasma concentration between a sample collected at the start of the SSC and the sample collected at the end of the SSC (i.e., positive values reflect an increase in cytokine concentration over the SSC period). Shaded area represents 95% confidence intervals.
Figure 11.
Figure 11.
Each panel shows a significant difference (mean ± SEM) in health parameter outcomes between reactor and non-reactor groups. 6M Weight change is the weight change (g) from the beginning of the SSC sessions and 6 months after the start of SSCs. Individual data points reflect individual marmoset averaged responses. Change in blood chemistry and CBC markers reflect post SSC – pre SSC values.
Figure 12.
Figure 12.
Each panel show a significant difference (mean ± SEM) in reunion behavioral outcomes between reactor and non-reactor groups. Individual data points reflect individual marmoset averaged responses. Behaviors are scored as average per 20 min observation (either in frequency or duration in seconds).

References

    1. Holt-Lunstad J., Smith T. B., Baker M., Harris T., & Stephenson D. (2015). Loneliness and social isolation as risk factors for mortality: a meta-analytic review. Perspectives on psychological science, 10(2), 227–237. - PubMed
    1. Yang Y. C., McClintock M. K., Kozloski M., & Li T. (2013). Social isolation and adult mortality: the role of chronic inflammation and sex differences. Journal of health and social behavior, 54(2), 183–203. - PMC - PubMed
    1. Shankar A., McMunn A., Banks J., & Steptoe A. (2011). Loneliness, social isolation, and behavioral and biological health indicators in older adults. Health psychology, 30(4), 377. - PubMed
    1. Valtorta N. K., Kanaan M., Gilbody S., Ronzi S., & Hanratty B. (2016). Loneliness and social isolation as risk factors for coronary heart disease and stroke: systematic review and meta-analysis of longitudinal observational studies. Heart, 102(13), 1009–1016. - PMC - PubMed
    1. Kanbay M., Tanriover C., Copur S., Peltek I. B., Mutlu A., Mallamaci F., & Zoccali C. (2023). Social isolation and loneliness: Undervalued risk factors for disease states and mortality. European Journal of Clinical Investigation, 53(10), e14032.

Publication types

LinkOut - more resources