[Preprint]. 2025 Oct 22:2025.10.21.683287.
doi: 10.1101/2025.10.21.683287.

JAK1/2 Inhibition Delays Cachexia and Improves Survival through Increased Food Intake

Affiliations

JAK1/2 Inhibition Delays Cachexia and Improves Survival through Increased Food Intake

Ezequiel Dantas et al. bioRxiv. .

Abstract

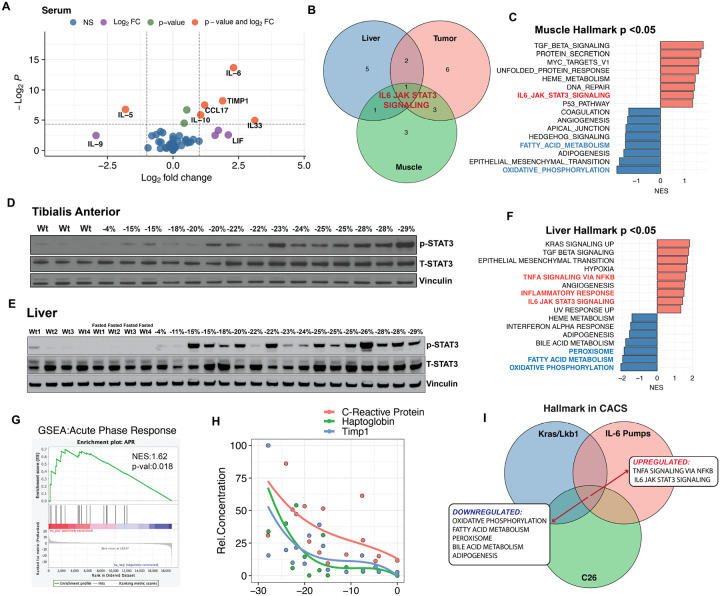
Lung cancer is the leading cause of cancer-related death and is frequently accompanied by reduced food intake and cachexia, a debilitating syndrome characterized by weight loss and skeletal muscle wasting. We sought to identify contributors to cachexia using a murine model of lung cancer that reproduces key features of this syndrome. A multiplex cytokine screening approach, integrated with western blot and transcriptomic analyses, identified tumor-derived inflammatory mediators and downstream signaling pathways associated with cachexia. Notably, IL-6 superfamily members were elevated in the tumor and plasma of mice and patients with cachexia. The JAK-STAT3 signaling was upregulated in liver and skeletal muscle, driving the acute phase response and impairing lipid metabolism. Pharmacologic inhibition of JAK1/2 with ruxolitinib improved body weight, fat mass, and overall survival without altering tumor burden. These effects were driven primarily by blunted hypothalamic leptin receptor signaling, which increased food intake early in the disease course. In the liver, JAK inhibition reduced STAT3 activity, restored fatty acid oxidation, and decreased the production of acute-phase proteins. These findings support JAK inhibition as a therapeutic strategy for lung cancer-associated cachexia.


Conflict of interest statement

Conflict of interest statement M.D.G. holds equity in Faeth Therapeutics and Skye Biosciences; reports consulting or advisory roles with Almac Discovery, Faeth Therapeutics, Genentech Inc., Scorpion Therapeutics, Skye Biosciences, and Third Arc Bio, Inc.; honoraria from Novartis AG, Pfizer Inc., Genentech Inc., patents, royalties, and other intellectual property with Weill Cornell Medicine and Faeth Therapeutics. E.D. reports intellectual property with Weill Cornell Medicine. All other authors report no conflicts.

Figures

Figure 1.
Figure 1.. Cachexia is associated with anorexia and low total energy expenditure.
A. Progression of weights normalized to peak from male KL mice (A). B-D. Body weight, fat mass and lean mass from KL mice before induction (W0) and after four (W4) and nine weeks (W9) after induction. E-H. Cumulative food intake in grams (E), Total Energy Expenditure (F), cumulative activity (G) and respiratory exchange ratio for the mice displayed in B, C and D. Comparisons in B, C and D were performed with one-way ANOVA followed by Tukey’s multiple comparisons test. Individual data points are independent biological replicates unless otherwise stated.
Figure 2.
Figure 2.. Cachexia is associated with a pro-inflammatory tumor microenvironment
A. Ingenuity Pathway Analysis (IPA) comparing tumor transcriptomics between CACS and NCACS mice. B. Venn-diagram showing the results from KL mice tumor transcriptomics Gene Set Enrichment Analysis (GSEA) comparing CACS to NCACS (blue) and tumor proteomics from patients with low and high body mass index (BMI) in the CPTAC cohort (red). C. Heatmap that shows the differential expression of cytokines relevant to cachexia in tumors from CACS and NCACS mice. D. Volcano plot comparing cytokine levels measured by Luminex in tumor lysates from CACS and NCACS. E. Immunohistochemistry (IHC) for p-STAT3 (Tyr705) in the KL tumors from CACS and NCACS mice. F. Quantification of the positive cells per square millimeter in the tumor p-STAT3 (Tyr705) IHC of CACS and NCACS KL mice. G. Relative expression of p-STAT3 (Tyr705) comparing tumor phospho-proteomics from patients with low and normal BMI in CPTAC cohort. Comparisons in D, F, G were done with Wilcoxon's test. Comparisons in M and O were performed with one-way ANOVA followed by Tukey’s multiple comparisons test. Individual data points are independent biological replicates unless otherwise stated.
Figure 3.
Figure 3.. Cachexia is associated with systemic JAK activation.
A. Volcano plot comparing cytokine levels measured by Luminex in plasma from CACS and NCACS KL mice. B. Venn-diagram with common GSEA results of the Hallmark database for liver, tumor and muscle. C. GSEA comparing muscle transcriptomics between CACS and NCACS KL mice using the Hallmark database. D. Western Blot (WB) for p-STAT3 (Tyr705), Total STAT3 and Vinculin in the tibialis anterior (TA) of non-tumor-bearing (WT) mice and KL mice with different stages of weight loss. E. GSEA comparing between livers of CACS and NCACS mice. F. Western Blot (WB) for p-STAT3 (Tyr705), Total STAT3 and Vinculin in liver of non-tumor-bearing (WT) mice, WT mice with 15 hours of food restriction, and KL mice with different stages of weight loss G. GSEA of acute phase reactants (APR) when comparing the liver transcriptomics of CACS and NCACS KL mice. H. Relative concentration of APR proteins (C-reactive protein, Haptoglobin, and TIMP1) in the serum of KL mice with different grades of weight loss. APR concentration was normalized to 1–100 to plot all the analytes in a single graph. I. Venn-diagram showing GSEA common results between liver transcriptomics from KL mice (CACS vs NCACS), C26 tumor-bearing mice (tumor vs PBS control), and mice implanted with IL-6 pumps (IL-6 pump vs PBS pump). Comparison in A was done with Wilcoxon's test. Individual data points are independent biological replicates unless otherwise stated.
Figure 4.
Figure 4.. A. Jak1/2 inhibition prolongs survival in male mice with cachexia.
A. Progression of weights normalized to peak from cachexic KL mice treated with Pacritinib. B. Kaplan-Meier plot with the probability of survival from cachexic KL mice treated with pacritinib. C. Lung mass of KL mice treated with pacritinib. D. Progression of weights normalized to peak from cachexic KL mice treated with ruxolitinib. E. Kaplan-Meier plot with the probability of survival from cachexic KL mice treated with ruxolitinib. F. Lung mass of KL mice treated with ruxolitinib at endpoint. Comparisons for the KM plots in B, and E were done with the Log-rank Mantel-Cox test. Comparisons in C and F were done using two-tailed Studenťs t-test. Individual data points are independent biological replicates unless otherwise stated.
Figure 5.
Figure 5.. Ruxolitinib prolongs survival by preserving adipose tissue mass.
A. Correlation analysis of total body weight change between weeks three and six post-tumor induction and survival in days. B. Fat mass percentage change in KL mice treated or not with ruxolitinib. C. Fat mass percentage change in KP mice treated or not with ruxolitinib. D. Leptin levels in the plasma of KL mice that have not reached 12.5% weight loss (pre-CACS) and CACS, treated or not with ruxolitinib. E. Cumulative food intake of non-tumor bearing mice treated or not with ruxolitinib. F-G. Percentage change of body weight(F) and fat mass (G) of non-tumor bearing mice treated or not with ruxolitinib for 13 days. H. Percentage change in fat mass of non-tumor bearing mice treated or not with ruxolitinib for 45 days and then caloric restricted for 25 days under ruxolitinib treatment or not. I. Immunofluorescence staining for p-STAT3 (Tyr 705) on the dorsomedial hypothalamic nucleus (DMH) of KL mice treated or not with ruxolitinib. J. Quantification of C-Fos (+) neurons from brains in I. Comparisons in D, F, G and J were performed using Wilcoxon’s test. Individual data points are independent biological replicates unless otherwise stated.
Figure 6.
Figure 6.. Ruxolitinib reverses PPAR-α inhibition and inflammation in the liver of cachexic mice.
A. Western blot for p-STAT3 (Tyr705) in the livers of mice treated or not with ruxolitinib B. Quantification by densitometry of the bands in A. C. Gene set enrichment analysis (GSEA) of liver transcriptomics from CACS mice comparing the effects of ruxolitinib in the liver of CACS mice treated or not with ruxolitinib. D. Heatmap showing relative plasma levels of acute-phase reactants AGP, A2M, CRP, Haptoglobin and SAP in the plasma of KL mice treated or not with ruxolitinib. E. Expression level of key PPAR-α target genes in the livers of KL mice treated or not with ruxolitinib. F-H. Plasma levels before euthanasia of beta-hydroxy butyrate (F), non-esterified fatty acids (G) and glycerol(H) in the plasma of KL mice treated or not with ruxolitinib.

References

    1. Fearon K. et al. Definition and classification of cancer cachexia: an international consensus. Lancet Oncol 12, 489–495 (2011). 10.1016/s1470-2045(10)70218-7 - DOI - PubMed
    1. von Haehling S., Anker M. S. & Anker S. D. Prevalence and clinical impact of cachexia in chronic illness in Europe, USA, and Japan: facts and numbers update 2016. Journal of Cachexia, Sarcopenia and Muscle 7, 507–509 (2016). 10.1002/jcsm.12167 - DOI - PMC - PubMed
    1. Fearon K. et al. Definition and classification of cancer cachexia: an international consensus. The Lancet Oncology 12, 489–495 (2011). 10.1016/S1470-2045(10)70218-7 - DOI - PubMed
    1. Morita-Tanaka S., Yamada T. & Takayama K. The landscape of cancer cachexia in advanced non-small cell lung cancer: a narrative review. Translational Lung Cancer Research 12, 168–180 (2023). - PMC - PubMed
    1. Ross P. J. et al. Do patients with weight loss have a worse outcome when undergoing chemotherapy for lung cancers? British journal of cancer 90, 1905–1911 (2004). 10.1038/sj.bjc.6601781 - DOI - PMC - PubMed

Publication types