[Preprint]. 2025 Nov 9:2025.11.07.687259.
doi: 10.1101/2025.11.07.687259.

Coordinated circulating and tissue-based T cell responses precede xenograft rejection

Affiliations

Coordinated circulating and tissue-based T cell responses precede xenograft rejection

Ekaterina Novikova et al. bioRxiv. .

Abstract

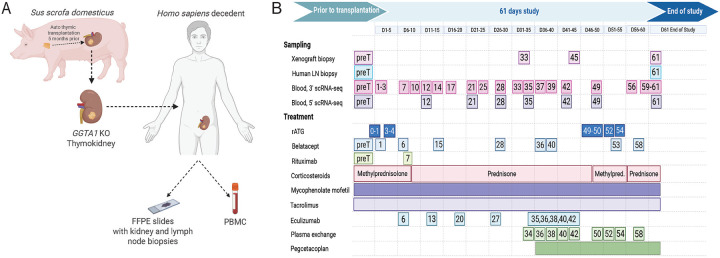
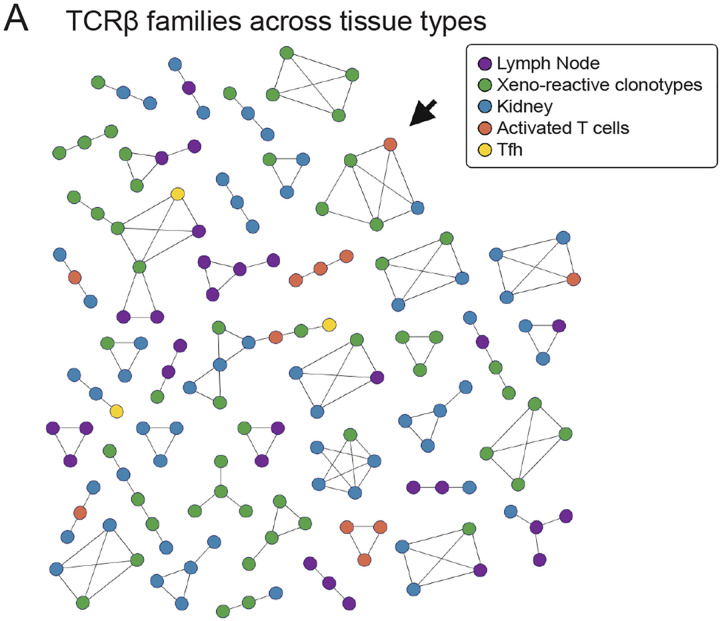
Despite the life-saving successes of solid organ transplantation, the number of individuals needing organ transplant far exceeds the number of organs available for use each year. Porcine xenotransplantation, or the use of pig organs for transplantation in people, holds substantial promise but xenograft rejection in humans is poorly understood. T cell rejection by the host immune system is a major challenge for human allografts and may limit the longevity of porcine xenografts. To study the xenograft rejection, we evaluated T cell responses and repertoire dynamics across tissues following porcine thymokidney transplantation in a decedent model over 61 days after bilateral native kidney nephrectomy. Despite induction with anti-thymocyte globulin and ongoing immune suppression consisting of rituximab, corticosteroids, calcineurin inhibition, and mycophenolate mofetil, human T cell infiltration of the xenograft was observed and was associated with xenograft dysfunction. Longitudinal analysis of T cell clonotypes in biopsies of thymokidney revealed accumulation of clonal human CD4 and CD8 T cell responses. Moreover, circulating activated T cells, including circulating T follicular helper (cTfh), were xeno-reactive and increased in frequency around rejection events. We confirmed clonal dominance of a single CD8 clonotype - identified as donor-reactive in a mixed lymphocyte reaction - in the circulation leading up to the acute cellular rejection event. Following re-treatment with anti-thymocyte globulin and intensification of corticosteroids, the T cell clonotypes were dramatically diminished in frequency in thymokidney and lymph nodes, though not eliminated. Over time of observation, the T cell clonotypes were shared across multiple compartments, including xenograft, circulation and lymph nodes and formed clonal families with known xeno-reactive clonotypes, suggesting a coordinated immune response against a limited pool of antigenic targets. Together, these data demonstrate T cell repertoire dynamics across tissues in the setting of xenograft rejection and highlight opportunities for early surveillance, prediction and potential intervention.


Conflict of interest statement

Competing interests M.S. holds patents #US-5658564-A and #EP-0697876-B1 “Xenograft thymus”.

Figures

Figure 1.
Figure 1.. Overview of the 61-day GGTA1 KO thymokidney transplantation study
1A. Schematic overview of the experimental setup, illustrating the transplantation of a GGTA1 KO thymokidney from Sus scrofa domesticus into a human decedent. 1B. Timeline detailing clinical events, sampling points, and immunosuppressive treatment regimen. LN – lymph node, rATG – rabbit antithymoglobulin, preT – pretransplantation time point
Figure 2.
Figure 2.. Human T cells infiltrate xenograft following transplantation
2A. Bulk TCR and BCR sequencing was conducted on RNA isolated from FFPE slides of thymokidney biopsies obtained prior to transplantation and at days 28, 33, 45 and 61 post-transplantation, as well as from a porcine lymph node biopsy and decedent iliac lymph nodes prior to transplantation and at the end of study. 2B. Total number of unique human TCRα and β clonotypes, identified by unique CDR3 region in the xenograft over time. 2C. Clonality of thymokidney samples for TCRα and TCRβ over time. 2D-F. Top 10 most abundant TCRβ clonotypes identified in the thymokidney at each respective time point: day 33 (2D), day 45 (2E), and day 61 (2F), and tracking of their presence across other thymokidney time points. 2G-I. TCRα clonotypes at day 33 (2H), 45 (2I), and 61 (2J), and tracking of their presence across other thymokidney time points. 2J. Thymokidney TCRβ sequences form clonotypic families. Only families with 3 or more members are shown. Of the 487 unique clonotypes in the xenograft, 57 formed families with 3 or more members, 88 formed families with 2 members, and 342 did not form families.
Figure 3.
Figure 3.. Circulating T cells exhibit increased activation as rejection approaches
3A. 3’-scRNAseq was performed on decedant PBMCs from prior to transplantation and from multiple time points after reperfusion. Additionally, PBMCs from selected time points were sorted to isolate activated CD4+ and CD8+ cells, and 5’ CITE-seq was performed on these sorted populations. 3B. Activated CD8+ and CD4+ cells were identified based on expression of CD38 and HLA-DR. 3C. The proportions of activated CD8+ and CD4+ cells, relative to their respective total CD8+ and CD4+ populations. 3D. The Median Fluorescence Intensity of CD38 on CD8+ and CD4+ T cells. 3E. UMAP of selected T cell clusters (0, 6, 7, and 9) from the 3’ scRNA-seq dataset from PBMC, representing activated T cells across all time points. 3F. CD8A and HLA-DRB1 expression across selected clusters confirm that the 3’ scRNA-seq subset accurately represents sorted T cell populations. Statistics were calculated via one-way ANOVA and post-hoc Tukey’s HSD test (**** p < 0.0001; *** p < 0.001; ** p < 0.01; * p < 0.05; ns p >= 0.05). 3G. Proportion of activated T cells by cluster across different time points. 3H. SCPA pathway expression for Hallmark genesets in activated T cells over time. 3I-3J. Activated Tfh, identified by coexpression of ICOS and CD38. 3K. CXCL13 level in serum of the long-term decedent over time. 3L. CXCL13 level in serum of healthy individuals (HC).
Figure 4.
Figure 4.. Clonal expansion of xenoreactive cells in xenograft and circulation
4A. Sharing of TCRβ in peripheral blood across days 28, 35, 42 and 49 post-transplant. Clonotype CASSDGEVNTEAFF shown in orange. 4B. Tracking of TCRβ clonotype CASSDGEVNTEAFF across time and tissue compartments. The proportion of this clonotype is shown by the orange bars, and the total numbers of unique clonotypes per sample is shown by the blue line. 4C. Heatmap of -log(p value) from Fisher’s Exact test of overlap of TCRβ clonotypes between xenograft, lymph node samples and PBMC. 4D. Overlap of human TCRβ clonotypes in purple between xenograft at day 33 and clonotypes from other xenograft (Kidney) time points, as well as iliac ipsilateral (IpsiLN61) and contralateral (ContraLN61) lymph nodes at day 61. 4E. Overlap of human TCRβ clonotypes between xenograft at day 45 and clonotypes from other xenograft time points and day 61 lymph nodes. 4F. Overlap of TCRβ clonotypes between xenograft at day 61 and clonotypes from other xenograft time points and day 61 lymph nodes. 4G. Overlap of TCRβ clonotypes between xenograft at day 33 and clonotypes from other xenograft time points, as well as blood samples at days 28, 35, 42 and 49. 4H. Overlap of TCRβ clonotypes between xenograft at day 45 and clonotypes from other xenograft time points, as well as blood samples at days 28, 35, 42 and 49. 4I. Overlap of TCRβ clonotypes between xenograft at day 61 and clonotypes from other xenograft time points, as well as blood samples at days 28, 35, 42 and 49. 4J. UMAP of the shared TCRβ clonotypes present in peripheral blood and xenograft (dark red) and TCRβ clonotypes unique to blood (light pink). 4K. TCRβ clonotypic sharing between blood and xenograft by number. 4L. Shared TCRβ clonotypes present in peripheral blood and xenograft across time points. 4M. UMAP of the shared TCRβ clonotypes present in peripheral blood and xeno-reactive clonotypes (dark red) and TCRβ clonotypes unique to blood (light pink) over time. 4N. TCRβ clonotypic sharing between blood and xeno-reactive clonotypes by number. 4O. Shared TCRβ clonotypes present in peripheral blood and xeno-reactive clonotypes (dark red) and TCRβ clonotypes unique to blood (light pink) over time.
Figure 5.
Figure 5.. TCRβ clonotypes form clonotypic families across compartments
5A. GLIPH2-based clonal families form across peripheral blood, lymph node, kidney, Tfh, and xenogeneic donor-reactive clonotypes. Arrow indicates clonotype CASSDGEVNTEAFF.

References

    1. Health Resources and Services Administration. Organ procurement and transplantation network: national data. 2025.
    1. Carrier AN, Verma A, Mohiuddin M, Pascual M, Muller YD, Longchamp A, et al. Xenotransplantation: A New Era. Front Immunol. 2022;13:900594. - PMC - PubMed
    1. Sykes M, Sachs DH. Progress in xenotransplantation: overcoming immune barriers. Nat Rev Nephrol. 2022. Dec;18(12):745–61. - PMC - PubMed
    1. Pan W, Zhang W, Zheng B, Camellato BR, Stern J, Lin Z, et al. Cellular dynamics in pig-to-human kidney xenotransplantation. Med (N Y). 2024. Aug 9;5(8):1016–1029.e4.
    1. Schmauch E, Piening B, Mohebnasab M, Xia B, Zhu C, Stern J, et al. Integrative multi-omics profiling in human decedents receiving pig heart xenografts. Nat Med. 2024. May 17;30(5):1448–60. - PubMed

Publication types