[Preprint]. 2025 Oct 20:2025.10.20.683358.
doi: 10.1101/2025.10.20.683358.

Industrialization drives convergent microbial and physiological shifts in the human metaorganism

Mathilde Poyet  1   2   3   4   5 Malte Rühlemann  6   7 Ana P Schaan  1   2 Yue Ma  1   6   8 Lucas Moitinho-Silva  2   6 Eike M Wacker  6 Hannah Jebens  2   6 Lucas Patel  9   10 Le Thanh Tu Nguyen  2   3 Alexis Zimmer  11 Damian Plichta  4 Daniel McDonald  12 Christine Stevens  4 Adwoa Agyei  2   13 Mary Y Afihene  2   14 Shadrack O Asibey  2   15 Yaw A Awuku  2   16 Aida S Badiane  2   17 Lee S Ching  2   18 Chris Corzett  2   19 Awa Deme  2   20 Manuel Dominguez-Rodrigo  21 Amoako Duah  2   22 Alain Fezeu  3   23 Alain Froment  24 Sean Gibbons  2   25   26   27   28 Catherine Girard  2   29   30 Jeff Hooker  2   31 Fatimah Ibrahim  2   32   33 Deborah Iqaluk  2   34 Vanessa Juimo  2   23 Pinja Kettunen  2   35 Sophie Lafosse  2   24 Ernest Lango-Yaya  2   36 Jenni Lehtimäki  2   35 Yvonne A L Lim  2   32   37 Audax Mabulla  2   38 Varocha Mahachai  2   39 Rihlat S Mohamed  2   40 Katya Moniz  5 Ivan E Mwikarago  2   41   42   43 Yvonne A Nartey  2   44 Daouda Ndiaye  2   17 Mary Noel  2   31 Charles Onyekwere  2   45 Tan M Pin  2   32   33 Amelie Plymoth  2   44 Lewis Roberts  2   46 Lasse Ruokolainen  2   35 John Rusine  2   18   41 Laure Segurel  47 B Jesse Shapiro  2   48 Shani Sigwazi  2   49 Ainara Sistiaga  2   50   51 Kenneth Valles  2   52 Tommi Vatanen  2   4   53   54   55 Ratha-Korn Vilaichone  2   56 Philip Rosenstiel  6 John Baines  1   8 Andre Franke  6 David Ellinghaus  6 Rob Knight  12   57   58   59   60 Mark Daly  4 Ramnik J Xavier  4   5   61 Eric J Alm  2   3   4   5 Mathieu Groussin  2   3   4   5   6
Affiliations

Industrialization drives convergent microbial and physiological shifts in the human metaorganism

Mathilde Poyet et al. bioRxiv. .

Abstract

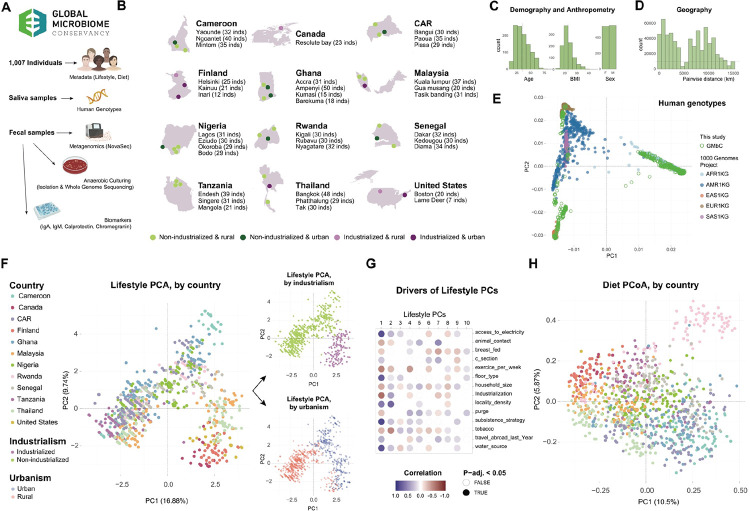
Understanding how host lifestyle and industrialization shape the human gut microbiome and intestinal physiology requires multimodal analyses across diverse global host contexts. Here, we generate multivariate data from the Global Microbiome Conservancy cohort, including gut microbiome, IgA-sequencing, host genotyping, diet, lifestyle and fecal biomarker profiles, to investigate host-microbiome interactions across gradients of industrialization and geography. We show that industrialization is associated with homogenized microbial compositions, reduced microbial diversity, and lower community stability, independent of host confounders. We further show that industrialization is linked to elevated markers of gut stress, increased IgA secretion, and altered patterns of IgA-bacteria interactions. Finally, we show that microbiome-based disease predictors trained on industrialized populations lose accuracy in less industrialized cohorts, highlighting limited cross-population transferability. Together, our results suggest profound restructuring of host-microbiome interactions due to industrialized lifestyles, and emphasize the need for inclusive, globally representative data to improve translational microbiome applications across diverse human populations.


Conflict of interest statement

R.J.X. is a co-founder of Convergence Bio, board director at MoonLake Immunotherapeutics, a consultant to Nestlé, and a member of the advisory boards at MagnetBiomedicine and Arena Bioworks. R.K. is a scientific advisory board member and consultant for BiomeSense, Inc., has equity, and receives income. He is a scientific advisory board member and has equity in GenCirq. He is a consultant and scientific advisory board member for DayTwo and receives income. He has equity in and acts as a consultant for Cybele. He is a co-founder of Biota, Inc., and has equity. He is a co-founder of Micronoma and has equity and is a scientific advisory board member. The terms of these arrangements have been reviewed and approved by the University of California, San Diego, in accordance with its conflict of interest policies. D.M. is a consultant for and has equity in BiomeSense, Inc. The terms of these arrangements have been reviewed and approved by the University of California, San Diego, in accordance with its conflict-of-interest policies. No organizations listed above provided funding for this study.

Figures

Figure 1 –
Figure 1 –. Multimodal sampling in the GMbC cohort to investigate factors shaping human metaorganisms worldwide
I. Collected samples and metadata from GMbC participants (n = 1,015). Gut shotgun metagenome, human genotype, and cultured isolate genomic short read data were generated. Levels of fecal biomarkers (IgA, IgM, calprotectin and chromogranin) were measured. Lifestyle and diet metadata were collected. J. Countries (n = 12) and sampling locations (n = 35). Locations are colored based on industrialism and urbanism status of recruited populations. The number of participants per location is shown. K. Distribution of age, BMI and sex parameters in the GMbC cohort. L. Distribution of pairwise geographic distances across sampled participants (Haversine distance, assuming a spherical Earth). M. PCA of human genotypes of the GMbC cohort (green circles) and the 1000 Human genomes project (plain points, colors represent superpopulations). N. Left plot: Factor analysis of mixed data (FAMD) applied to lifestyle metadata factors (see Methods). Participants are colored by country. Top right: same plot, participants colored by industrialism status. Bottom right: same plot, participants colored by urbanism status. O. Correlation between individual lifestyle factors and the first ten principal components (PCs) of the Lifestyle PCA. Statistically significant associations (adjusted p-val < 0.05) are shown in plain circles. P. Principal component analysis (PCoA) of diet metadata (UniFrac-based distances of FFQ data, see Methods). Participants are colored by country as in F, left plot.
Figure 2 –
Figure 2 –. Effect of industrialized and urban lifestyles on community-level variations in the global human gut microbiome
G. Phylogenetic diversity (Faith’s PD index) of metagenomes (species level) as a function of the first PC of the Lifestyle PCA. PC1 Lifestyle is used as a continuous proxy for industrialization (Fig. 1F&G). Participants are colored by country (left plot), industrialization status (top right) or urbanism status (bottom right). The blue line shows the linear regression. H. PCoA of unweighted UniFrac compositional dissimilarities (species level). Participants are colored by country, industrialism status and urbanism status as in A. I. Inter-individual compositional dissimilarities across quantiles of PC1 Lifestyle, used as a continuous proxy for industrialization (Fig. 1F&G), increasing from first to fifth quantile. Industrialized and urban populations exhibit increased homogeneity of bacterial compositions (quantiles #4 & #5). J. Cumulative explained variance (as measured by stepwise dbRDA, forward multivariate model selection) of species-level microbiome compositions by individual host factors. The baseline covariates (latitude, longitude, age, sex and BMI) and the first 10 PCs for Lifestyle, Diet and Genetics were included in the model. K. Variance partitioning of alpha diversity of taxa (species level) (Faith’s PD and Shannon diversity) and KEGG KO functions (Richness). Marginal and maximum variances (R2) of alpha diversity were calculated for the following factors: Lifestyle (10 first PCs), Diet (10 first PCs), Genetics (10 first PCs), Non-Additive Effects of Lifestyle and Diet, and Non-Additive Effects of Lifestyle, Diet and Genetics. Statistical significance is represented as plain square and circle symbols. Marginal and maximum effects are calculated using a nested model approach where the null model contains baseline host covariates (age, sex, BMI and geography), and the full model contains all tested host variables (see Methods). L. Variance partitioning of PCs of beta diversity for taxa (species level) (unweighted UniFrac and Aitchison distance) and KEGG KO functions (Canberra distance). The same approach as in panel E was used. Colors and symbols for statistical significance are as in panel E.
Figure 3 –
Figure 3 –. Impact of industrialized and urban lifestyles on individual taxonomic and functional features of the gut microbiome
G. Meta-analysis of country-level associations between gut bacterial species abundance and urbanism status (urban vs. rural). The “META-ANALYSIS” column shows statistical results of the cross-country meta-analysis performed using an inverse-variance weighted fixed-effects approach. Because Canada included only rural participants in our cohort, it was grouped with the USA under the label ‘North America’. Species are shown in rows. The top 25 species most enriched in each category are shown. H. Effect of host covariates on the association between bacterial species abundance and industrialization (PC1 Lifestyle) (x axis: species; y axis: effect size). Two models were compared – a first model with Lifestyle PCs alone as predictors, and a second model with host covariates (baseline covariates and Diet and Genetic PCs). Significant associations are shown as plain symbols. I. Variance partitioning of species abundance to calculate marginal and maximum variance of baseline, Lifestyle, Diet and Genetic factors, along with Non-additive Effects. The same statistical framework and figure design as in Fig. 2E&F were used. “Environment” is defined as the overall contribution of Lifestyle and Diet (see Methods). Features are grouped by majority factors that explain >50% of variance. Data for KEGG KOs is shown in Supp. Fig. 3C and Supp. Table 3. J. Ternary plots of relative marginal effects on species (left) and KEGG KOs (right) profiles. Marginal effects for KEGG KOs were calculated as for species shown in panel C (see Supp. Fig. 3). Relative contributions of Genetics vs. Environment vs. Non-additive effects of Diet, Lifestyle and Genetics are shown in left plots, while contributions of Genetics vs. Diet vs. Lifestyle effects are shown in right plots. K. Identification of lifestyle-associated KEGG KOs across countries. Lifestyle-associated KEGG KOs were identified using the following criteria: (i) significant association with either Lifestyle alone or Environment, based on marginal variances calculated as in panel C, (ii) effect size (marginal R2) for Lifestyle higher than for Genetics and Diet, (iii) significant association with industrialization status (indus vs. non-indus, q-value < 0.05), (iv) significant association (q-value < 0.05) with PC1 Lifestyle and (v) significant within-country meta-association with PC1 Lifestyle. L. KEGG module enrichment analysis reveals Cobalamin biosynthesis as enriched in the industrialized group (left panel). The analysis is based on the average country correlation of KEGG KOs with PC1 Lifestyle. KEGG modules enriched in the industrialized group and highlighted in purple are described in further panels. Panels for modules M00924, M00925, M00122 and M00741 show the distribution of within-country correlation coefficients between all individual KEGGs of these modules and PC1 Lifestyle. KEGGs with plain symbols are part of the set of Industrialization-associated KEGGs identified in panel E.
Figure 4 –
Figure 4 –. Decreased gut microbiome stability among populations living in industrialized societies
G. Co-abundance networks reconstructed from metagenomic profiles of non-industrialized (left) and industrialized (right) samples. Only significant compositionally-corrected abundance correlations with |coefficient| >= 0.3 are retained (edges). Each node represents a bacterial species. Co-abundance networks were reconstructed by matching the two groups for alpha diversity (n=460 individuals in each group, see Methods and Supp. Fig. 4). Networks controlling for age, sex, BMI and geographic distribution are shown in Supp. Fig. 4. H. Increased node degree among co-abundance networks of more industrialized populations. Normalized node degree was calculated at the aggregate level for both non-industrialized and industrialized groups (left panel, Wilcoxon test), as well as for each individual locality (n participants >= 30) (right panel, linear regression with PC1 Lifestyle, coefficients shown at the bottom right). Average position along PC1 Lifestyle was calculated for each locality. I. Natural connectivity measurement of co-abundance networks based on industrialization status. Nodes were progressively and randomly removed (x axis) to simulate perturbations and measure the stability of the networks. J. Toy schematic illustrating the concept of a lineage as a series of matched co-abundance modules tracked across ordered localities. Eight synthetic locality-specific co-abundance networks are shown for eight localities ordered by PC1 Lifestyle. The highlighted module (colored edges and filled nodes) depicts a lineage negatively associated with PC1 Lifestyle, with module size diminishing along the PC. Curved grey connectors link the centroids of the highlighted module. Edge color indicates correlation sign. K. Top-10 module lineages with positive/negative trends along PC1 Lifestyle. Localities (x-axis) are ordered by mean PC1 Lifestyle; lineages (y-axis) are labeled (see Supp. Table 4). Points show the presence and size of the module in a given locality. Modules were matched across adjacent localities using taxonomic compositional overlap (Szymkiewicz–Simpson), with one-to-one assignment (Hungarian) and a single-gap lookahead to accommodate for module absence. Colors indicate trend category: green = negatively associated with PC1 Lifestyle (markers of less industrialized contexts), purple = positively associated (markers of more industrialized contexts). Top 10 lineages per trend were selected by module size and persistence over localities. L. Backbone co-abundance networks for two representative lineages. For each lineage, we identify the largest module occurrence (peak size) and build a concise correlation backbone over this set of taxa. Node size reflects prevalence of the taxon across localities where the lineage is present; edges represent the mean pairwise correlation across those localities. To improve readability, loosely connected nodes were removed from the co-abundance backbone. Top: lineage negatively correlated with PC1 Lifestyle; bottom: lineage positively correlated with PC1 Lifestyle.
Figure 5 –
Figure 5 –. Industrialized and urban lifestyles are associated with elevated levels of fecal markers of inflammation and immune response
A. Fecal IgA and chromogranin levels based on industrialization status (Wilcoxon tests, p-val = 3.6e-18 and p-val = 4.2e-30, respectively). B-E. Distribution of fecal IgA, chromogranin, calprotectin and IgM levels across countries, sorted by average position along PC1 Lifestyle, in ascending order. F. Percentage of participants with intermediary (50 to 200 ug/g) or high (>200 ug/g) levels of fecal calprotectin, across localities. The red dash line indicates the mean percentage of participants with calprotectin > 50 ug/g across all localities. Countries with a significant enrichment of participants with moderate to high levels of calprotectin (> 50 ug/g) are shown with asterisks (logistic regression with a GLM and a binomial distribution; Cameroon: p-val = 0.04; Ghana: p-val = 0.02; Nigeria: p-val = 0.03). Countries are colored as in panels B-E. G-H. PCoA of species-level microbiome compositions (as in Fig. 2B), with participants colored by level of IgA and chromogranin. I. Variance partitioning of IgA, Chromogranin, Calprotectin and IgM levels. The same statistical framework as in Fig. 2 and 3 was used, adding PCs of microbiome compositions to the models (dark green) to account for and measure the contribution of the microbiome to fecal biomarkers. J. Identification of bacterial taxa associated with fecal IgA levels (left panel) and fecal calprotectin levels (right panel). Both GLM and Bayesian-based (BIRDMAn) approaches were used to detect taxa being consistently differentially abundant based on IgA or calprotectin. Two regression models were tested with each approach. In the first one, the model controls for baseline host covariates (age, sex, BMI and geography) (triangle symbols). In the second model, host Lifestyle, Diet and Genetic PCs are added to further control for the effect of host covariates (circle symbols). Top 10 bacteria with the strongest positive and negative effect sizes based on GLM runs are represented (See Supp. Table 5 for the full data).
Figure 6 –
Figure 6 –. Shifts in IgA-gut bacteria interactions in the gut microbiome of industrialized populations
F. Correlation of OTU-specific average IgA Coating Index (ICI) between individuals from industrialized and non-industrialized groups (Pearson correlation of log ICI values). Comparisons were made on OTUs with sufficient representation and balanced sample size between lifestyle categories (n = 166, see Methods). G. Phylogenetic distribution of average ICI values in industrialized and non-industrialized groups (blue and red color gradients, respectively). OTUs are colored by phylum. H. Comparison of IgA-coating between industrialized (n = 51 samples) and non-industrialized (n = 232 samples) groups, based on: the frequency of IgA-coated OTUs (ICI > 10) per individuals (left); the comparison of observed vs. expected IgA-coating events in the industrialized group, based on the frequency of IgA-coating events in the non-industrialized group (p-value calculated with the Poisson distribution) (middle); and the Kullback–Leibler (KL) divergence between the IgA+ and the total 16S relative abundance profiles (right). I. Correlation between IgA coating index or relative abundance and industrialization status of the host. Compositionally-corrected (CLR-transformed) abundance values are used. OTUs with sufficient representation across lifestyles were included in the analysis (n = 197). Correlations between ICI and industrialization were calculated with both PC1_Lifestyle (ICI ~ PC1_Lifestyle) and industrialization as a binary variable (ICI ~ industrialized/non-industrialized). The correlation between the CLR-corrected abundance of OTUs and industrialization were also measured (Abundance ~ PC1_Lifestyle & Abundance ~ industrialized /non-industrialized). The correlation between ICI and relative abundance of the OTUs is also shown (ICI ~ Abundance). *: p-val < 0.05; **: p-val < 0.01; ***: p-val < 0.001. J. Significant associations between ICI and industrialization shown for six different OTUs.
Figure 7 –
Figure 7 –. Low portability of microbiome-based biomarkers of health and disease
D. Distribution of Gut Microbiome Health Index (GMHI) across GMbC countries. GMbC participants do not have known chronic diseases. The GMHI was also calculated on an external validation cohort of inflammatory bowel disease (IBD) patients from the USA (in grey; see Methods). Median GMHI values are shown as black lines. Positive values indicate healthy microbiomes, while negative values indicate dysbiotic microbiomes. Median values for Tanzania, CAR, Cameroon, Rwanda, Ghana and Thailand is 0, suggesting an absence of information to call for healthy or dysbiotic microbiomes. E. GMHI values across admixture clusters. Admixture clusters with a minimum of 50 individuals were included in the analysis. F. Percentage of samples that do not contain any of the health marker taxa that are informative for the GMHI, across admixture clusters. The lack of GMHI accuracy observed in panels A and B is due to the absence of key maker taxa of health defined from cohorts of majority populations.

References

    1. Abdill R.J., Graham S.P., Rubinetti V., Ahmadian M., Hicks P., Chetty A., McDonald D., Ferretti P., Gibbons E., Rossi M., et al. (2025). Integration of 168,000 samples reveals global patterns of the human gut microbiome. Cell 188, 1100–1118.e17. 10.1016/j.cell.2024.12.017. - DOI - PMC - PubMed
    1. Ayeni F.A., Biagi E., Rampelli S., Fiori J., Soverini M., Audu H.J., Cristino S., Caporali L., Schnorr S.L., Carelli V., et al. (2018). Infant and Adult Gut Microbiome and Metabolome in Rural Bassa and Urban Settlers from Nigeria. Cell Rep. 23, 3056–3067. 10.1016/j.celrep.2018.05.018. - DOI - PubMed
    1. Brito I.L., Yilmaz S., Huang K., Xu L., Jupiter S.D., Jenkins A.P., Naisilisili W., Tamminen M., Smillie C.S., Wortman J.R., et al. (2016). Mobile genes in the human microbiome are structured from global to individual scales. Nature 535, 435–439. 10.1038/nature18927. - DOI - PMC - PubMed
    1. Carter M.M., Olm M.R., Merrill B.D., Dahan D., Tripathi S., Spencer S.P., Yu F.B., Jain S., Neff N., Jha A.R., et al. (2023). Ultra-deep sequencing of Hadza hunter-gatherers recovers vanishing gut microbes. Cell 186, 3111–3124.e13. 10.1016/j.cell.2023.05.046. - DOI - PMC - PubMed
    1. Girard C., Tromas N., Amyot M., and Shapiro B.J. (2017). Gut Microbiome of the Canadian Arctic Inuit. mSphere 2, e00297–16. 10.1128/mSphere.00297-16. - DOI - PMC - PubMed

Publication types

LinkOut - more resources