

Deep learning [18F]-FDG-PET/CT‑based algorithm for tumor burden estimation in metastatic melanoma patients under immunotherapy
- PMID: 41281625
- PMCID: PMC12639252
- DOI: 10.1016/j.ctro.2025.101063
Deep learning [18F]-FDG-PET/CT‑based algorithm for tumor burden estimation in metastatic melanoma patients under immunotherapy
Abstract
Background and purpose: Artificial intelligence is increasingly used in radiation oncology, yet its application for tumor burden (TB) estimation remains limited. This study evaluated the performance of a [18F]-fluorodeoxyglucose positron emission tomography/computerized tomography ([18F]-FDG-PET/CT)-based deep learning model, PET-Assisted Reporting System ("PARS", Siemens Healthineers), for lesion detection, segmentation, and TB estimation in patients with metastatic melanoma undergoing immunotherapy.
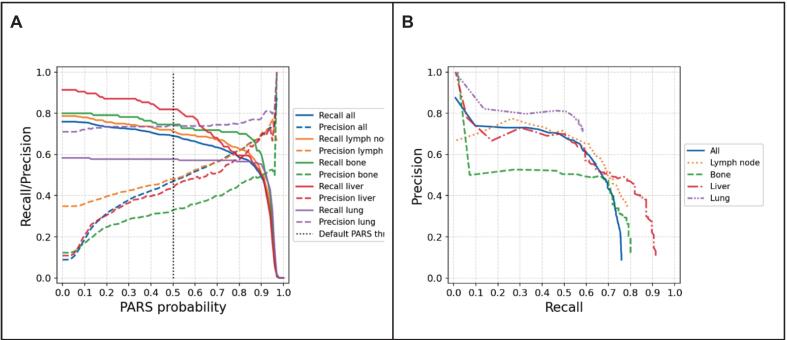
Materials and methods: This retrospective study included 165 stage IV melanoma patients who underwent [18F]-FDG-PET/CT imaging prior to immunotherapy. Gross tumor volumes were segmented using PARS and compared with manual delineations performed by radiation oncologists. Performance was assessed through lesion detection metrics (precision and recall), individual lesion volume agreement, and overall TB estimation accuracy.
Results: PARS demonstrated an overall recall (sensitivity) of 68.9 %, though with modest precision (46.8 %). Performance was location-dependent, with highest precision observed for lung lesions (74.0 %) and lowest for bone lesions (32.9 %). For lesions detected by both methods, PARS tended to underestimate lesion volumes by an average (median) of 0.9 cc (median relative percentage difference (MRPD) = -34.3 %), with a good agreement (intraclass correlations coefficient (ICC) = 0.77). The global TB in the whole cohort was overestimated by 28.3 %, but patient-level TB was on average (median) underestimated by 1.1 cc (MRPD = -18.4 %) with high variability with a median absolute relative percentage difference (MARPD) = 68.6 %) and poor agreement (intraclass correlation coefficient (ICC) = 0.28).
Conclusions: PARS shows potential for treatment decision support with moderate accuracy in lesion detection and lesion volume estimation, but demonstrates significant variability in TB estimation, highlighting the need for further model refinements before clinical adoption.
Keywords: Autosegmentation; Deep-learning; Metastatic melanoma.
© 2025 The Authors.
Conflict of interest statement
The authors declare that they have no known competing financial interests or personal relationships that could have appeared to influence the work reported in this paper.
Figures


References
-
- Liu C., Gardner S.J., Wen N., Elshaikh M.A., Siddiqui F., Movsas B., et al. Automatic segmentation of the prostate on CT images using deep neural networks (DNN) Int J Radiat Oncol Biol Phys. 2019 Jul;104(4):924–932. - PubMed
-
- Vrtovec T., Močnik D., Strojan P., Pernuš F., Ibragimov B. Auto-segmentation of organs at risk for head and neck radiotherapy planning: from atlas-based to deep learning methods. Med Phys. 2020 Sep;47(9):e929–e950. - PubMed
-
- Schouten JPE, Noteboom S, Martens RM, Mes SW, Leemans CR, de Graaf P, et al. Automatic segmentation of head and neck primary tumors on MRI using a multi-view CNN. Cancer Imaging [Internet]. 2022;22(1):8. Available from: https://doi.org/10.1186/s40644-022-00445-7. - PMC - PubMed
LinkOut - more resources
Full Text Sources
Miscellaneous
