[Preprint]. 2025 Oct 31:rs.3.rs-6805130.
doi: 10.21203/rs.3.rs-6805130/v1.

CEBPB, C19MC, and Defective Autophagy Drive Novel Podosomal Belt to Macropinocytosis Transition, Lipid Accumulation, and HBV A-to-I RNA-editing

CEBPB, C19MC, and Defective Autophagy Drive Novel Podosomal Belt to Macropinocytosis Transition, Lipid Accumulation, and HBV A-to-I RNA-editing

Goodwin Jinesh et al. Res Sq. .

Abstract

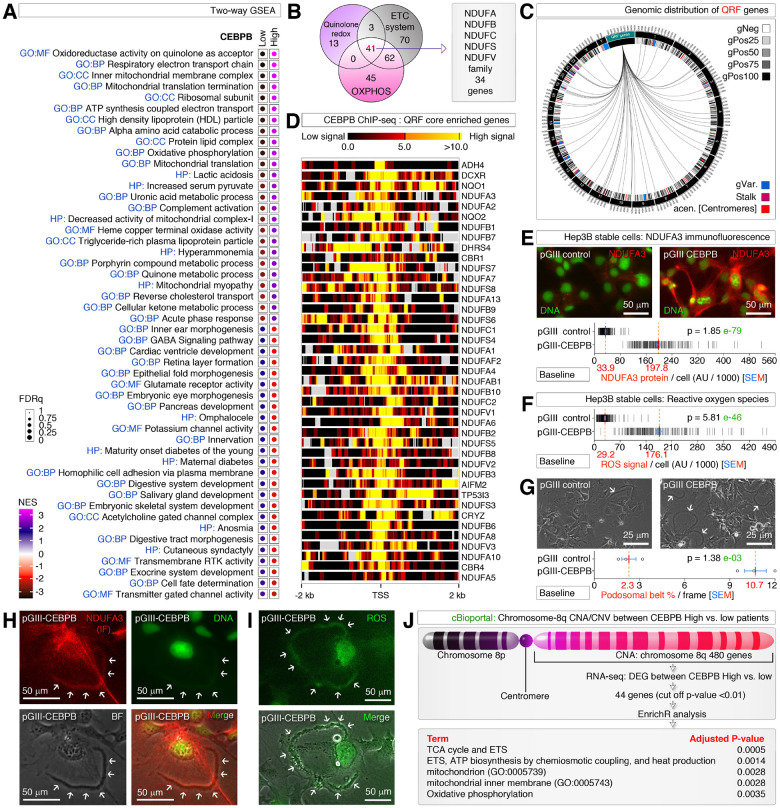
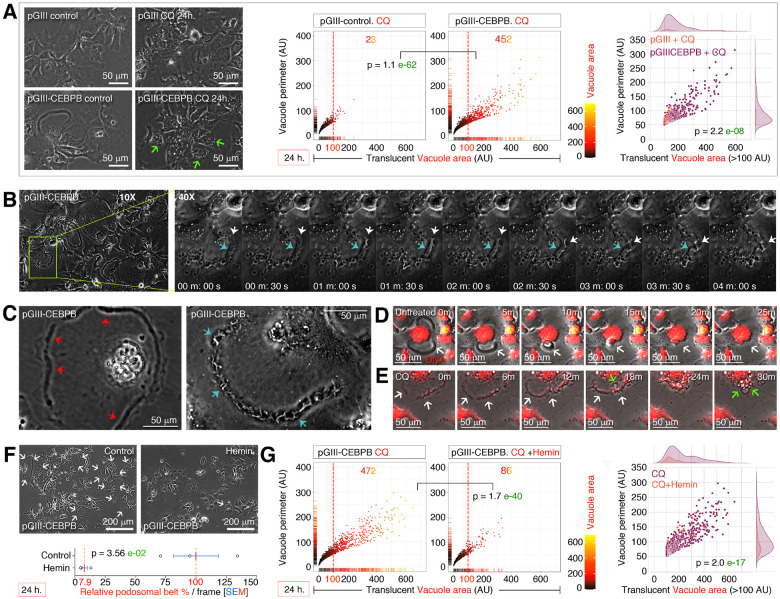
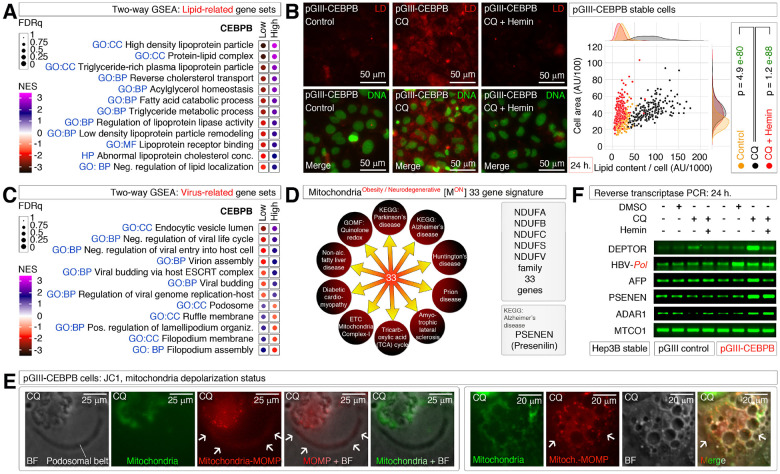
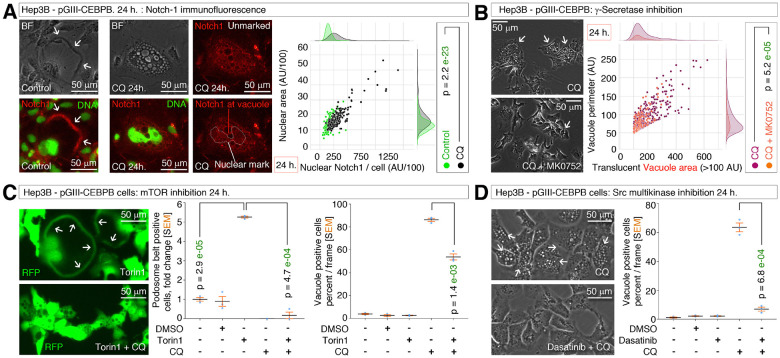
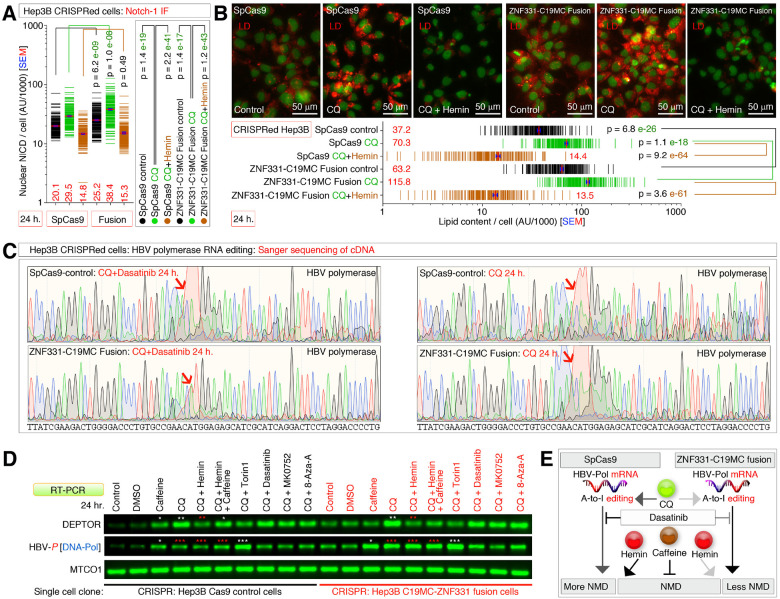
Obesity and neurodegeneration are clinically associated diseases with defective autophagy. However, the genetic, biological, and metabolic underpinnings connecting these diseases are not well-understood. Here we identified a Mitochondria obesity/neurodegeneration (M on ) gene-signature that is shared between obesity, and neurodegenerative diseases. We demonstrate that, CEBPB elevates M on -gene-signature, to form podosomal belts, and enhance ROS production. Inhibiting autophagy collapses podosomal-belts through macropinocytosis to accumulate vacuoles, lipid-droplets, nuclear Notch-1 (nNICD), DEPTOR, and HBV-polymerase mRNAs. Conversely, hemin counteracts these events and suppresses DEPTOR and HBV-polymerase mRNAs by A-to-I-RNA-editing and nonsense-mediated decay. Furthermore, we CRISPR-engineered the antiviral chromosome-19 miRNA cluster (C19MC) to demonstrate that C19MC-miRNAs augment CEBPB, M on -gene-signature, ROS, and recapitulate CEBPB-driven phenotypes, in response to autophagy inhibition. Hemin, or a γ-Secretase inhibitor counteract these phenotypes in CRISPR-C19MC-engineered cells. Therefore, a CEBPB and C19MC-driven M on -gene-signature regulates the podosomal belt, lipid droplet, HBV, and DEPTOR mRNA dynamics to genetically link obesity, and neurodegeneration at the cellular level.


Conflict of interest statement

Competing interest statement

The authors G.G.J., and A.S.B. have a provisional patent application pending for the RNA probe Cy5-CSi000A, and CRISPR-guides-3 and 4 that are used to generate ZNF331-C19MC fusion genetic engineering. A.S.B. has advisory board relationships with Deciphera. The remaining authors have no other conflicts of interests to declare. All authors agree to take individual responsibility and accountability in the event if found any undeclared conflicts of interest(s) that existed before or at the time of manuscript submission.

Additional Declarations: Yes there is potential Competing Interest. The Competing interests does not influence the article in anyway. We have included this statement in manuscript: Competing interest statement The authors G.G.J., and A.S.B. have a provisional patent application pending for the RNA probe Cy5-CSi000A, and CRISPR-guides-3 and 4 that are used to generate ZNF331-C19MC fusion genetic engineering. A.S.B. has advisory board relationships with Deciphera. The remaining authors have no other conflicts of interests to declare. All authors agree to take individual responsibility and accountability in the event if found any undeclared conflicts of interest(s) that existed before or at the time of manuscript submission.

Figures

Figure 1
Figure 1. CEBPB-LAP promotes the mitochondrial ETC system to boost the metabolic phenotypic alterations in mitochondria at the podosomal belt level
(A) Two-way GSEA profiling of CEBPBHigh versus CEBPBLow hepatocellular carcinomas. (B) Multiple metabolic signatures observed in two-way GSEA (Panel-A) share a family of NDUF genes. ETC: electron transport chain; OXPHOS: oxidative phosphorylation. (C) Genomic distribution of quinolone redox family (QRF) genes showing a genome-wide distribution. gPos or gNeg denotes Giemsa positivity and negativity respectively. (D) CEBPB ChIP-seq showing its binding at the TSS of QRF core enriched genes. A 5’−3’ directionality is represented from left to right irrespective of the loci on the positive or negative strand of the genome. (E) NDUFA3 immunofluorescence and quantification in CEBPB overexpressed and control cells. pGIII is the lentiviral plasmid construct used for transfections instead of viral infections. AU: arbitrary units. (F) Baseline ROS quantification in CEBPB overexpressed and control cells. AU: arbitrary units. (G) Baseline podosomal belt formation in CEBPB overexpressed Hep3B and control cells (Arrows). (H) CEBPB overexpressed Hep3B cells showing podosomal belt localization of NDUFA3 (Arrows). (I) CEBPB overexpressed Hep3B cells showing podosomal belt production of ROS (Arrows). (J) Copy number alteration between CEBPBHigh and CEBPBLow patients showing enrichment of genes from chromosome-8q supporting mitochondrial metabolism.
Figure 2
Figure 2. Autophagy inhibition promotes macropinocytosis on podosomal belts to generate large vacuoles, and hemin counteracts it
(A) Autophagy inhibition with chloroquine (CQ) leads to the loss of podosomal belts and accumulation of translucent vacuoles in CEBPB overexpressed Hep3B cells but not in control cells. AU: arbitrary units. The far-right joint plot uses only the larger translucent vacuoles (>100 AU) from the middle panels. (B) Time-lapse microscopy of CEBPB overexpressed Hep3B cell podosome to show the onset of macropinocytic ruffles in the collapse of podosomal belt. Blue arrows show the podosomal belt, and white arrows show the macropinocytic membrane ruffling. (C) CEBPB overexpressed Hep3B cells showing stable podosomal belt (Red arrows) and collapsing macropinocytic podosomal belt (Green arrow). (D) Time-lapse microscopy of podosomal belt resorption in untreated CEBPB overexpressed Hep3B cells without forming vacuoles (Arrow). Time stamp: in minutes. (E) Time-lapse microscopy of podosomal belt (White arrows) resorption in chloroquine (CQ) treated CEBPB overexpressed Hep3B cells forming vacuoles (Green arrows). Time stamp: in minutes. (F) Hemin inhibits podosomal belt formation in CEBPB overexpressed Hep3B cells. (G) Hemin inhibits CQ-induced podosomal belt collapse and podosomal belt formation in CEBPB overexpressed Hep3B cells to reduce vacuole formation. AU: arbitrary units. The far-right joint plot uses only the larger translucent vacuoles (>100 AU) from the left panels. Note: The smaller <100 AU particles are often artifacts.
Figure 3
Figure 3. A blockade in mitochondriaobesity/neurodegeneration (Mon)-gene-signature function (autophagy inhibition) drives podosomal belt to lipid droplet accumulation through macropinocytosis
(A) Two-way GSEA profiling of CEBPBHigh versus CEBPBLow hepatocellular carcinomas for lipid-related gene sets. (B) Lipid droplet staining using Nile Red in CEBPB overexpressed Hep3B cells treated with CQ and or Hemin showing CQ-induced lipid droplet accumulation and is prevented by hemin. The lipid droplet per cell is quantified and plotted on right. AU: arbitrary units. (C) Two-way GSEA profiling of CEBPBHigh versus CEBPBLow hepatocellular carcinomas for virus-related gene sets. (D) A 33-gene NDUF family of genes forming a mitochondrialobesity/neurodegeneration (Mon)-gene-signature. Mon-gene-signature is shared by multiple neurodegenerative diseases and diabetic and liver pathologies with ETC of obesity. Presenilin gene was from Alzheimer’s disease gene set and not part of the signature (please see downstream text for relevance). (E) Accumulation of depolarized (Red: Arrows; MOMP: mitochondrial outer membrane permeabilization) but not polarized (Green) mitochondria at podosomal belts upon chloroquine inhibition (CQ) in CEBPB overexpressed Hep3B cells (Left). Persistence of depolarized mitochondria (Red: Arrows) even after macropinocytosis and vacuole formation in chloroquine treated (CQ) CEBPB overexpressed Hep3B cells (Right). (F) RT-PCRs showing selective upregulation of human and HBV-polymerase genes in chloroquine treated (CQ) CEBPB overexpressed Hep3B cells compared to control cells and their suppression by hemin.
Figure 4
Figure 4. γ-Secretase, Notch1, mTOR and Src signaling regulate podosomal belt dynamics
(A) Immunofluorescence of Notch-1 showing podosomal belt localization of Notch-1 in untreated control Hep3B CEBPB overexpressed cells (Arrows in left panels) and nuclear localization of Notch-1 NICD. The nuclear boundary is marked by a white line, and an unmarked panel is also included. Quantification of nNICD is represented in the joint plot on the right showing increased nNICD in chloroquine (CQ) treated conditions. AU: arbitrary unit. (B) Inhibition of γ-Secretase (using MK0752) blocks podosome to vacuole transition in Hep3B CEBPB overexpressed cells. The translucent vacuole size (>100 AU) and perimeter were quantified and plotted. AU: arbitrary unit. (C) Inhibition of mTOR (using Torin1) promotes podosomal belt formation, and chloroquine (CQ) converts those podosomal belts to vacuoles in Hep3B CEBPB overexpressed cells. RFP is pseudo-colored to green. (D) SRC inhibition in Hep3B CEBPB overexpressed cells blocks CQ-induced podosomal belt to vacuole transition.
Figure 5
Figure 5. Regulation of DEPTOR and HBV-polymerase RNAs by A-to-I RNA-editing and nonsense-mediated decay (NMD)
(A) Two-way GSEA profiling of CEBPBHigh versus CEBPBLow hepatocellular carcinomas for RNA metabolism/nonsense-mediated decay-related gene sets. (B) RNA secondary structure prediction of DEPTOR and HBV-pol mRNA regions aimed for amplification from cDNAs. The estimated resolution is indicated. (C) Sanger sequencing of cDNAs of DEPTOR showing CEBPB-specific suppression of A-to-I RNA-editing in chloroquine (CQ) treated cells (Black arrow, Red peak) which was restored in CQ + hemin compared to pGIII control cells (Red arrows, Red peaks). Wild-type nucleotide sequence is given below. The window magnifications on both axes were kept constant for comparison purposes. (D) Sanger sequencing of cDNAs of HBV-polymerase showing CEBPB-specific promotion of A-to-I RNA-editing in chloroquine (CQ) treated cells (Green arrow, Red peak) which was decreased in CQ + hemin compared to pGIII control cells (Red arrows, Red peaks). Wild-type nucleotide sequence is given below. The window magnifications on both axes were kept constant for comparison purposes. (E) Nonsense-mediated decay (NMD) assay of DEPTOR and HBV-polymerase mRNA stability. Note the increase in DEPTOR and HBV-polymerase in caffeine-treated conditions compared to the counterpart controls. (F) Schematic showing the effect of NMD on DEPTOR and HBV-polymerase RNAs. Light shaded arrows indicate minor effects than black arrows. (G) Evaluation of the effects of A-to-I RNA-editing inhibition using 8-AzaAdenosine (8-Aza-A) on chloroquine (CQ)-induced podosomal belt to translucent vacuole transition in Hep3B CEBPB overexpressed cells.
Figure 6
Figure 6. CRISPR-engineered C19MC promotes NDUFA3 protein, ROS, and CEBPB, DEPTOR, and HBV-polymerase RNAs
(A) GSEA profiling of C19MCHigh versus C19MCLow 20 different human cancer types showing enrichments of CEBPB-related key gene sets (observed in Figure 1a) in C19MCHigh cancers. (B) CRISPR genetic engineering of human chromosome-19 in Hep3B cells to generate ZNF331-C19MC fusion by deleting 85kb fragment (Red box) using guide-RNAs G3 (cuts at the 3’-UTR end of ZNF331 gene) and G4 (cuts at the start of C19MC) (Purple scissors) and fusing the flanking ends that retain CEBPB binding sites. Flanking end fusion is screened by gDNA PCR (agarose gel inset image) using forward (Fà) and reverse (Rß) primers. Single-cell clones were isolated from SpCas9 control and ZNF331-C19MC fusion Hep3B cells, and Sanger sequenced (chromatogram) to confirm the presence of both fusion and wild-type chromosome-19 in the fusion cells as it exhibits ploidy. The bottom far-right panel shows the RNA-seq reads demonstrating the cut at 3’-UTR of the ZNF331 gene. (C) Quantitative real-time PCR showing the ~25-fold upregulation of C19MC miRNAs in Hep3B-ZNF331-C19MC fusion cells. (D) RNA-seq data showing the increase in CEBPB mRNA in Hep3B-ZNF331-C19MC fusion cells. (E) RT-PCR data showing IFN-γ-independent increase in C19MC target gene mRNAs (MAGEA12 and MYO18B) in Hep3B-ZNF331-C19MC fusion cells. (F) RNA-seq data showing a partial increase in Mon-gene-signature mRNAs in Hep3B-ZNF331-C19MC fusion cells compared to SpCas9 control cells. (G) Immunofluorescence showing elevated NDUFA3 protein in Hep3B-ZNF331-C19MC fusion cells. AU: arbitrary units. (H) Cy5-CSi000A staining showing elevated mitochondrial load (Left panel) and increased ROS production (Right panel) in Hep3B-ZNF331-C19MC fusion cells. AU: arbitrary units. (I) RT-PCR data showing an increase in DEPTOR, HBV-polymerase, and CEBPB mRNAs in Hep3B-ZNF331-C19MC fusion cells in chloroquine (CQ) + Dasatinib combination treated cells.
Figure 7
Figure 7. C19MC recapitulates CEBPB effects on nuclear NICD, lipid accumulation, and RNA editing on Hepatitis B virus (HBV) RNA
(A) Notch-1 immunofluorescence in CRISPR-engineered cells showing increased nuclear NICD (nNICD) in Hep3B-ZNF331-C19MC fusion cells compared to SpCas9 control cells under chloroquine (CQ) treated cells. Note, hemin suppresses chloroquine (CQ)-induced nNICD in both cell types. AU: arbitrary units. (B) Nile red lipid droplet quantification in CRISPR-engineered cells showing increased lipid droplets in Hep3B-ZNF331-C19MC fusion cells compared to SpCas9 control cells under chloroquine (CQ) treated cells. Note, hemin suppresses chloroquine (CQ)-induced lipid droplets in both cell types. AU: arbitrary units. (C) Sanger sequencing of cDNAs of HBV-polymerase showing ZNF331-C19MC fusion-specific suppression of A-to-I RNA-editing in chloroquine (CQ) + dasatinib treated cells (Red arrows, Red peaks) compared to pGIII control cells. Wild-type nucleotide sequence is given below. The window magnifications on both axes were kept constant for comparison purposes. (D) RT-PCRs showing the effect of NMD inhibition (caffeine), mTORC inhibition (Torin1), SRC inhibition (dasatinib), γ-Secretase inhibition (MK0752), and A-to-I RNA-editing (8-AzaAdenosine) in CRISPR-engineered and control Hep3B cells. *, **, ***comparison sets. (E) Schematic showing the effect of NMD on HBV-polymerase RNA. Light shaded arrows indicate minor effects than black arrows.
Figure 8
Figure 8. CEBPB and C19MC link obesity and neurodegenerative diseases at the cellular level by regulating Mon-gene-signature, podosomal belt dynamics through macropinocytosis, lipid accumulation, and RNA-editing upon defective autophagy
Schematic showing the DNA binding and transcriptional activation by CEBPB-LAP enhancing Mon-gene-signature genes which upon translation and folding form electron transport chain within mitochondria resulting in enhanced ROS production and mitochondrial dysfunction such as MOMP. Defective autophagy (Chloroquine: CQ) at this setting results in the accumulation of such mitochondria, that localize to podosomal belts and promote macropinocytosis at podosomal belts to resorb podosomal belts (Bottom left photomicrograph/Destabilized podosomal belt: annotated right panel shows green: nucleus; yellow dots: mitochondria; purple shade: macropinocytic membrane ruffles. These can be compared in an unannotated panel on left). Macropinocytosis serves to internalize lipid droplets (Orange vesicles), which fuse at the trans-Golgi network (TGN) area to form lipid droplets (Red vesicles) (Bottom right photomicrograph/Defective lipophagy: annotated right panel shows, red: lipid droplets at TGN which appear as translucent vacuoles in the unannotated left panel). Lipid droplet accumulation forms the basis for obesity, adipogenesis, and non-alcoholic fatty liver disease. Defective autophagy in turn promotes DEPTOR and HBV-polymerase transcription. HBV and vATPase are capable of triggering γ-Secretase to activate Notch-1 NICD cleavage. Nuclear NICD (nNICD) then promotes DEPTOR mRNA transcription to modulate mTORC1/2 signaling to further regulate podosomal belt dynamics. On the other hand, C19MC promotes mitochondrial load/cell and upon defective autophagy (CQ), promotes lipid accumulation and nNICD accumulation to promote DEPTOR and HBV-polymerase transcription. A-to-I RNA-editing acts at the level of DEPTOR, and HBV-polymerase RNA stability level through nonsense-mediated decay. This schematic links obesity to multiple neurodegenerative diseases at the cellular level through the Mon-gene-signature, which is the core of all observed phenotypes.

References

    1. Sargent J. Neurodegenerative disease: Balancing BMI--rethinking the relationships between obesity, ageing and risk of dementia. Nat Rev Endocrinol 11, 315 (2015). - PubMed
    1. Procaccini C. et al. Role of metabolism in neurodegenerative disorders. Metabolism 65, 1376–1390 (2016). - PubMed
    1. Knopman D.S. et al. Alzheimer disease. Nature Reviews Disease Primers 7, 33 (2021).
    1. Millward C.A. et al. Mice with a deletion in the gene for CCAAT/enhancer-binding protein beta are protected against diet-induced obesity. Diabetes 56, 161–167 (2007). - PMC - PubMed
    1. Vakili H., Jin Y., Menticoglou S. & Cattini P.A. CCAAT-enhancer-binding protein beta (C/EBPbeta) and downstream human placental growth hormone genes are targets for dysregulation in pregnancies complicated by maternal obesity. J Biol Chem 288, 22849–22861 (2013). - PMC - PubMed

Publication types

LinkOut - more resources