[Preprint]. 2025 Oct 9:rs.3.rs-7715480.
doi: 10.21203/rs.3.rs-7715480/v1.

Fetal monitoring using a wearable ultrasound patch for high-risk pregnancies

Affiliations

Fetal monitoring using a wearable ultrasound patch for high-risk pregnancies

Geonho Park et al. Res Sq. .

Abstract

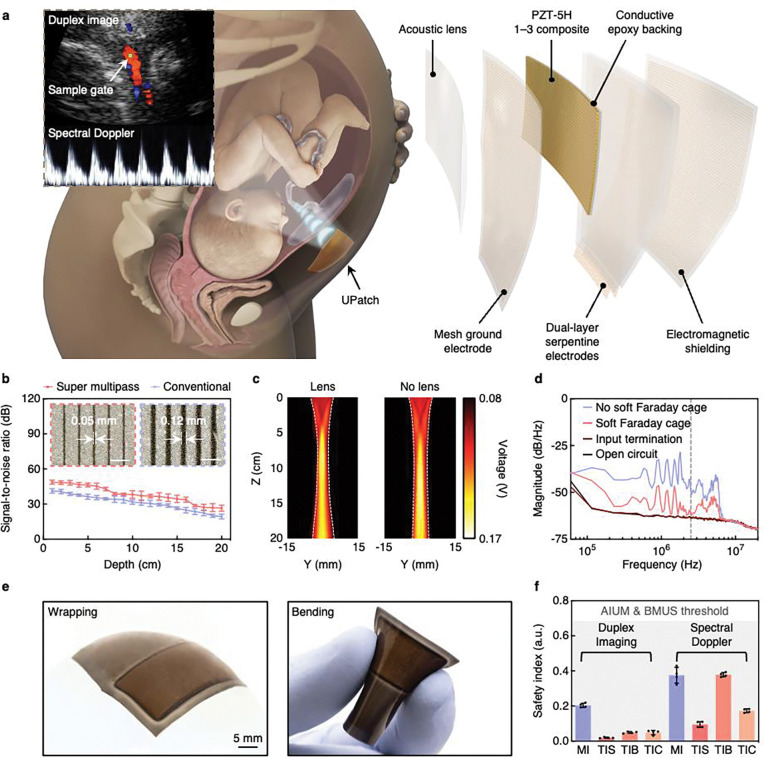
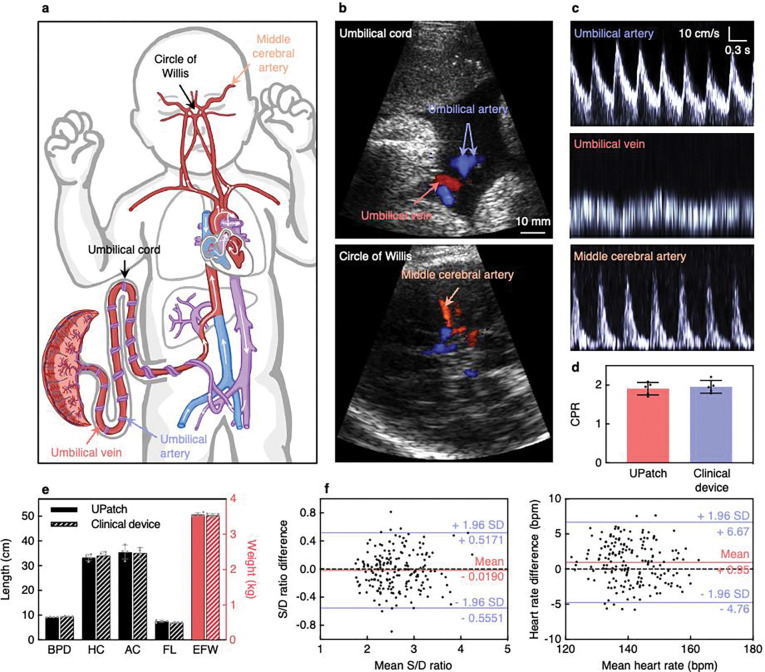
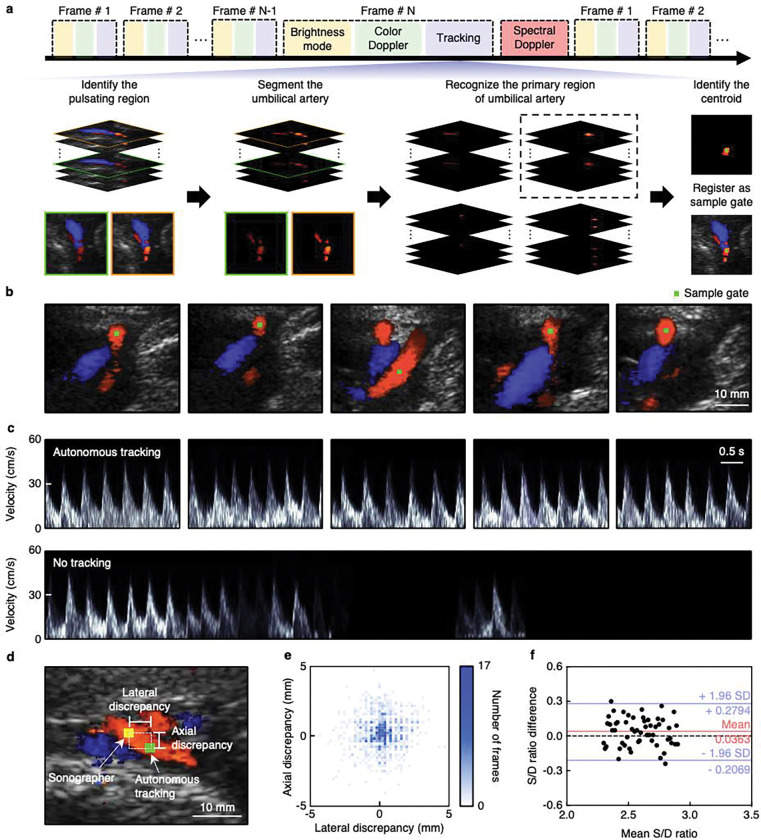
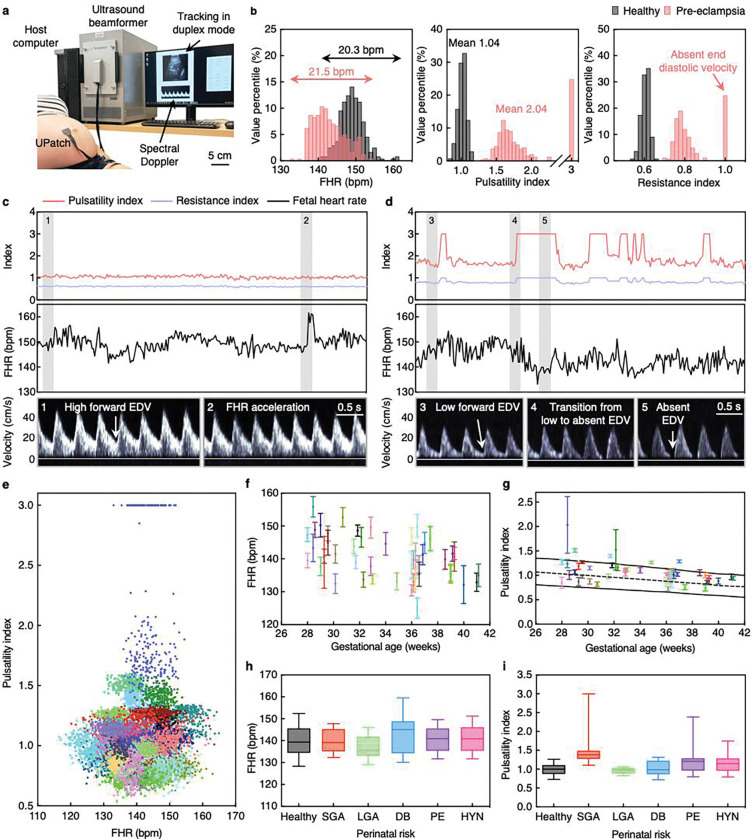
The rapid and complex nature of fetal development requires meticulous prenatal monitoring to ensure optimal pregnancy outcomes1. Cardiotocography, which continuously records the fetal heart rate and uterine contractions, often leads to inaccurate diagnoses and unnecessary interventions2. Ultrasonography is a cornerstone of fetal monitoring and diagnosis, but it is highly dependent on specialized sonographers, limiting its availability3. Additionally, current ultrasound methods provide only snapshot evaluations4. Even in very high-risk pregnancies, it is rare to have fetal ultrasound assessments more than once per day5. Here we report a wearable ultrasound patch (UPatch) for continuous and autonomous fetal monitoring. The UPatch can acquire anatomical structures and blood flow velocities, with signal qualities comparable to those of handheld clinical ultrasound devices. Real-time image segmentation allows the autonomous tracking of target vessels and thus the acquisition of continuous blood flow spectra during fetal and maternal movements without a sonographer. We validated the UPatch accuracy on 62 pregnancies, and the continuous monitoring data on 52 pregnant women aligned with stratified perinatal conditions, including healthy, small for gestational age, large for gestational age, gestational diabetes, pre-eclampsia, and gestational hypertension. The UPatch introduces new capabilities for prenatal care and offers critical evidence for studying fetal complications in high-risk pregnancies.


Conflict of interest statement

Competing interests S.X. is a cofounder of Softsonics LLC. A.T.P. is a Senior Scientific Advisor of Intelligent Ultrasound Ltd. All other authors declare no competing interests.

Figures

Fig. 1 |
Fig. 1 |. Overview of the UPatch.
a, Schematics of the working principle for fetal monitoring (left) and a structurally exploded view (right). The UPatch is attached to the maternal abdomen to monitor fetal anatomical structures and hemodynamics continuously with duplex imaging. A sample gate, indicated by the green dot, provides blood flow measurements from fetal vessels. A diverging beam is used for imaging, and a focused beam for blood flow measurement. The UPatch is multilayered to enhance its signals from red blood cells and minimize its form factors. b, Comparison of signal-to-noise ratios between the conventional method and transducers diced with the super multipass method (n = 12). The insets are optical images showing the results from the two methods. Scale bars = 0.5 mm. c, Acoustic fields measured using a hydrophone in the elevational plane of the UPatch with (left) and without (right) an acoustic lens. d, The power spectral density analysis of the UPatch with and without the soft Faraday cage, input termination at 50 Ω, and open circuit of the backend system. The soft Faraday cage reduces noise coupling from electromagnetic interference by 11.7 dB/Hz at 2.5 MHz (gray dashed line), the center frequency of the UPatch. e, Photographs of the UPatch demonstrating its mechanical compliance in wrapping (left) and bending (right) shapes. f, UPatch safety measurements. The mechanical index (MI), soft tissue thermal index (TIS), bone thermal index (TIB), and cranium thermal index (TIC) were all well below the thresholds of 0.7 recommended by the AIUM and BMUS for continuous monitoring (n = 4). Error bars in b and f show ± standard deviations.
Fig. 2 |
Fig. 2 |. Measurements and validations of the UPatch for fetal monitoring.
a, Schematics illustrating the fetal cardiovascular system, with labels indicating key vessels for pregnancy monitoring. b, Duplex images from the umbilical cord and circle of Willis recorded with the UPatch. The images share the same scale bar. c, Blood flow spectra from three key vessels recorded with the UPatch. The spectra share the same scale bar. d, Comparison of the cerebroplacental ratio (CPR) measured with the UPatch and a handheld clinical ultrasound device (n = 5). e, Comparison of fetal biometry measured with the UPatch and a handheld clinical ultrasound device. Biparietal diameter (BPD), head circumference (HC), abdominal circumference (AC), and femur length (FL) were used to calculate estimated fetal weight (EFW) (n = 4). f, Bland–Altman plots for the systolic-to-diastolic ratio (S/D ratio, left) and fetal heart rate (right) measured using the UPatch and a handheld clinical ultrasound device (Voluson E10, GE). Solid red lines are the mean differences between the two devices, solid blue lines are 95% limits of agreement (1.96 standard deviations above and below the mean differences), and black dashed lines are the zero difference between the two devices. Each plot has three measurement pairs by repeating three times with the same devices on the same participant for each of the 62 participants. Error bars in d and e show ± standard deviations.
Fig. 3 |
Fig. 3 |. Autonomous vessel tracking by image segmentation.
a, Beamforming sequence and working principle of the image segmentation-based vessel tracking algorithm. The tracking algorithm is integrated between the duplex imaging and spectral Doppler (top). The algorithm identifies the pulsating regions in consecutive frames, segments the umbilical artery, recognizes the primary region, and registers the spatial centroid as the sample gate (bottom). Images with green and orange boundaries represent the end diastole and peak systole, respectively. In these two images, the blue regions are similar, indicating the umbilical vein, whereas the red regions differ in intensity, indicating the pulsating umbilical artery. Among the four segmented areas, the primary region is defined as the largest segmented area (denoted with the black dashed box), which has the strongest signal intensity. b, Tracking a moving umbilical artery and registering a sample gate using the UPatch with the autonomous algorithm. All images share the same scale bar. c, The autonomous algorithm allows the measurement of blood flow from a moving vessel continuously (top). Without the autonomous tracking algorithm, a predefined sample gate results in signal loss due to vessel movements (bottom). The spectra share the same scale bar. d, A representative image showing the difference between the sample gate labeled by the autonomous tracking algorithm and by a sonographer. e, Summary of the lateral and axial discrepancies in the sample gates labeled by the autonomous tracking algorithm and by a sonographer. f, Bland–Altman plot for the systolic-to-diastolic ratios (S/D ratio) measured by the autonomous tracking algorithm and a sonographer. The solid red line is the mean difference between the two methods, the solid blue lines are 95% limits of agreement (1.96 standard deviations above and below the mean differences), and the black dashed line is the zero difference between the two methods.
Fig. 4 |
Fig. 4 |. Continuous monitoring of pregnant participants.
a, Photograph of the measurement setup, with participants in a semi-recumbent position. The UPatch was laminated on the maternal abdomen and connected to an ultrasound beamformer and a host computer, which displays the duplex image, tracks the sample gate, and measures spectral Doppler signals from the umbilical artery. b, Histograms of the fetal heart rate (FHR, left), pulsatility index (middle), and resistance index (right) from the healthy (grey) and pre-eclamptic (red) participants. c, Pulsatility index, resistance index (top), and FHR (middle) recording from the healthy participant. Spectral Doppler signals from the shaded regions (bottom). The spectra share the same scale bar. d, Pulsatility index, resistance index (top), and FHR (middle) recording from the pre-eclamptic participant. Spectral Doppler signals from the shaded regions (bottom). The spectra share the same scale bar. e, Scatterplot of pulsatility index against FHR with each color corresponding to an individual participant. f, FHR plotted against gestational age. g, Pulsatility index plotted against gestational age. The black dashed line is the 50th percentile, and the solid black lines are the 5th and 95th percentiles of a widely used reference population. The color schemes in e, f, and g are the same. Error bars in f and g show ± standard deviations. h,i, Box plots of (h) FHR and (i) pulsatility index stratified by perinatal condition: healthy (31 participants, 217 data points), small for gestational age (SGA; 7 participants, 49 data points), large for gestational age (LGA; 3 participants, 21 data points), diabetes (DB; 6 participants, 42 data points), preeclampsia (PE; 7 participants, 49 data points), and maternal hypertension (HYN; 10 participants, 70 data points). Each box represents the interquartile range (25th to 75th percentiles), the whiskers denote the 5th to 95th percentile range, and the midline indicates the median. Each participant’s data was segmented into 10-min intervals (n = 7 per participant).

References

    1. Rouse D. J. Antepartum fetal surveillance ACOG practice bulletin, number 229. Obstet Gynecol 137, E116–E127 (2021). - PubMed
    1. Marzbanrad F., Stroux L. & Clifford G. D. Cardiotocography and beyond: a review of one-dimensional Doppler ultrasound application in fetal monitoring. Physiological Measurement 39, 08TR01 (2018).
    1. Chudleigh T., Smith A. & Cumming S. Obstetric & Gynaecological Ultrasound: How, Why and When. (Elsevier, 2016).
    1. Maulik D. & Lees C. C. Doppler Ultrasound in Obstetrics and Gynecology. (Springer, 2023).
    1. Alfirevic Z., Stampalija T. & Dowswell T. Fetal and umbilical Doppler ultrasound in high-risk pregnancies. Cochrane Database of Systematic Reviews 6, CD007529 (2017). - PMC - PubMed

Methods references

    1. Huang Z. et al. Three-dimensional integrated stretchable electronics. Nature Electronics 1, 473–480 (2018).
    1. Kempski K. M., Graham M. T., Gubbi M. R., Palmer T. & Lediju Bell M. A. Application of the generalized contrast-to-noise ratio to assess photoacoustic image quality. Biomed Opt Express 11, 3684–3698 (2020). - PMC - PubMed
    1. https://www.ondacorp.com/Handbook/.
    1. Wear K. A. & Shah A. Nominal Versus Actual Spatial Resolution: Comparison of Directivity and Frequency-Dependent Effective Sensitive Element Size for Membrane, Needle, Capsule, and Fiber-Optic Hydrophones. IEEE Transactions on Ultrasonics, Ferroelectrics, and Frequency Control 70, 112–119 (2023). - PubMed
    1. Harris G. R. et al. Hydrophone Measurements for Biomedical Ultrasound Applications: A Review. IEEE Transactions on Ultrasonics, Ferroelectrics, and Frequency Control 70, 85–100 (2023). - PMC - PubMed

Publication types

LinkOut - more resources