. 2025 Nov 24;22(1):276.
doi: 10.1186/s12974-025-03603-3.

Upregulated astrocytic HDAC7 induces depression-like disorders via deacetylating PINK1 and inhibiting mitophagy

Affiliations

Upregulated astrocytic HDAC7 induces depression-like disorders via deacetylating PINK1 and inhibiting mitophagy

Rui-Zhu Yue et al. J Neuroinflammation. .

Abstract

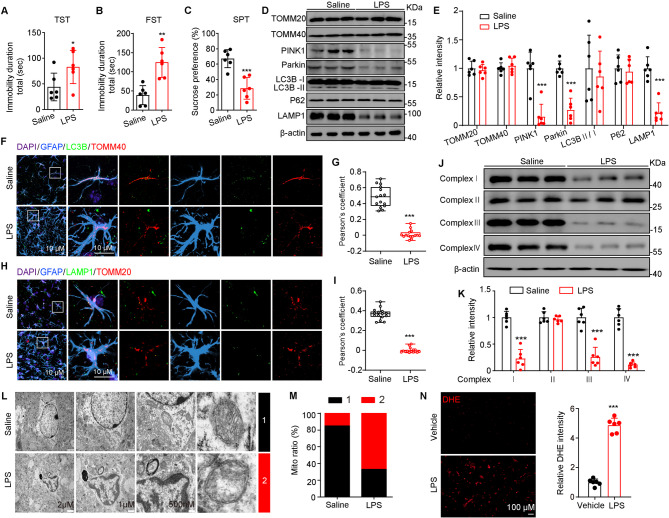
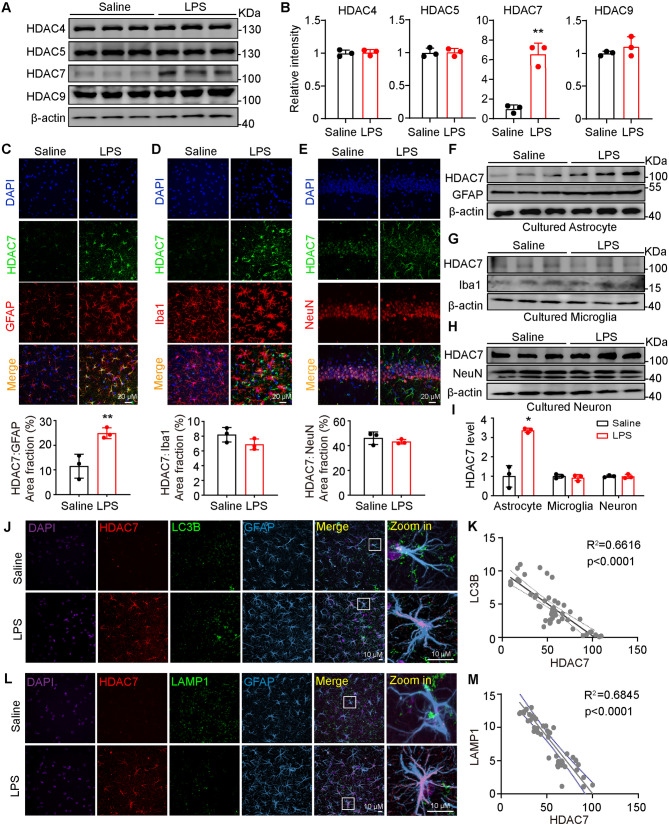
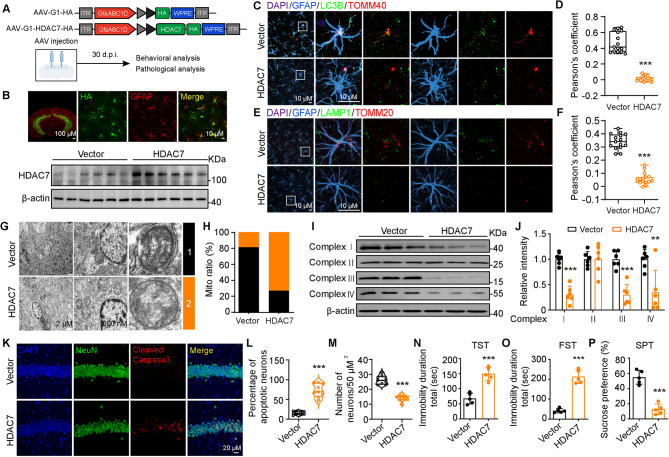
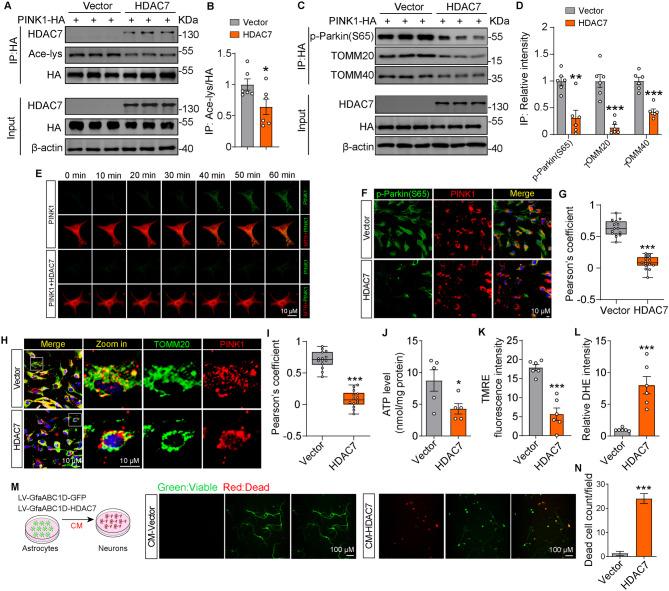
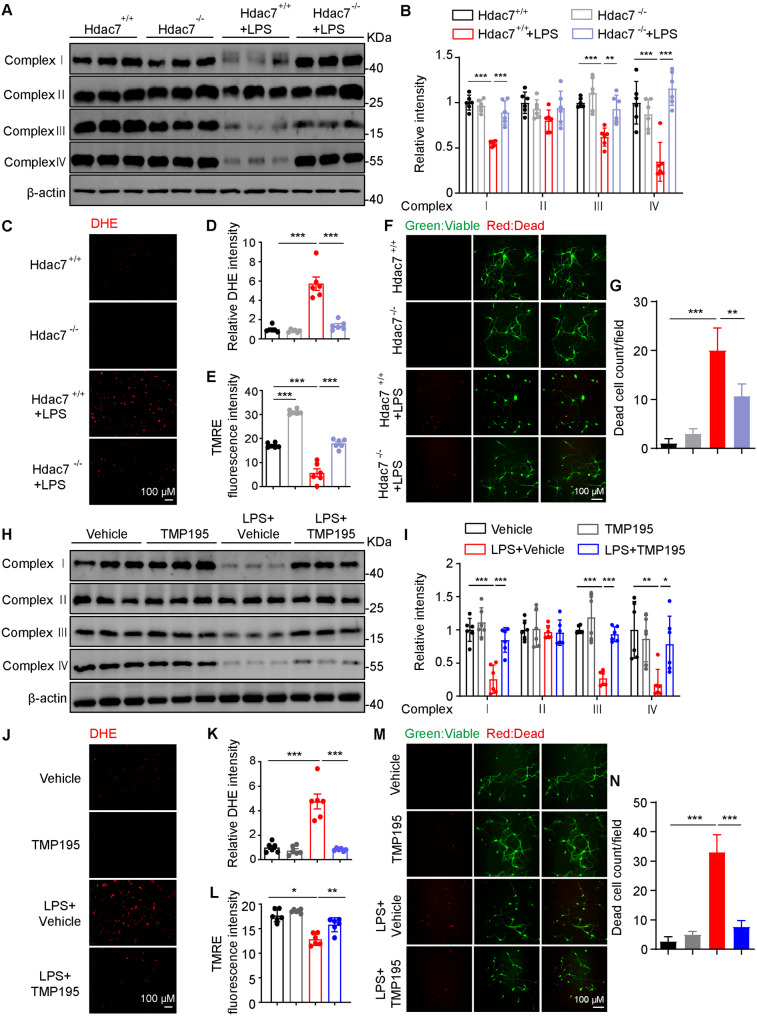
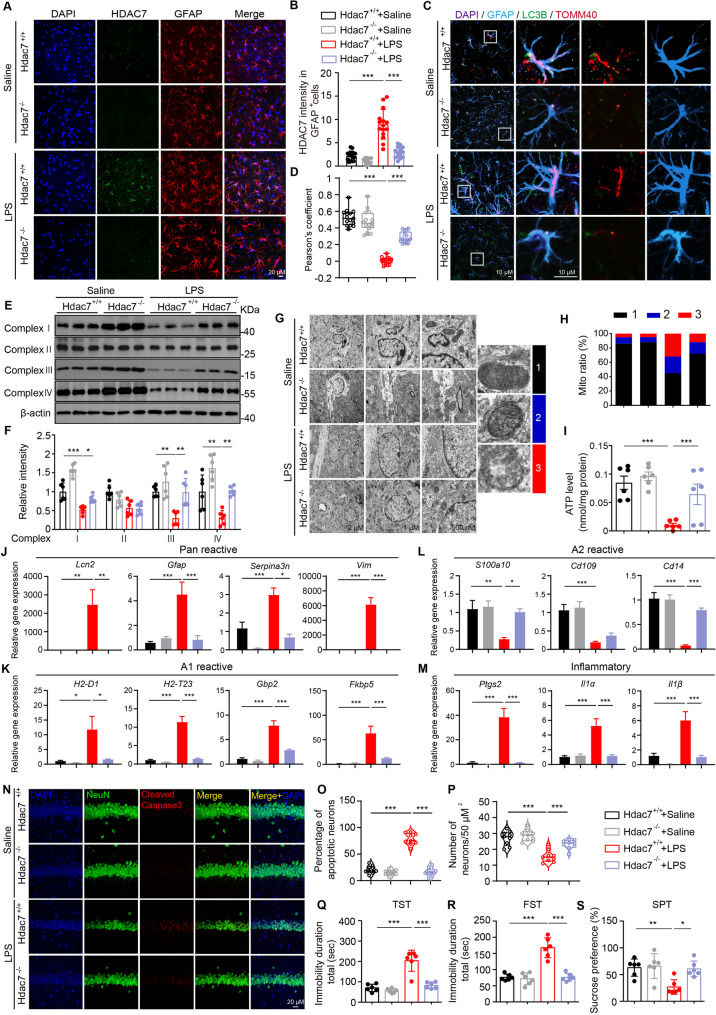
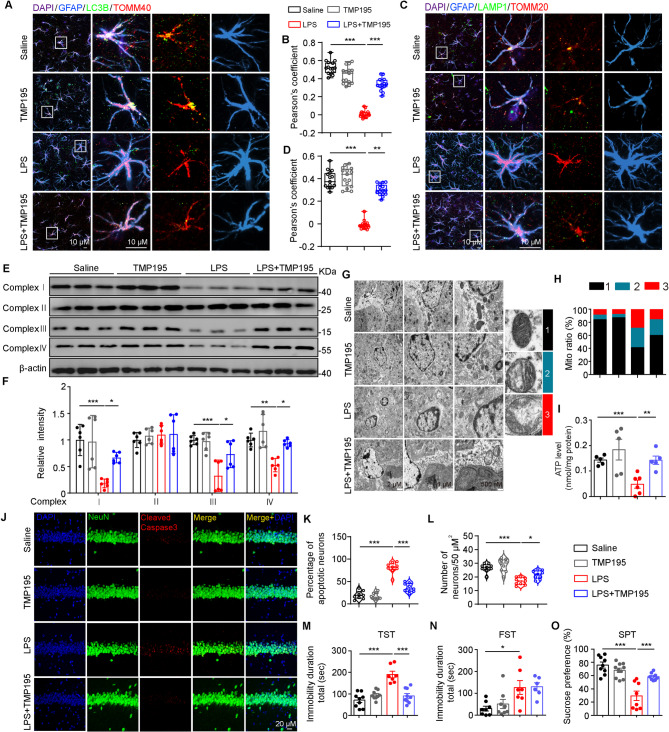
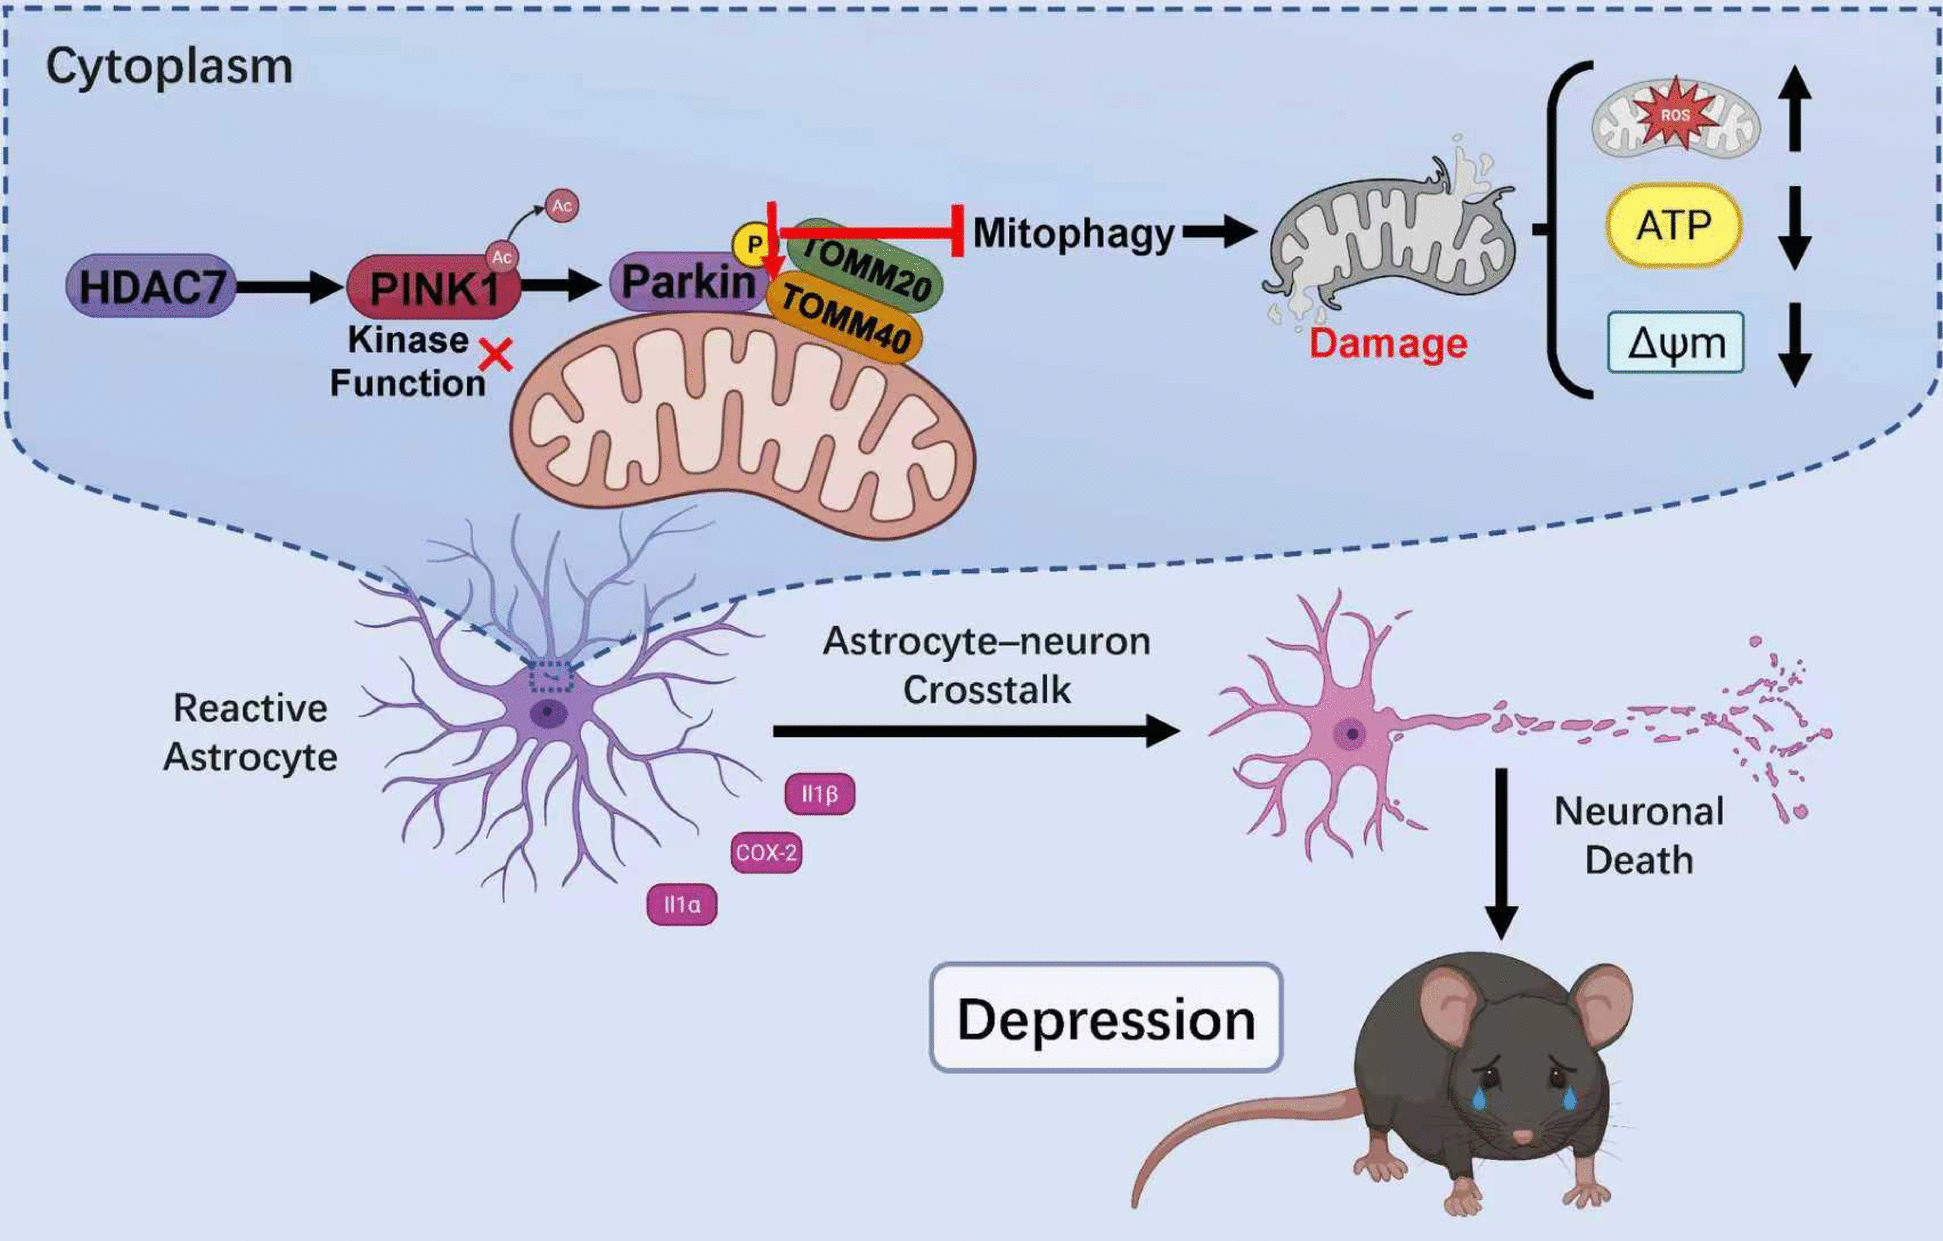
Major depressive disorder (MDD) is a prevalent mental disorder and the leading cause of disability worldwide. Emerging evidence indicates that dysregulation of astrocyte mitochondria metabolism contributes to the pathophysiology of depression. However, the molecular mechanisms underlying the stress-induced astrocytic dysfunction remain poorly understood. Here, we show that impaired mitophagy, which occurring downstream of increased Class IIa histone deacetylases 7 (HDAC7) expression, play a critical role in astrocytic mitochondria dysfunction in a Lipopolysaccharide (LPS)-induced depression-like mouse model. Astrocyte-specific overexpression of HDAC7 in the hippocampus disrupted PTEN-induced putative kinase 1 (PINK1)-Parkinson protein 2 (Parkin)-dependent mitophagy, leading to reduced mitochondrial ATP release, neuronal damage and depressive-like behaviors. Mechanistically, HDAC7 impairs mitophagy by deacetylating PINK1, thereby suppressing phosphorylation of Parkin at Ser65 and inhibiting recruitment of downstream proteins translocase of outer mitochondrial membrane (TOMM) 20 and 40. Notably, Astrocyte-specific knockout or pharmacological inhibition of HDAC7 attenuates LPS-induced astrocytic mitophagy disruption, oxidative stress and mitochondrial adenosine triphosphate (ATP) release, alongside recovery of neuronal activity and reverse of depressive-like behavioral disorders in mice. Taken together, our data shed light on the intricate interplay between astrocytes, neuronal damage, and mitophagy in the etiology of depression, offering promising therapeutic targets for the treatment of MDD and other astrocyte-associated disorders.

Supplementary Information: The online version contains supplementary material available at 10.1186/s12974-025-03603-3.

Keywords: Astrocyte; Depression; HDAC7; Mitophagy; PINK1.


Conflict of interest statement

Declarations. Ethics approval and consent to participate: All animal studies were performed according to protocols approved by the Institutional Animal Care and Use Committee at Shenzhen University. Competing interests: The authors declare no competing interests.

Figures

Fig. 1
Fig. 1
Impaired mitophagy and mitochondrial function in astrocytes of LPS-induced mouse model of depression. A-C Behavioral tests of LPS- and control saline-injected mice. Total immobility time during 5 min in Tail suspension test (TST) (A), total immobility time during 5 min in forced swim test (FST) (B), and sucrose preference percentage in sucrose preference test (SPT) (C), N = 6 mice per group, unpaired Student’s t test. D and E Representative blots and quantification of mitochondrial proteins (TOMM20, TOMM40) and mitophagy-related proteins (PINK1, Parkin, LC3B-I/II, P62, LAMP1) in the hippocampal lysates of LPS- and saline-injected mice. N = 6 per group, unpaired Student’s t test. F Representative immunostaining images of GFAP, LC3B and TOMM40 in the ventral hippocampal sections of LPS- and saline-treated mice. G Colocalization between LC3B and TOMM40 was analyzed with Pearson’s correlation coefficient. H Representative immunostaining images of GFAP, LAMP1 and TOMM20 in the ventral hippocampal sections. I Colocalization between LAMP1 and TOMM20 was analyzed with Pearson’s correlation coefficient. J and K Representative blots and quantification of mitochondrial respiratory chain complexes (I–IV). N = 6 per group, unpaired Student’s t test. L and M Electron microscopy analysis of mitochondria in astrocytes of LPS- and saline-treated mice hippocampus. The mitochondria were divided into two categories based on the cristae morphology (black, intact; red, a severe loss of cristae). At least 100 mitochondria from three mice per group were analyzed, calculate the percentage of the two types of mitochondria. N DHE relative fluorescence intensity indicating ROS levels in LPS-treated and control primary astrocytes. N = 6 from three independent experiments, unpaired Student’s t test. Data are presented as the mean ± SEM, *p < 0.05; **p < 0.01; ***p < 0.001
Fig. 2
Fig. 2
Increased expression of HDAC7 in astrocytes correlates with autophagy impairments in LPS-induced mouse model of depression. A and B Western blotting analysis and quantification of HDAC4, HDAC5, HDAC7, and HDAC9 in mouse brain hippocampus tissue. N = 3 mice per group, unpaired Student’s t test. C-E Immunofluorescence analysis of HDAC7 colocalization and expression changes with: C astrocytes, D microglia, E neurons in the hippocampus of LPS- and saline-treated mice. N = 3 mice per group, unpaired Student’s t test. F-I Western blotting analysis and quantification of HDAC7 in primary cultured cells as indicated: F astrocytes, G microglia, H neurons. N = 3 per group, unpaired Student’s t test. J-M Immunofluorescence staining and correlation analysis of HDAC7 with autophagy markers LC3B (J) or LAMP1 (L) in GFAP positive cells in the hippocampus of LPS- and saline-treated mice. Correlation between HDAC7 and LC3B or LAMP1 are analyzed with simple linear regression. N = 30 cells from three mice. Data are presented as mean ± SEM, *p < 0.05; **p < 0.01; ***p < 0.001
Fig. 3
Fig. 3
Astrocyte-specific overexpression of HDAC7 disrupts mitophagy and induces neuronal damage and depression-like behavior in mice. A Schematic illustration of AAVs constructed with HDAC7 or control vector and the in vivo experimental timeline. B Representative immunostaining and Western blotting analysis showing the expression of AAV-GfaABC1D-HDAC7-HA in the ventral hippocampus of mice. C-F Immunofluorescence staining and correlation analysis of LC3B with TOMM40 (C) and LAMP1 with TOMM20 (E) in GFAP positive cells in the hippocampus of HDAC7-overexpressing and control mice. G and H Electron microscopy analysis showing astrocytic mitochondria in the hippocampus of HDAC7-overexpressing and control mice. The mitochondria were divided into two categories based on the cristae morphology (black, intact; orange, a severe loss of cristae). At least 100 mitochondria from three mice per group were analyzed, calculate the percentage of the two types of mitochondria. I and J Representative western blotting images of mitochondrial respiratory chain complexes (Complex I-IV) protein expression in hippocampal tissue. N = 6 per group, unpaired Student’s t test. K-M Immunofluorescence staining analysis of NeuN and Cleaved-caspase3 in hippocampus of mice. N = 9 slices from three mice per group, unpaired Student’s t test. N Total immobility time during 5 min in TST, O Total immobility time during 5 min in FST, P Sucrose preference percentage (%) in SPT, N = 5 mice per group, unpaired Student’s t test. Data are presented as the mean ± SEM, *p < 0.05; **p < 0.01; ***p < 0.001
Fig. 4
Fig. 4
HDAC7 binds to and deacetylates PINK1, resulting in mitophagy disruption, mitochondria impairments and astrocyte neurotoxicity. A and B Co-immunoprecipitation (Co-IP) assay showing the interaction between HDAC7 and PINK1 and the acetylation level of PINK1 in HEK293T cells co-transfected with PINK1-HA, HDAC7-GFP or control vector. N = 6 for each group, unpaired Student’s t test. C and D Co-IP assay showing the interaction between PINK1 and p-Parkin (S65), TOMM20, TOMM40 in HDAC7- or vector-overexpressing cells. N = 6 for each group, unpaired Student’s t test. E Representative living confocal images of MitoTracker Red (MTR) and exogenously expressed GFP-fused PINK1 in primary cultured astrocytes overexpressed with HDAC7 or control vector. F and G Representative immunostaining images and analysis of p-Parkin (S65) and PINK1 colocalization in primary astrocytes overexpressed with HDAC7 or control vector. H and I Representative immunostaining images and analysis of PINK1 and TOMM20 colocalization in primary astrocytes. J Cellular ATP level measurement, K TMRE fluorescence intensity reflecting mitochondrial membrane potential, and L DHE relative fluorescence intensity indicating ROS levels, in HDAC7-overexpressing and control astrocytes, N = 6 for each group, unpaired Student’s t test. M Experimental scheme to examine effects of astrocyte conditioned medium (CM) on neurons. N Calcein-AM/PI staining showing cell viability (green: live cells) and death (red: dead cells) of primary neurons treated with CM from HDAC7-overexpressing or control astrocytes. N = 3 independent experiments, unpaired Student’s t test. Data are presented as mean ± SEM, *p < 0.05; **p < 0.01; ***p < 0.001
Fig. 5
Fig. 5
HDAC7 knockout or inhibition significantly ameliorates mitochondrial dysfunction in astrocytes. A and B Representative blots and quantification of mitochondrial respiratory chain complexes (I–IV) in primary cultured control and HDAC7 knockout astrocytes treated with LPS. N = 6 per group, one-way ANOVA with Tukey’s post hoc tests. C and D DHE relative fluorescence intensity indicating ROS levels, E TMRE fluorescence intensity reflecting mitochondrial membrane potential, primary cultured control and HDAC7 knockout astrocytes treated with LPS. N = 6 per group, one-way ANOVA with Tukey’s post hoc tests. F and G Calcein-AM/PI staining analysis showing cell viability and death of primary neurons treated with CM from control and HDAC knockout astrocytes treated with LPS or vehicle. N = 3 per group, one-way ANOVA with Tukey’s post hoc tests. H and I Representative blots and quantification of mitochondrial respiratory chain complexes (I–IV) in primary cultured astrocytes treated with LPS and TMP195 or vehicle. N = 6 per group, one-way ANOVA with Tukey’s post hoc tests. J and K DHE analysis indicating ROS levels, L TMRE analysis reflecting mitochondrial membrane potential in astrocytes treated with LPS and TMP195 or vehicle. N = 6 per group, one-way ANOVA with Tukey’s post hoc tests. M and N Calcein-AM/PI staining analysis showing cell viability and death of primary neurons treated with CM from astrocytes treated with LPS and TMP195 or vehicle. N = 3 per group, one-way ANOVA with Tukey’s post hoc tests. Data are presented as the mean ± SEM, *p < 0.05; **p < 0.01; ***p < 0.001
Fig. 6
Fig. 6
Astrocyte-specific HDAC7 deletion alleviates mitochondrial damage, reduces astrocyte neurotoxic reactivity, and ameliorates depression-like behaviors in mice. A Immunofluorescent staining of HDAC7 and GFAP in the hippocampus from WT and HDAC7 knockout mice injected with LPS. B Quantitative analysis of HDAC7 intensity in GFAP positive cells. N = 15 sections from three mice per group, one-way ANOVA with Tukey’s post hoc tests. C and D Immunofluorescence staining and correlation analysis of LC3B with TOMM40 in GFAP positive cells in the hippocampus of WT and HDAC7 knockout mice injected with LPS. N = 15 from three mice per group, one-way ANOVA with Tukey’s post hoc tests. E and F Western blotting analysis of mitochondrial respiratory chain complexes (Complex I-IV) protein expression in hippocampal tissue of the four group mice. N = 6 per group, one-way ANOVA with Tukey’s post hoc tests. G and H Electron microscopy analysis showing astrocytic mitochondria in the hippocampus of the four group mice. The mitochondria were divided into three categories based on the cristae morphology (black, intact; blue, a slight loss of cristae; and red, a severe loss of cristae), At least 100 mitochondria from three mice per group were analyzed. Calculate the percentage of the three types of mitochondria are show (H). One-way ANOVA with Tukey’s post hoc tests. I Cellular ATP level measurement, N = 6 mice per group, one-way ANOVA with Tukey’s post hoc tests. J RT-qPCR analysis of pan-reactive astrocyte marker genes (Lcn2, Gfap, Serpina3, Vim), K A1 neurotoxic astrocyte marker genes (H2-D1, H2-T23, Gbp2, Fkbp5), L A2 neuroprotective astrocyte marker genes (S100a10, Cd109, Cd14), M and inflammatory genes (Ptgs2, Il1α, l1β) in the hippocampus of the four group mice. N = 6 mice per group, one-way ANOVA with Tukey’s post hoc tests. N-P Immunofluorescence staining analysis of NeuN and Cleaved-caspase3 in hippocampus of mice. N = 9 slices from three mice per group, one-way ANOVA with Tukey’s post hoc tests. Q Total immobility time during 5 min of TST, R Total immobility time during 5 min of FST, and S Sucrose preference percentage (%) of SPT in the four group mice. N = 6 mice per group, one-way ANOVA with Tukey’s post hoc tests. Data are presented as the mean ± SEM, *p < 0.05; **p < 0.01; ***p < 0.001
Fig. 7
Fig. 7
HDAC7 inhibition ameliorates impairments of astrocytic autophagy and mitochondria dynamics, reduces neuronal death, and ameliorates depression-like behaviors in LPS-induced mice model. A-D Immunofluorescence staining and correlation analysis of autophagy marker LC3B with mitochondrial protein TOMM40 (A and B), and lysosomal marker LAMP1 with mitochondrial protein TOMM20 (C and D) in GFAP positive cells in the hippocampus of LPS-induced mice treated with TMP195 or vehicle. Correlation between HDAC7 and LC3B or LAMP1 are analyzed with simple linear regression. N = 15 cells from three mice. E and F Representative bots and quantification of mitochondrial respiratory chain complexes (Complex I-IV) protein expression in hippocampal tissue of LPS-induced mice treated with TMP195 or vehicle. N = 6 per group, one-way ANOVA with Tukey’s post hoc tests. G and H Electron microscopy analysis showing astrocytic mitochondria in astrocytes in the hippocampus of the four group mice. The mitochondria were divided into three categories similarly as indicated in Fig. 6F. At least 100 mitochondria from three mice per group were analyzed. Calculate the percentage of the three types of mitochondria are show (G). One-way ANOVA with Tukey’s post hoc tests. I Quantification of ATP level in the four group mice. N = 6 mice per group, one-way ANOVA with Tukey’s post hoc tests. J-L Immunostaining and quantification analysis of NeuN and cleaved caspase-3 in hippocampus of mice. N = 9 slices from three mice per group, one-way ANOVA with Tukey’s post hoc tests. M Total immobility time in TST, N Total immobility time in FST, and O Sucrose preference percentage (%) in SPT of the four group mice. N = 6 to 10 mice per group, one-way ANOVA with Tukey’s post hoc tests. Data are presented as the mean ± SEM, *p < 0.05; **p < 0.01; ***p < 0.001
Fig. 8
Fig. 8
Proposed molecular mechanism by which HDAC7 impairs mitophagy in astrocytes leading to depression-like behaviors in mice. In astrocytes, LPS triggers HDAC7 upregulation, which binds to and deacetylates PINK1, hindering its mitochondrial translocation and reducing Parkin phosphorylation at p65. This diminishes Parkin’s binding to TOMM20 and TOMM40, disrupting mitophagy and causing mitochondrial dysfunction, characterized by increased oxidative stress, ROS release, decreased ATP production, and lower mitochondrial membrane potential. These defects impair astrocyte function, leading to a reactive phenotype that disrupts neuron communication, increases neuronal apoptosis, and induces depression-like behaviors in mice

References

    1. Hu Y, Ali T, Mou S, et al. PKR inhibition prevents neuroinflammation and rescues depressive-like behaviors via BDNF/TrkB signaling. J Neuroimmune Pharmacol. 2025;20(1):13. 10.1007/s11481-025-10180-y. - PubMed
    1. Ali T, Rahman SU, Hao Q, et al. Melatonin prevents neuroinflammation and relieves depression by attenuating autophagy impairment through FOXO3a regulation. J Pineal Res. 2020;69(2):e12667. 10.1111/jpi.12667. - PubMed
    1. Ju Y, Ou W, Chen H, et al. Agomelatine as adjunctive therapy with SSRIs or SNRIs for major depressive disorder: a multicentre, double-blind, randomized, placebo-controlled trial. BMC Med. 2025;23(1):137. 10.1186/s12916-025-03951-0. - PMC - PubMed
    1. Bonvento G, Bolaños JP. Astrocyte-neuron metabolic cooperation shapes brain activity. Cell Metab. 2021;33(8):1546–64. 10.1016/j.cmet.2021.07.006. - PubMed
    1. Pascual O, Casper KB, Kubera C, et al. Astrocytic purinergic signaling coordinates synaptic networks. Science. 2005;310(5745):113–6. 10.1126/science.1116916. - PubMed

LinkOut - more resources