. 2025 Nov 25;16(1):2159.
doi: 10.1007/s12672-025-03935-9.

Elevated expression of SIGLEC8 in skin cutaneous melanoma predicts better prognosis associated with hematopoietic cell lineage pathway

Affiliations

Elevated expression of SIGLEC8 in skin cutaneous melanoma predicts better prognosis associated with hematopoietic cell lineage pathway

Feng Li et al. Discov Oncol. .

Abstract

Background: Cutaneous melanoma (SKCM) is becoming more common. Current prognostic markers-TNM stage, BRAF mutation status, and tumor mutational burden (TMB)-do not offer precise predictions. Recent studies point to a key role for the tumor microenvironment. To date, we do not know how SIGLEC8 (a sialic acid-binding immunoglobulin‑like lectin) affects immune regulation or prognosis in SKCM.

Methods: We used logistic regression to link SIGLEC8 expression with clinical and pathological features. We then applied Cox regression and Kaplan‑Meier survival analysis to assess how these features relate to overall survival (OS). For differential genes, we performed Gene Ontology (GO) and KEGG enrichment tests by combining fold‑change thresholds with hypergeometric statistics. Finally, we ran Pearson and Spearman correlations to study the relationship between SIGLEC8 and immune‑infiltration markers.

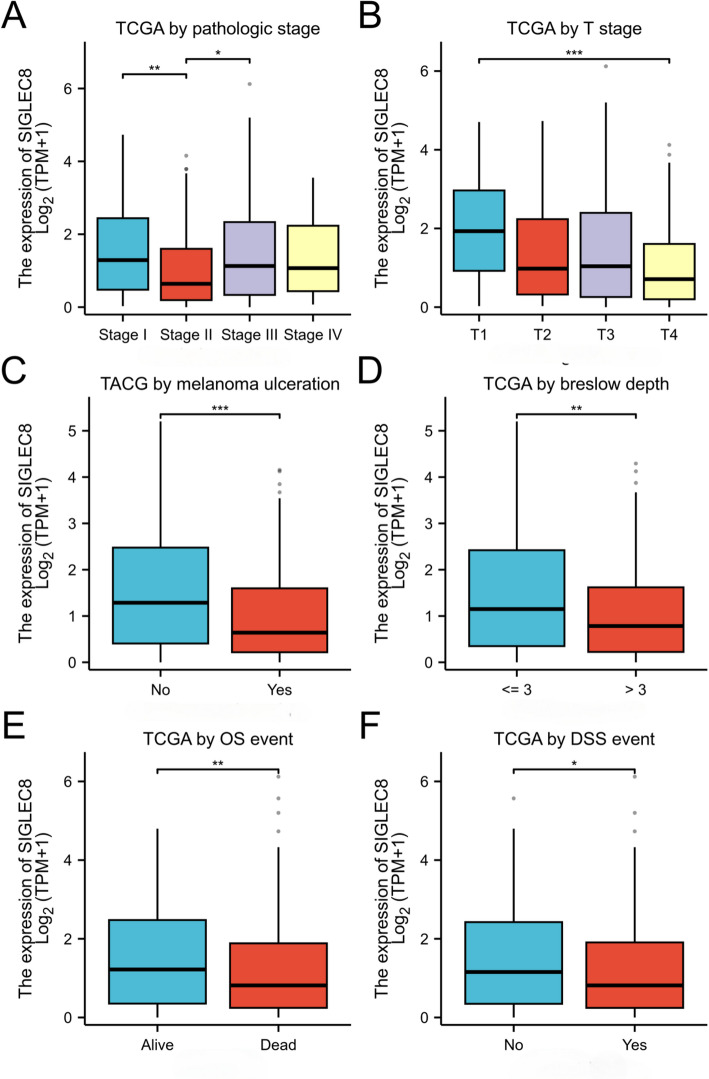
Results: From TCGA, we selected SKCM cases that had both complete clinical records and transcriptome data. We excluded 8.2% of samples due to missing information; this did not introduce any bias in age or sex. Patients with low SIGLEC8 levels tended to have T4 tumors, Breslow depth over 3 mm, ulceration, and more advanced disease (p < 0.05). High SIGLEC8 expression was linked to better OS (p < 0.001) in Cox analysis. This prognostic value held true across subgroups defined by age, gender, BMI, and stage (all p < 0.05). Differential expression analysis highlighted three immune genes-FCER2, CR2, and MS4A1-as strongly correlated with SIGLEC8. These findings point to a role in B‑cell and CD8⁺ T‑cell pathways within the hematopoietic lineage.

Conclusions: High SIGLEC8 expression predicts longer survival in SKCM. We propose that SIGLEC8 boosts antitumor immunity by influencing B‑cell and T‑cell pathways (including FCER2, CR2, MS4A1, and CD8A/B) in the tumor microenvironment. SIGLEC8 thus shows promise as a low‑cost prognostic biomarker and a potential therapeutic target. Table S1 shows cancer-type-specific prognostic effects for SIGLEC8: in SKCM higher SIGLEC8 expression associates with improved survival, whereas prognostic directionality varies across other tumor types. A pan-cancer comparison revealed cancer-type-specific prognostic effects for SIGLEC8: in SKCM higher SIGLEC8 expression associates with improved survival, whereas prognostic directionality varies across other tumor types.

Keywords: Prognostic biomarker; SIGLEC8; SKCM; TCGA; Tumor microenvironment.


Conflict of interest statement

Declarations. Ethics approval and consent to participate: Not applicable. This study utilized publicly available, de-identified data from The Cancer Genome Atlas (TCGA). Since no new human participants were recruited and no identifiable private information was accessed or generated, ethical approval for this specific retrospective analysis was not required. The original TCGA study protocols received approval from the relevant Institutional Review Boards (IRBs). Written informed consent was obtained from all participants in the original TCGA study. Given the exclusive use of de-identified, publicly available data from TCGA in this secondary analysis, obtaining new consent to participate was not required. Consent for publication: Informed consent for publication was obtained from all participants during their enrollment in the original TCGA study. Given the exclusive use of de-identified, aggregated data in this analysis, separate consent for publication is not required. Competing interests: The authors declare no competing interests.

Figures

Fig. 1
Fig. 1
Differential expression of SIGLEC8 in SKCM clinicopathologic subgroups. A, Comparison of SIGLEC8 expression across pathologic stages; B, comparison across pathologic T stages; C, comparison based on ulceration status; D, comparison by breslow depth; E, comparison between alive and deceased patients; F, comparison between patients with and without disease-specific survival (DSS) events. Statistical significance is indicated (*p < 0.05, **p < 0.01, ***p < 0.001)
Fig. 2
Fig. 2
Volcano plot of differential gene expression between SIGLEC8 high and low expression groups. The x-axis represents log2 fold change (high vs. low SIGLEC8) and the y-axis represents − log10(Benjamini–Hochberg adjusted p-value). Each point corresponds to one gene. Red points indicate significantly up-regulated genes in the SIGLEC8 high group (|log2FC| ≥ 1, adjusted p < 0.05). Purple points indicate significantly down-regulated genes (|log2FC| ≥ 1, adjusted p < 0.05). Grey points indicate genes that did not meet significance thresholds. Vertical dashed lines denote ± 1 log2 fold change (i.e., 2-fold up/down), and the horizontal dashed line denotes adjusted p = 0.05 (− log10(0.05) ≈ 1.301). The top 20 up- and top 20 down-regulated genes are listed in Table 4
Fig. 3
Fig. 3
Differential gene correlation analysis heat map dependent on SIGLEC8. Each cell represents the pairwise correlation between two genes. Color gradient indicates correlation strength and direction (red indicates positive correlations, blue indicates negative correlations; color saturation corresponds to the absolute value of the correlation coefficient) (*p < 0.05)
Fig. 4
Fig. 4
Prognostic significance of SIGLEC8 expression in SKCM patients based on survival analysis and clinical subgroups. A Time-dependent ROC curve for 1-, 3-, and 5-year survival prediction; B Kaplan–Meier survival curve for all patients stratified by SIGLEC8 expression; C survival analysis for pathologic M0 stage; D, M1 stage; E, N0 stage; F, N1–N3 stage; G, pathologic stage I–II; H, stage III–IV; I, T4 stage. Survival differences were assessed using log-rank test and hazard ratios (HR) with 95% confidence intervals (CI) are shown (All the p – values < 0.05). Blue indicates low SIGLEC8 expression, and red indicates high expression
Fig. 5
Fig. 5
Survival analysis of SIGLEC8 expression stratified by demographic and clinical factors. A Patients aged > 60; B patients aged ≤ 60; C patients with height ≥ 170 cm; D male patients; E female patients; F patients weighing ≤ 70 kg; G patients weighing > 70 kg; H patients with BMI ≤ 25; I patients with BMI > 25. Kaplan–Meier curves are shown with corresponding HR, 95% CI, and all the p-values < 0.05. Blue indicates low SIGLEC8 expression, and red indicates high expression
Fig. 6
Fig. 6
Nomogram predicting 1-year survival probability in SKCM patients. The nomogram integrates clinical variables (e.g. age, gender, weight, height, BMI, pathologic stage, tumor site, Breslow depth, ulceration status, radiation therapy) to estimate 1-year survival. Each variable contributes to a point score which maps to a linear predictor and final survival probability
Fig. 7
Fig. 7
Gene ontology (GO), KEGG combine with logFC analysis. A Dot plot of enriched GO terms (BP, CC, MF) and KEGG pathway, with dot size indicating gene count and color indicating adjusted p-value; B circular plot showing gene-to-GO term connections, colored by log₂ fold change; C circular plot of gene distribution across GO terms, colored by log₂ fold change (red for CC, blue for BP, grey for MF); D scatter plot showing GO term enrichment with Z-score and –log₁₀(P adj). (blue represents upregulated genes, red represents downregulated genes)
Fig. 8
Fig. 8
Correlation between SIGLEC8 expression and immune cell infiltration. A Correlation between SIGLEC8 expression and infiltration of various immune cell types (e.g., T cells, NK cells and so on), with dot color representing p-value and size indicating correlation strength; B scatter plot of dendritic cell (aDC) enrichment scores versus SIGLEC8 expression with Spearman correlation coefficient; C box plot comparing aDC infiltration between high and low SIGLEC8 expression groups. (***p < 0.001)
Fig. 9
Fig. 9
Spearman correlation analyses between SIGLEC8 expression and established immunotherapy biomarkers in TCGA-SKCM cohort. A Correlation between SIGLEC8 and PD-L1 (CD274) expression levels. B Correlation between SIGLEC8 and interferon-gamma (IFN-γ/IFNG) expression levels. C Correlation between SIGLEC8 and tumor mutational burden (TMB). Each scatter plot shows individual patient samples with correlation coefficient (r) and statistical significance (p-value) indicated. All correlations demonstrate statistically significant positive associations, suggesting potential relationships between SIGLEC8 expression and immunotherapy response biomarkers
Fig. 10
Fig. 10
The involvement of the SIGLEC8 gene in the ‘Hematopoietic Cell Lineage’ pathway within the pathophysiological context of SKCM. This is the part of ‘Hematopoietic Cell Lineage’ pathway from KEGG

References

    1. Eggermont AM, Spatz A, Robert C. Cutaneous melanoma. Lancet. 2014;383(9919):816–827. - PubMed
    1. Siegel RL, Miller KD, Wagle NS, Jemal A. Cancer statistics, 2023. CA Cancer J Clin. 2023;73(1):17–48. - PubMed
    1. Karimkhani C, Green AC, Nijsten T, Weinstock MA, Dellavalle RP, Naghavi M, Fitzmaurice C. The global burden of melanoma: results from the global burden of disease study 2015. Br J Dermatol. 2017;177(1):134–40. - PMC - PubMed
    1. Whiteman DC, Green AC, Olsen CM. The growing burden of invasive melanoma: projections of incidence rates and numbers of new cases in six susceptible populations through 2031. J Invest Dermatol. 2016;136(6):1161–71. - PubMed
    1. Tímár J, Ladányi A. Molecular pathology of skin melanoma: Epidemiology, differential Diagnostics, prognosis and therapy prediction. Int J Mol Sci. 2022;23(10):5384. - PMC - PubMed

LinkOut - more resources