

Orthonormal pairwise logratio selection (OPALS) algorithm for compositional data analysis in high dimensions
- PMID: 41293320
- PMCID: PMC12641611
- DOI: 10.1093/bioadv/vbaf229
Orthonormal pairwise logratio selection (OPALS) algorithm for compositional data analysis in high dimensions
Abstract
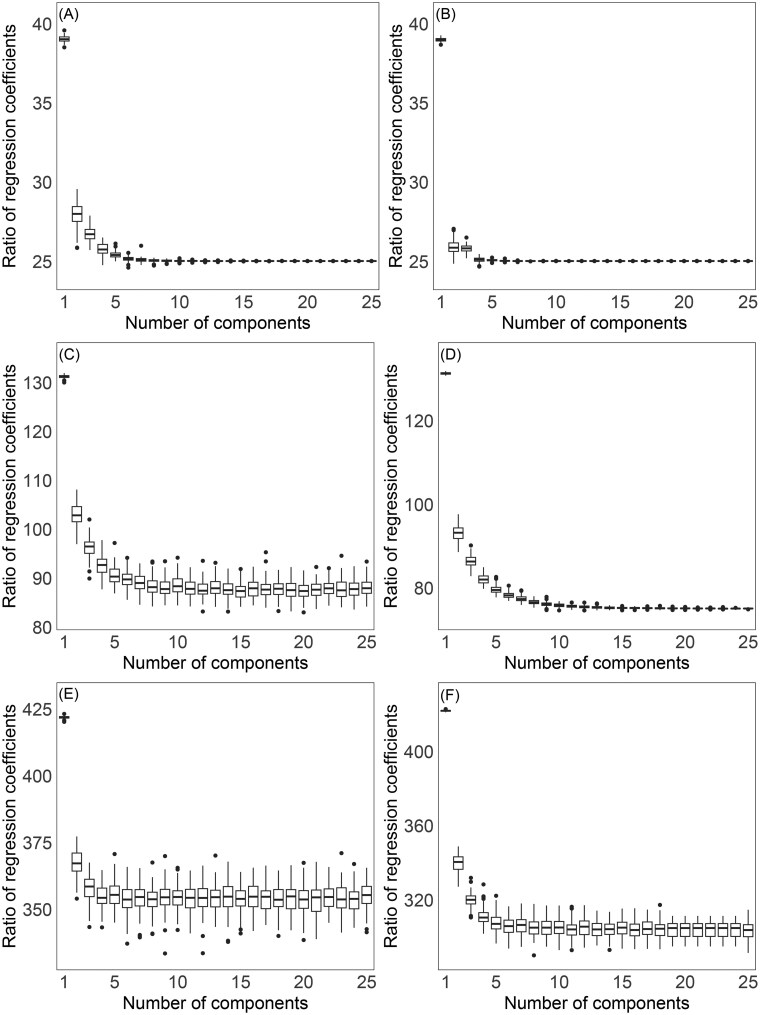
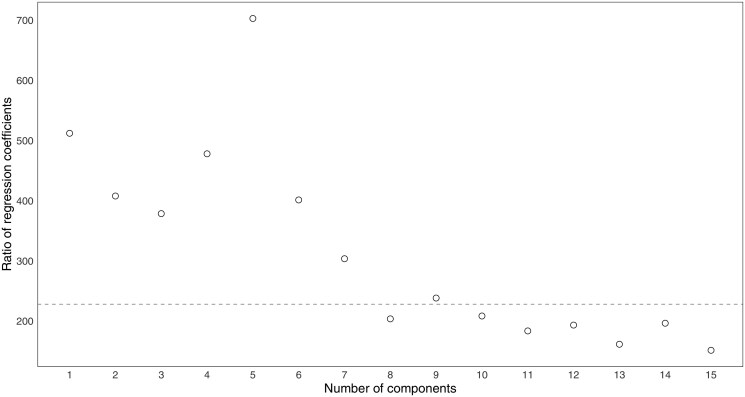
Summary: In the analysis of compositional data, the most fundamental information is conveyed by the pairwise logratios between components. While logratio coordinate representations, such as balances and pivot coordinates, are widely used to aggregate such information into higher-level relationships, there are instances where a fine-grained representation using all pairwise logratios can be advantageous. Performing this within an orthonormal (or orthogonal) logratio coordinate framework becomes particularly challenging for high-dimensional compositions, since a composition with D parts results in pairwise logratios (excluding reciprocals). This work presents an efficient algorithm (OPALS) based on Latin squares theory to obtain all orthonormal pairwise logratios from just logratio coordinate systems. Thus, the computational burden associated with using such representation for data analysis and modelling in high dimensions is notably alleviated, or even made feasible. Moreover, the relationship between estimates from orthonormal pairwise logratios and ordinary pivot coordinates is discussed in the context of regression and classification analysis.
Availability and implementation: The OPALS algorithm is described in detail in this article and can be implemented directly from the provided methodology. The performance and properties of the method are illustrated through two examples using contemporary molecular biology data.
© The Author(s) 2025. Published by Oxford University Press.
Conflict of interest statement
The authors declare that they have no known competing financial interests or personal relationships that could have appeared to influence the work reported in this paper.
Figures


References
-
- Aitchison J. The statistical analysis of compositional data. J R Stat Soc Ser B Stat Methodol 1982;44:139–60.
-
- Aitchison J. The Statistical Analysis of Compositional Data. London: Chapman and Hall, 1986.
-
- Barker M, Rayens W. Partial least squares for discrimination. J Chemom 2003;17:166–73.
LinkOut - more resources
Full Text Sources
