. 2025 Nov 8:57:137-153.
doi: 10.1016/j.bioactmat.2025.11.007. eCollection 2026 Mar.

Saliva-driven surface-engineered Bacteroides thetaiotaomicron alleviates hypertension

Affiliations

Saliva-driven surface-engineered Bacteroides thetaiotaomicron alleviates hypertension

Shuo Xu et al. Bioact Mater. .

Abstract

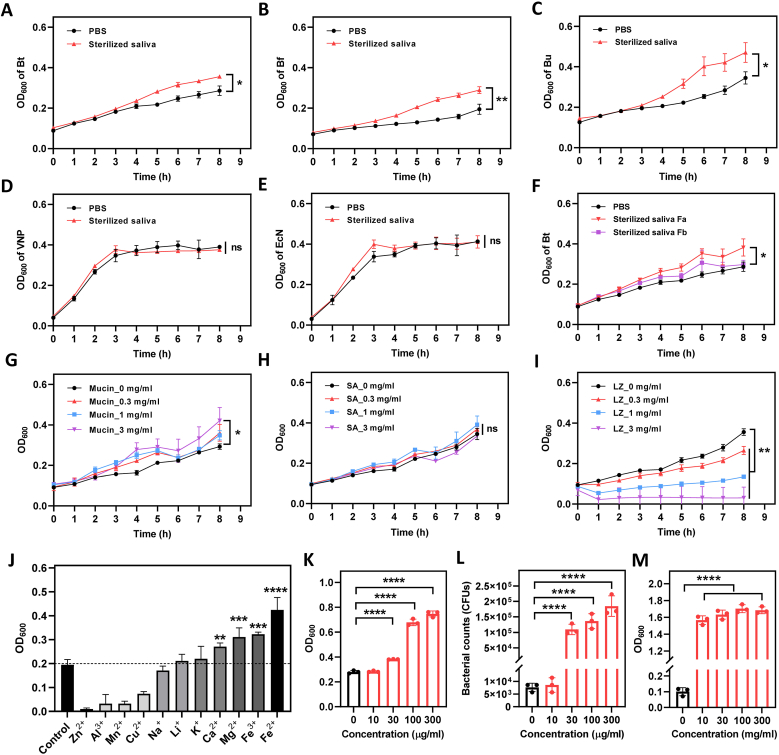
Oral environment is closely linked to blood pressure regulation. However, the underlying mechanisms remain poorly understood, and strategies for harnessing this relationship to modulate blood pressure are still scarce. Saliva, abundant in the oral cavity, was demonstrated to play a critical role in sustaining the abundance of gut Bacteroides thetaiotaomicron (Bt), contributing to blood pressure reduction. Metal ions and mucins in saliva were further identified as factors responsible for Bt growth. Building on this discovery, we developed a saliva-inspired, surface-engineered Bt (Bt-FM) that reconstructs the cooperative microenvironment formed by metal ions and mucins in natural saliva. The biomimetic Fe2+-chitosan-mucin (FM) layer recapitulates both the protective and regulatory features of saliva, enabling Bt to maintain structural integrity and metabolic activity under gastrointestinal stress. This design transforms salivary cues into a functional engineering strategy that enhances Bt stability, colonization, and antihypertensive efficacy in vivo. Further exploration revealed that anti-hypertensive effects involve synthesizing short-chain fatty acids, modulating sodium ion channels, and maintaining gut immune homeostasis. This work pioneers a dynamic, material-based platform to probiotic enhancement for hypertension management.

Keywords: Hypertension; Probiotic; Saliva; Surface-engineering; gut microbiota.


Conflict of interest statement

The authors disclose no conflict of interest.

Figures

Image 1
Graphical abstract
Fig. 1
Fig. 1
Schematic illustration of the fabrication and function of saliva-driven surface engineering of Bacteroides thetaiotaomicron (Bt-FM). (A) Schematic overview of the discovery and rationale. Saliva collected from healthy individuals was administered to hypertensive mice, resulting in increased gut colonization of Bacteroides thetaiotaomicron (Bt) and reduced blood pressure. Bt was identified as a key bacterium mediating this beneficial effect. (B) Fabrication of Bt-FM. Inspired by the growth-promoting properties of saliva—primarily driven by mucins and metal ions (e.g., Fe2+)—a surface engineering strategy was developed. Bt was coated with a chitosan–Fe2+ complex, followed by the addition of mucin to form a multilayer structure via electrostatic interactions and hydrogen bonding. This results in the formation of Bt-FM, a surface-engineered probiotic strain with enhanced viability. (C) Function of Bt-FM. Following oral administration of Bt-FM, various characterization methods were employed to assess its proliferation, resistance to gastrointestinal stressors, and colonization in the gut. The detailed mechanism underlying Bt-FM's effect on blood pressure regulation involves the production of short-chain fatty acids (SCFAs), the regulation of sodium channels (α-ENaC), and immune modulation. This schematic illustration was created by Biorender.com.
Fig. 2
Fig. 2
Saliva collected from healthy individuals mitigates angiotensin II (Ang II)-induced hypertension in mice and increases the abundance of Bacteroides thetaiotaomicron in feces. (A, B) Radiotelemetry monitoring of systolic blood pressure (SBP) (A) and diastolic blood pressure (DBP) (B) in mice infused with Ang II for a duration of 4 weeks and concurrently gavaged with PBS (HTN + Veh) or saliva (HTN + Saliva). (C) The heart weight to body weight ratio of HTN + Veh mice and HTN + Saliva mice. (D) The kidney weight to body weight ratio of HTN + Veh mice and HTN + Saliva mice. (E) Representative hematoxylin and eosin (H&E) staining of renal sections. (F) Representative H&E staining of aortic sections. (G) Representative Masson's trichrome staining of renal sections. (H) Representative Masson's trichrome staining of aortic sections. (I) Quantification of mean glomerular area of kidneys. (J) Quantification of wall thickness of aortas. (K) Quantification of fibrosis areas of kidneys. (L) Quantification of fibrosis areas of aortas. (M) Quantitative real-time polymerase chain reaction (qRT-PCR) analysis of genes related to renal damage. (N) QRT-PCR analysis of genes related to vascular inflammation in aortas. (O) The α-diversity indices including Chao 1, Faith's phylogenetic diversity (Faith pd) and Shannon index of feces of HTN + Veh mice and HTN + Saliva mice. (P) The β-diversity indices of feces of HTN + Veh mice and HTN + Saliva mice. (Q) Firmicutes/Bacteroidetes (F/B) ratio. (R) Heatmap of the differential abundance of the top 8 bacterial species between HTN + Veh and HTN + Saliva mice based on 16S rRNA gene sequencing data analysis. (S) Differently abundant taxa in HTN + Veh and HTN + Saliva mice identified by linear discriminant analysis (LDA) effect size (LEfSe) analysis. (T) The abundance of Bacteroides thetaiotaomicron in feces between HTN + Veh and HTN + Saliva mice assessed by 16S rRNA gene sequencing. (U) The abundance of Bacteroides thetaiotaomicron in feces of individuals without hypertension (nHTN) and those with hypertension (HTN) assessed by metagenomic sequencing. (V) The abundance of Bacteroides thetaiotaomicron in feces of individuals without hypertension (Health) and those with hypertension (Hypertension) assessed by 16S rRNA gene sequencing from the GMrepo database. All scale bars, 50 μm. Values are expressed as mean ± SEM. n = 6–10. ∗p < 0.05, ∗∗p < 0.01.
Fig. 3
Fig. 3
Mucins and metal ions in saliva enhancing Bacteroides growth. (A–E) Effects of sterilized saliva on the growths of Bacteroides thetaiotaomicron (Bt, A), Bacteroides fragilis (Bf, B), Bacteroides uniformis (Bu, C), Salmonella typhimurium VNP20009 (VNP, D) and Escherichia coli Nissle 1917 (EcN, E) by measuring the optical density at 600 nm (OD600). (F) Impact of isolated fractions from sterilized saliva on Bt growth: Fraction a (Fa, the precipitate), Fraction b (Fb, the supernatant). (G–I) Effects of mucin (G), salivary amylase (SA, H), and lysozyme (LZ, I) on Bt growth. (J) The influence of various metal ions on Bt proliferation. (K) Effect of Fe2+ on Bt proliferation across concentrations ranging from 0 to 300 μg/mL (L, M) Bt cells cultivated with Fe2+ were harvested and exposed to O2 overnight, and the survival of Bt cells was evaluated by plating (L) and measuring OD600 (M). Values are expressed as mean ± SEM. n = 3. ∗p < 0.05, ∗∗p < 0.01, ∗∗∗p < 0.001, ∗∗∗∗p < 0.0001.
Fig. 4
Fig. 4
Saliva-driven surface engineering of Bacteroides thetaiotaomicron. (A) The potential toxicity of 4 polymer materials capable of binding metal ions and forming a network on the bacterial membrane was assessed, including chitosan (CS), polyethyleneimine (PEI), tannic acid (TA), and epigallocatechin-3-gallate (EGCG). (B–D) The ratio of Fe2+ and CS was optimized to achieve the maximal network-forming affinity on Bt cells using flow cytometry. (E) Laser scanning confocal microscopy (LSCM) confirmed the formation of both Cy5.5-stained mucin and FITC-stained chitosan layer on the surface of Bt and Fe2+_CS_mucin (FM) coated Bt (Bt-FM) cells with nucleic acids marked by DAPI. Scale bar: 5 μm. (F) Transmission electron microscopy (TEM) characterization of Bt and Bt-FM. Scale bar: 1 μm. (G) Scanning electron microscopy (SEM) characterization of Bt and Bt-FM. (H) The presence of both FITC-stained chitosan and Cy5.5-stained mucin layer on Bt cells was confirmed by flow cytometry. (I) The ratio of Bt cells marked by dual signals (CS_FITC and mucin_Cy5.5) was quantified using flow cytometry. Values are expressed as mean ± SEM. n = 3. ∗p < 0.05, ∗∗p < 0.01, ∗∗∗p < 0.001, ∗∗∗∗p < 0.0001.
Fig. 5
Fig. 5
Characterization of surface-engineered Bacteroides thetaiotaomicron. (A) Native and coated Bt were cultured in BHI medium and the proliferation was monitored at 4 and 8 h by measuring OD600. (B, C) The survival of native and coated Bt was assessed by plating (B) and measuring OD600 (C) after incubation in simulated gastric fluid (SGF) supplemented with pepsin (pH 1.2) for 10 min. (D–F) The cytoprotective effect of the coating was evaluated under unfavorable conditions, including exposure to an antibiotic cocktail of apramycin and ampicillin (D, E) and UV irradiation (1000 μJ/cm2) (F). (G–J) The fluorescence signal of Bt labeled with Cy5.5 was recorded using an in vivo imaging system (IVIS) to confirm coating-assisted attachment to the intestinal mucosa (G, H). Scale bar: 1 cm. The numbers of Bt and Bt-FM attached onto the mucosal layers were further quantified by tissue homogenization and plating (I, J). (K) Coating-mediated in vivo colonization of Bt and Bt-FM in mice. Bt were labeled by Cy5.5-NHS for tracking. Following oral gavage of native Bt or Bt-FM, the intestinal tracts were collected 12 h post-administration and analyzed via IVIS imagin. Scale bar: 2 cm. (L) Fluorescence intensities of Bt detected from the isolated intestinal tracks by IVIS. (M) Fecal samples were collected at 6, 12, 24, 48, 72, and 168 h post-administration for Bt quantification via qPCR. Values are expressed as mean ± SEM. n = 3–6. ∗p < 0.05, ∗∗p < 0.01, ∗∗∗p < 0.001, ∗∗∗∗p < 0.0001.
Fig. 6
Fig. 6
Enhanced hypertension therapy with surface-engineered Bacteroides thetaiotaomicron in mice. (A, B) Noninvasive tail-cuff monitoring of systolic blood pressure (SBP) (A) and diastolic blood pressure (DBP) (B) in mice infused with Ang II for 4 weeks and concurrently gavaged with PBS (HTN + Veh), Bacteroides thetaiotaomicron (HTN + Bt), or surface-engineered Bacteroides thetaiotaomicron (HTN + Bt-FM). (C) The heart weight to body weight ratio in HTN + Veh, HTN + Bt and HTN + Bt-FM mice. (D) The kidney weight to body weight ratio in HTN + Veh, HTN + Bt and HTN + Bt-FM mice. (E) Representative hematoxylin and eosin (H&E) staining of renal sections. (F) Representative H&E staining of aortic sections. (G) Representative Masson's trichrome staining of renal sections. (H) Representative Masson's trichrome staining of aortic sections. (I) Quantification of mean glomerular area of kidneys. (J) Quantification of wall thickness of aortas. (K) Quantification of fibrosis areas of kidneys. (L) Quantification of fibrosis areas of aortas. (M) Quantification of fibrosis areas of kidneys. (N) Quantification of fibrosis areas of aortas. All scale bars, 50 μm. Values are expressed as mean ± SEM. n = 6–10. ∗p < 0.05, ∗∗p < 0.01.
Fig. 7
Fig. 7
Enhanced hypertension therapy with surface-engineered Bacteroides thetaiotaomicron by regulating ENaC levels and compounding short-chain fatty acids (SCFAs) in mice. (A) Volcano plot of RNA-seq data demonstrating differentially expressed genes between HTN + Veh group and HTN + Bt group using a cut-off value of P < 0.05 and log 2 (fold change) < −1 for downregulated genes or > 1 for upregulated genes. (B) Gene set enrichment analysis (GSEA) of RNA-seq data. NES, nominal enrichment score; FDR, false discovery rate. (C) Heatmap presentation of genes in the sodium channel complex. (D) Representative immunofluorescence staining α-ENaC in mouse small intestine and colon. (E) QRT-PCR analysis of α-ENaC and genes related to inflammation in Caco2 cells. N = 4. (F) QRT-PCR analysis of α-ENaC and genes related to inflammation in HT-29 cells. N = 4. (G) QRT-PCR analysis of the abundance of Bacteroides thetaiotaomicron in feces of mice orally gavaged with Bacteroides thetaiotaomicron and infused with AngII. (H) Pearson correlation of Bacteroides thetaiotaomicron and SBP in HTN + Bt mice. (I) Pearson correlation of Bacteroides thetaiotaomicron and DBP in HTN + Bt mice. (J, K) Levels of SCFAs in feces of HTN + Veh and HTN + Bt mice analyzed using LC-MS/MS. n = 5. (L) QRT-PCR analysis of SCFA receptors in mouse colon. N = 5. (M) QRT-PCR analysis of SCFA receptors in Caco2 cells. N = 4. (N) QRT-PCR analysis of SCFA receptors in mouse small intestine. N = 5. (O) QRT-PCR analysis of SCFA receptors in HT-29 cells. N = 4. (P, Q) Levels of SCFAs in feces of HTN + Bt and HTN + Bt-FM mice analyzed using LC-MS/MS (n = 5/group). (R, S) Levels of SCFAs in sera of HTN + Bt and HTN + Bt-FM mice analyzed using LC-MS/MS. n = 5. (T) Representative immunofluorescence staining of α-ENaC in mouse small intestine and colon. (U, V) Quantification of α-ENaC fluorescence as a percentage of total area in the small intestine (U) and colon (V). All scale bars, 50 μm. Values are expressed as mean ± SEM. n = 6–10. ∗p < 0.05, ∗∗p < 0.01.
Fig. 8
Fig. 8
Enhanced hypertension therapy with surface-engineered Bacteroides thetaiotaomicron by regulating immune microenvironment in mice. (A) Gene set enrichment analysis (GSEA) of RNA-seq data of colon. NES, nominal enrichment score; FDR, false discovery rate. (B) Representative flow cytometry analysis of CD86+ and CD206+ RAW264.7 cells. (C) Representative flow cytometry analysis of CD4+IFN-γ+, CD4+IL-17a+ and CD4+Foxp3+ cells. RAW264.7 cells and CD4+ T cells were co-cultured with the fecal extracting solution of mice orally gavaged with PBS (FC) or Bacteroides thetaiotaomicron (FBt). N = 4. (D, E) Representative flow cytometry analysis (D) and quantification (E) of Treg cells in the colon, small intestine, kidney, and aorta of HTN mice treated by Bt-FM and Bt. (F, G) Representative flow cytometry analysis (F) and quantification (G) of Th17 cells in the colon, small intestine, kidney, and aorta of HTN mice treated by Bt-FM and Bt. All scale bars, 50 μm. Values are expressed as mean ± SEM. n = 6–10. ∗p < 0.05, ∗∗p < 0.01.

References

    1. Oparil S., Acelajado M.C., Bakris G.L., Berlowitz D.R., Cífková R., Dominiczak A.F., Grassi G., Jordan J., Poulter N.R., Rodgers A., Whelton P.K. Hypertension. Nat. Rev. Dis. Primers. 2018;4 - PMC - PubMed
    1. Stevens S.L., Wood S., Koshiaris C., Law K., Glasziou P., Stevens R.J., McManus R.J. Blood pressure variability and cardiovascular disease: systematic review and meta-analysis. Br. Med. J. 2016;354 - PMC - PubMed
    1. Xie X., Atkins E., Lv J., Bennett A., Neal B., Ninomiya T., Woodward M., MacMahon S., Turnbull F., Hillis G.S., Chalmers J., Mant J., Salam A., Rahimi K., Perkovic V., Rodgers A. Effects of intensive blood pressure lowering on cardiovascular and renal outcomes: updated systematic review and meta-analysis. Lancet. 2016;387(10017):435–443. - PubMed
    1. Endres M., Heuschmann P.U., Laufs U., Hakim A.M. Primary prevention of stroke: blood pressure, lipids, and heart failure. Eur. Heart J. 2011;32(5):545–552. - PubMed
    1. Miller J.B., Hrabec D., Krishnamoorthy V., Kinni H., Brook R.D. Evaluation and management of hypertensive emergency. Br. Med. J. 2024;386 - PubMed

LinkOut - more resources