. 2025 Nov 28;11(1):222.
doi: 10.1038/s41522-025-00853-0.

MicroMap: a network visualisation resource for human microbiome metabolism

Affiliations

MicroMap: a network visualisation resource for human microbiome metabolism

Cyrille C Thinnes et al. NPJ Biofilms Microbiomes. .

Abstract

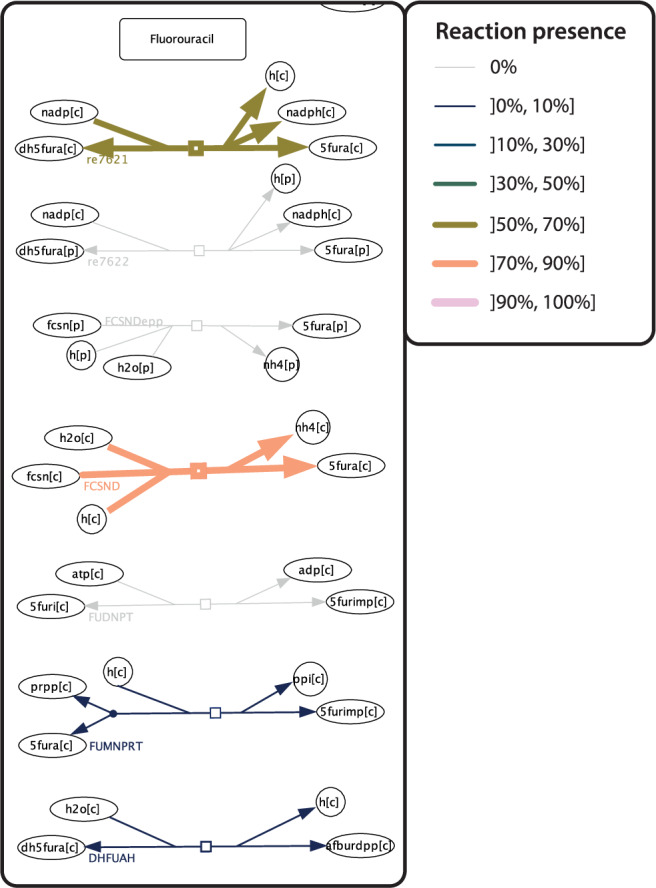
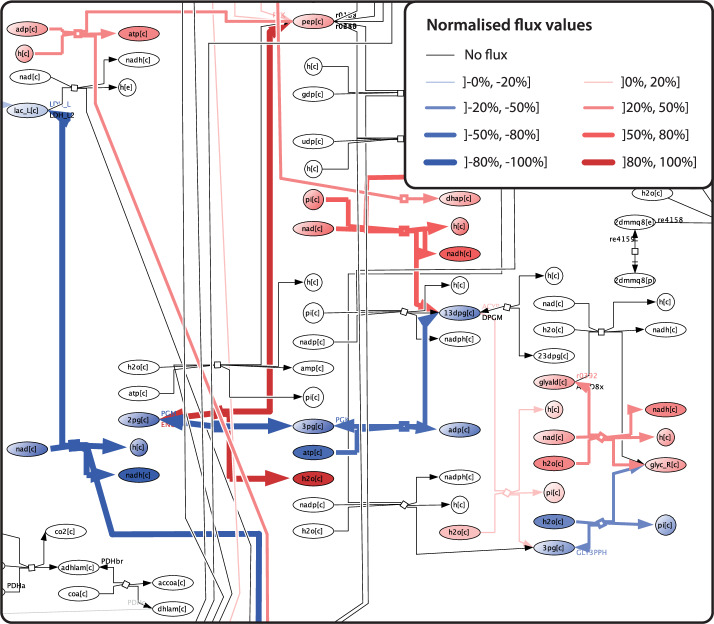
The human microbiome critically influences metabolism and thereby our health. Constraint-based reconstruction and analysis (COBRA) is a proven framework for generating mechanism-derived hypotheses along the nutrition-host-microbiome-disease axis. However, no large-scale microbiome metabolism visualisation has been available. Therefore, we created the MicroMap, a manually curated network visualisation, which captures the metabolism of over a quarter million microbial genome-scale metabolic reconstructions. The MicroMap contains 5064 unique reactions and 3499 unique metabolites, including for 98 drugs. Users can intuitively explore microbiome metabolism, inspect metabolic capabilities, and visualise computational modelling results. Further, the MicroMap may serve as an educational tool to help diversify the computational modelling community. We generated 257,429 visualisations, covering all our current microbiome reconstructions, to visually compare metabolic capabilities between microbes. The MicroMap integrates with the Virtual Metabolic Human (VMH, www.vmh.life ), the COBRA Toolbox (https://opencobra.github.io ), and is freely accessible at the MicroMap dataverse ( https://dataverse.harvard.edu/dataverse/micromap ), along with all the generated reconstruction visualisations.


Conflict of interest statement

Competing interests: The authors declare no competing interests.

Figures

Fig. 1
Fig. 1. MicroMap overview.
a A view of the MicroMap. Nodes represent metabolites and edges represent reactions. Highlighted in green are location labels, which indicate the names of metabolic subsystems or drugs to support intuitive map exploration. b A magnified view of the MicroMap location within the red dashed frame of (a). Metabolites contain their VMH identifier, with the associated compartment (e.g., c for cytosol) in brackets. We adopted a consistent colour scheme, e.g., by highlighting energy carriers in yellow, to support intuitive map exploration.
Fig. 2
Fig. 2. Comparison of microbial metabolic potential.
a A view of the pan-Bacilli class reconstruction visualisation (red) on the MicroMap with focus on a drug metabolism section (same as in b). b A view of the pan-Verrucomicrobia class reconstruction visualisation (red) on the MicroMap with focus on a drug metabolism section (same as in a).
Fig. 3
Fig. 3. Heatmap of relative reaction presence on the MicroMap.
A view of the relative reaction presence heatmap for 14 Pseudomonas species contained within AGORA2, with a focus on Fluorouracil drug metabolism. Both hue and line width are associated with relative reaction presence, ranging from fine-line navy blue to thick-line cotton candy. Light grey lines signify no reaction presence across the input reconstructions.
Fig. 4
Fig. 4. Visualisation of COBRA modelling results on the MicroMap.
A view of an example flux vector visualisation on the MicroMap. Blue indicates negative flux values, red indicates positive flux values. Line width and hue reflect the magnitude of the reaction-associated flux. Grey lines signify that no flux is associated with the reaction.

Update of

References

    1. Fan, Y. & Pedersen, O. Gut microbiota in human metabolic health and disease. Nat. Rev. Microbiol.19, 55–71 (2021). - PubMed
    1. Rosario, D. et al. Systems biology approaches to understand the host–microbiome interactions in neurodegenerative diseases. Front. Neurosci.14, 716 (2020). - PMC - PubMed
    1. Heirendt, L. et al. Creation and analysis of biochemical constraint-based models using the COBRA Toolbox v.3.0. Nat. Protoc.14, 639–702 (2019). - PMC - PubMed
    1. Mardinoglu, A. & Palsson, BO. Genome-scale models in human metabologenomics. Nat. Rev. Genet.26, 123–140 (2024). - PubMed
    1. Thiele, I. et al. A community-driven global reconstruction of human metabolism. Nat. Biotechnol.31, 419–425 (2013). - PMC - PubMed

LinkOut - more resources