

Unveiling long-term prenatal nutrition biomarkers in beef cattle via multi-tissue and multi-OMICs analysis
- PMID: 41326768
- PMCID: PMC12669329
- DOI: 10.1007/s11306-025-02384-3
Unveiling long-term prenatal nutrition biomarkers in beef cattle via multi-tissue and multi-OMICs analysis
Abstract
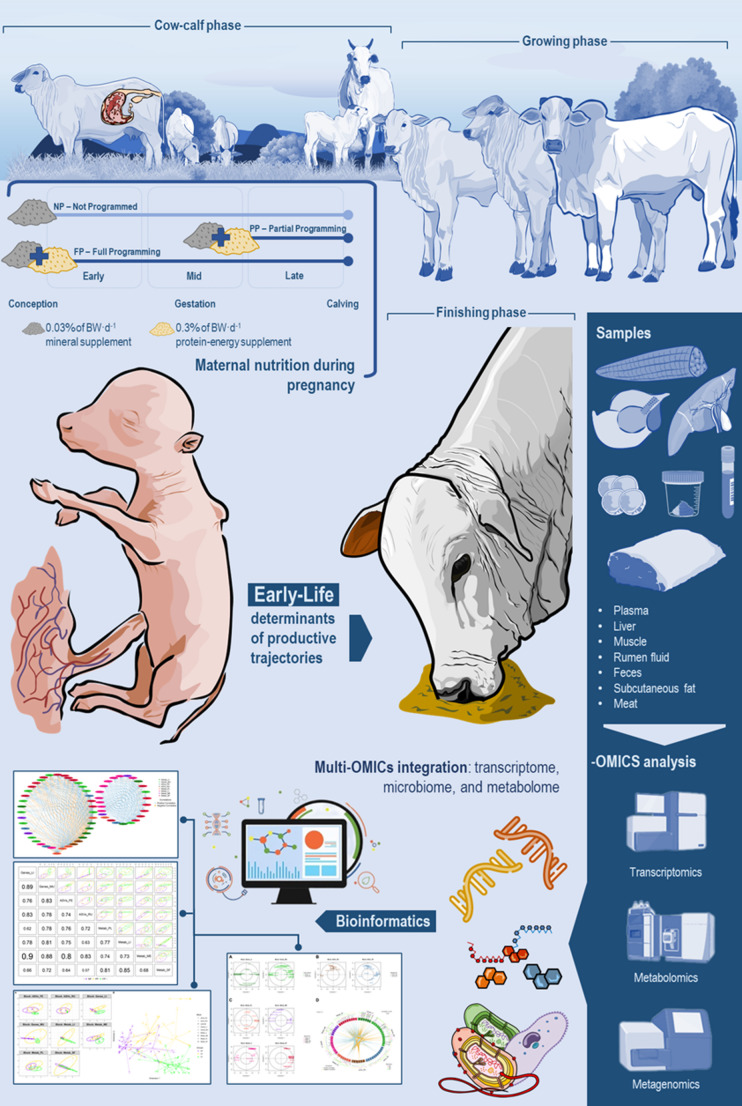
Introduction: Maternal nutrition during gestation plays a crucial role in shaping offspring development, metabolism, and long-term health, yet the underlying molecular mechanisms remain poorly understood.
Objectives: This study investigated potential biomarkers through multi-OMICs and multi-tissue analyses in offspring of beef cows subjected to different gestational nutrition regimes.
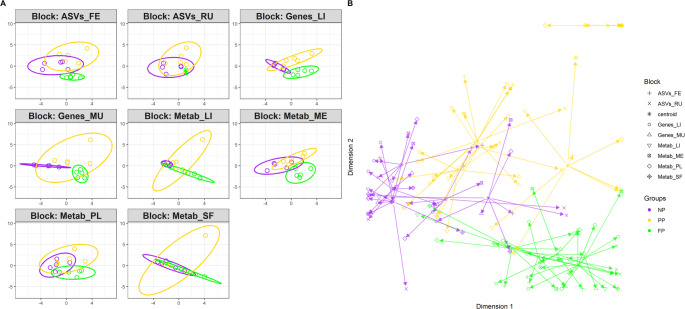
Methods: A total of 126 cows were allocated to three groups: NP (control, mineral supplementation only), PP (protein-energy supplementation in the last trimester), and FP (protein-energy supplementation throughout gestation). Post-finishing phase, samples (blood, feces, ruminal fluid, fat, liver, and longissimus muscle/meat) were collected from 63 male offspring. RNA sequencing was performed on muscle and liver, metabolomics on plasma, fat, liver, and meat, and 16S rRNA sequencing on feces and ruminal fluid. Data were analyzed via DIABLO (mixOmics, R).
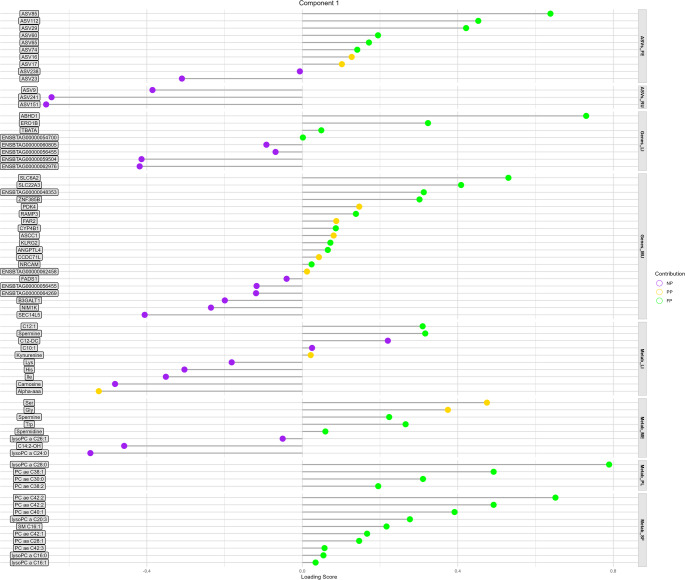
Results: The muscle transcriptome showed strong cross-block correlations (|r| > 0.7), highlighting its sensitivity to maternal nutrition. Plasma glycerophospholipids (PC ae C30:0, PC ae C38:1, lysoPC a C28:0) were key biomarkers, particularly for FP. The PP group exhibited liver-associated markers (IL4I1 gene, butyrylcarnitine), reflecting late-gestation effects, while NP had reduced ruminal Clostridia (ASV151, ASV241), suggesting impaired microbial energy metabolism.
Conclusions: This integrative multi-OMICs approach provided deeper insights than single-layer analyses, distinguishing nutritional groups and revealing tissue- and OMIC-specific patterns. These findings demonstrate the value of combining transcriptomic, metabolomic, and microbiome data to identify biomarkers linked to maternal nutrition in beef cattle.
Keywords: Beef prenatal nutrition; Metabolomics; Metagenomics; Systems biology; Transcriptomics.
© 2025. The Author(s).
Conflict of interest statement
Declarations. Competing interests: The authors declare no competing interests. Ethical approval and consent to participate: This study was approved by the Research Ethics Committee of the Faculty of Animal Science and Food Engineering, University of São Paulo, under protocol No. 1843241117, in compliance with the National Council for the Control of Animal Experimentation recommendations. In addition, the Faculty of Animal Science and Food Engineering provided the animals to carry out this study. Consent for publication: Not applicable.
Figures


References
-
- Auffret, M. D., Stewart, R. D., Dewhurst, R. J., Duthie, C. A., Watson, M., & Roehe, R. (2020). Identification of microbial genetic capacities and potential mechanisms within the rumen microbiome explaining differences in beef cattle feed efficiency. Frontiers in Microbiology,11, Article 527770. 10.3389/FMICB.2020.01229/BIBTEX - PMC - PubMed
-
- Baldwin, R. L., & Connor, E. E. (2017). Rumen Function and Development. Veterinary Clinics of North America-Food Animal Practice,33(3), 427–439. 10.1016/J.CVFA.2017.06.001/ASSET/A39ABA80-CDF0-4D68-A4A5-F756FAE62CB1/MAIN.ASSETS/GR2.JPG - PubMed
-
- Bauman, D. E., & Currie, B., W (1980). Partitioning of nutrients during pregnancy and lactation: A review of mechanisms involving homeostasis and homeorhesis. Journal of Dairy Science, 63(9), 1514–1529. 10.3168/JDS.S0022-0302(80)83111-0 - PubMed
-
- Bene, J., Márton, M., Mohás, M., Bagosi, Z., Bujtor, Z., Oroszlán, T., et al. (2013). Similarities in serum acylcarnitine patterns in type 1 and type 2 diabetes mellitus and in metabolic syndrome. Annals of Nutrition and Metabolism, 62(1), 80–85. 10.1159/000345759 - PubMed
MeSH terms
Substances
Grants and funding
LinkOut - more resources
Full Text Sources
Medical
Miscellaneous