. 2025 Dec 3;12(1):138.
doi: 10.1186/s40643-025-00979-1.

Development of robust machine learning models to estimate hydrochar higher heating value and yield based upon biomass proximate analysis

Affiliations

Development of robust machine learning models to estimate hydrochar higher heating value and yield based upon biomass proximate analysis

Guoliang Hou et al. Bioresour Bioprocess. .

Abstract

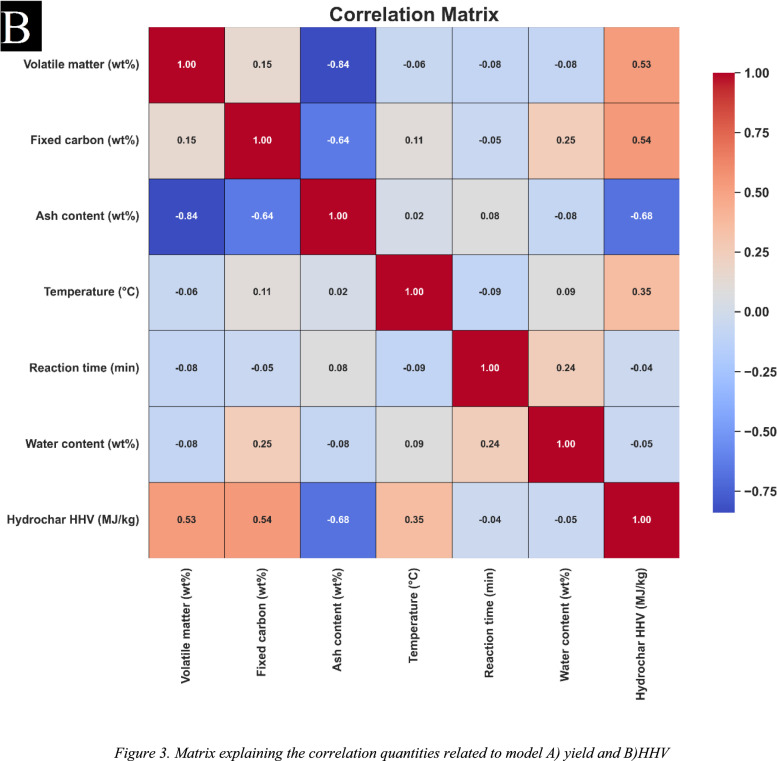
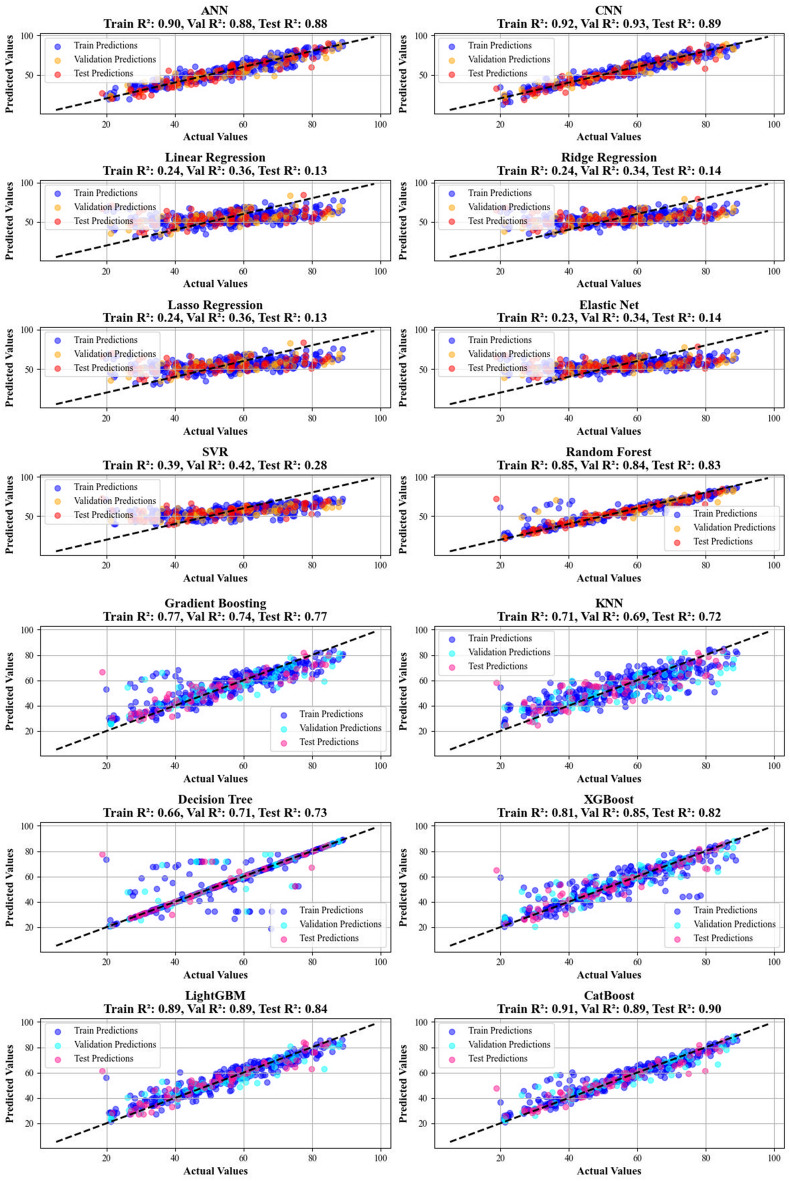
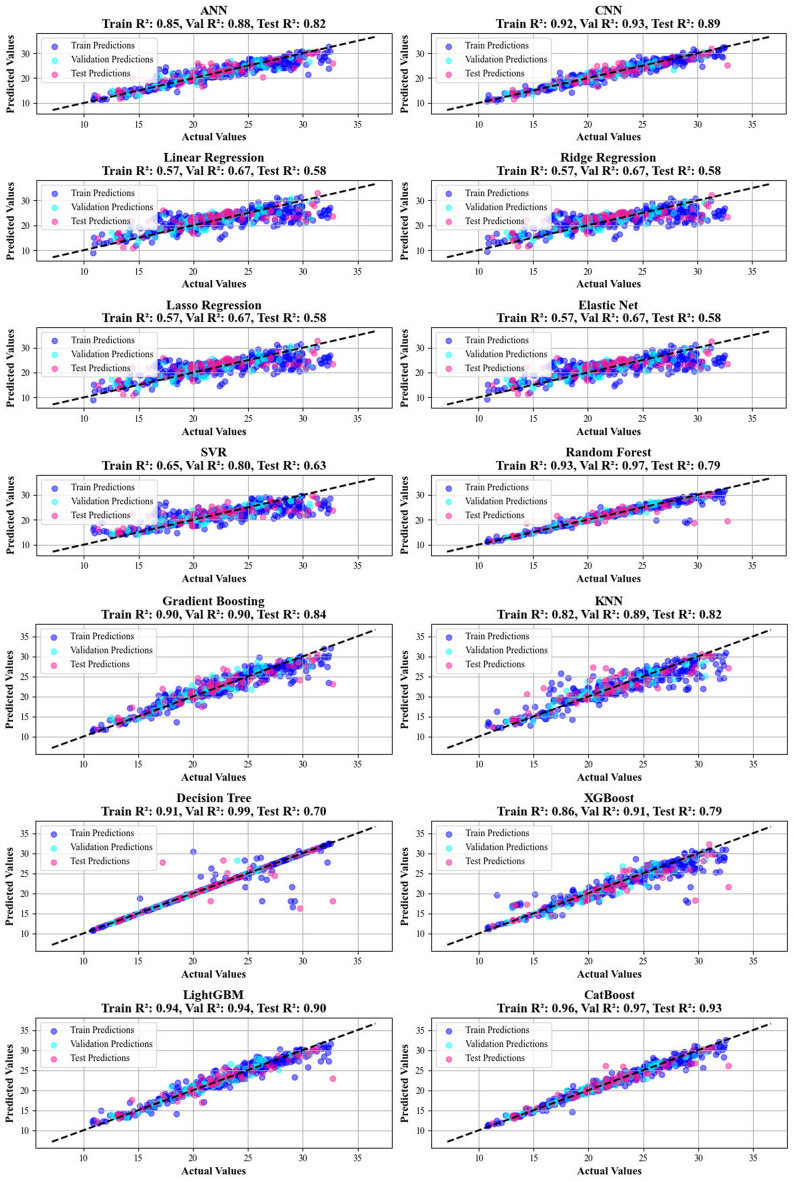
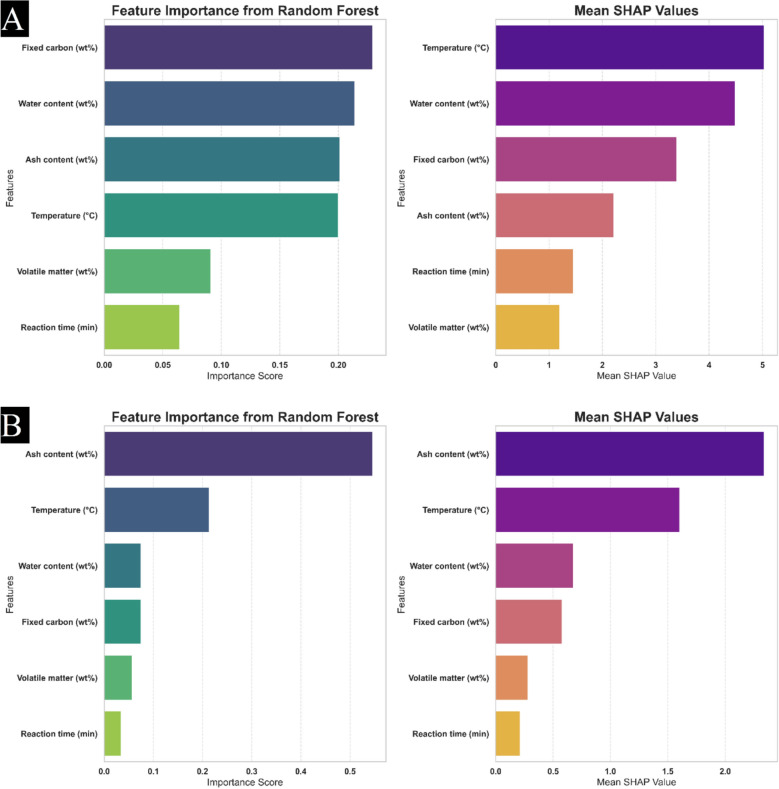
This study introduces a robust machine learning framework for predicting hydrochar yield and higher heating value (HHV) using biomass proximate analysis. A curated dataset of 481 samples was assembled, featuring input variables such as fixed carbon, volatile matter, ash content, reaction time, temperature, and water content. Hydrochar yield and HHV served as the target outputs. To enhance data quality, Monte Carlo Outlier Detection (MCOD) was employed to eliminate anomalous entries. Thirteen machine learning algorithms, including convolutional neural networks (CNN), linear regression, decision trees, and advanced ensemble methods (CatBoost, LightGBM, XGBoost) were systematically compared. CatBoost demonstrated superior performance, achieving an R2 of 0.98 and mean squared error (MSE) of 0.05 for HHV prediction, and an R2 of 0.94 with MSE of 0.03 for yield estimation. SHAP analysis identified ash content as the most influential feature for HHV prediction, while temperature, water content, and fixed carbon were key drivers of yield. These results validate the effectiveness of gradient boosting models, particularly CatBoost, in accurately modeling hydrothermal carbonization outcomes and supporting data-driven biomass valorization strategies.

Keywords: Biomass proximate analysis; CatBoost algorithm; Higher heating value (HHV); Hydrochar yield prediction; Machine learning.


Conflict of interest statement

Declarations. Ethics approval and consent to participate: Not applicable. Consent for publication: All authors agree to publish this work. Competing interests: None.

Figures

Fig. 1
Fig. 1
Overall workflow taken in this study to construct the data-driven models and choose the top-performing one subsequently
Fig. 2
Fig. 2
Matrix-plot for A yield B HHV
Fig. 2
Fig. 2
Matrix-plot for A yield B HHV
Fig. 3
Fig. 3
Matrix explaining the correlation quantities related to model A yield and B HHV
Fig. 3
Fig. 3
Matrix explaining the correlation quantities related to model A yield and B HHV
Fig. 4
Fig. 4
Outlier detection via the Monte Carlo and boxplots for the A yield and B HHV data validated the data’s spreading and confirmed its appropriateness for building dependable models
Fig. 5
Fig. 5
The accuracy of models for HHV prediction determined by comparing their predicted outcomes against observed values
Fig. 5
Fig. 5
The accuracy of models for HHV prediction determined by comparing their predicted outcomes against observed values
Fig. 5
Fig. 5
The accuracy of models for HHV prediction determined by comparing their predicted outcomes against observed values
Fig. 5
Fig. 5
The accuracy of models for HHV prediction determined by comparing their predicted outcomes against observed values
Fig. 5
Fig. 5
The accuracy of models for HHV prediction determined by comparing their predicted outcomes against observed values
Fig. 6
Fig. 6
The accuracy of models for HHV prediction determined by comparing their predicted outcomes against observed values
Fig. 6
Fig. 6
The accuracy of models for HHV prediction determined by comparing their predicted outcomes against observed values
Fig. 6
Fig. 6
The accuracy of models for HHV prediction determined by comparing their predicted outcomes against observed values
Fig. 6
Fig. 6
The accuracy of models for HHV prediction determined by comparing their predicted outcomes against observed values
Fig. 6
Fig. 6
The accuracy of models for HHV prediction determined by comparing their predicted outcomes against observed values
Fig. 7
Fig. 7
A visual assessment of the model’s predictive capability for yield, performed using cross-plots
Fig. 8
Fig. 8
A visual assessment of the model’s predictive capability for HHV performed using cross-plots
Fig. 9
Fig. 9
A comprehensive analysis of relative deviation percentages provided for all models employed in biomass yield prediction
Fig. 10
Fig. 10
Relative deviation percentages meticulously detailed for the cohorts across the entire models employed for biomass yield prediction
Fig. 11
Fig. 11
Information on the frequency of the data sets employed for biomass yield
Fig. 12
Fig. 12
Information on the frequency of the data sets employed for biomass HHV prediction
Fig. 13
Fig. 13
Random Forest and Mean SHAP Insights into feature contributions for prediction A yield and B HHV parameters

References

    1. Abbasi P, Aghdam SK-y, Madani M (2023) Modeling subcritical multi-phase flow through surface chokes with new production parameters. Flow Meas Instrum 89:102293
    1. Aghdam SK-y et al (2022) Thermodynamic modeling of saponin adsorption behavior on sandstone rocks: an experimental study. Arab J Sci Eng. 10.1007/s13369-022-07552-4
    1. Aghdam SK-y et al (2023) Thermodynamic modeling of saponin adsorption behavior on sandstone rocks: an experimental study. Arab J Sci Eng 48(7):9461–9476
    1. Ahmadi MA et al (2013) Evolving artificial neural network and imperialist competitive algorithm for prediction oil flow rate of the reservoir. Appl Soft Comput 13(2):1085–1098
    1. Ajin RS, Segoni S, Fanti R (2024) Optimization of SVR and CatBoost models using metaheuristic algorithms to assess landslide susceptibility. Sci Rep 14(1):24851 - PMC - PubMed

LinkOut - more resources