. 2025 Dec 8;16(1):10938.
doi: 10.1038/s41467-025-65962-y.

Discovery of a β-arrestin-biased CCKBR agonist that blocks CCKBR-dependent long-term potentiation

Affiliations

Discovery of a β-arrestin-biased CCKBR agonist that blocks CCKBR-dependent long-term potentiation

Heng Shi et al. Nat Commun. .

Abstract

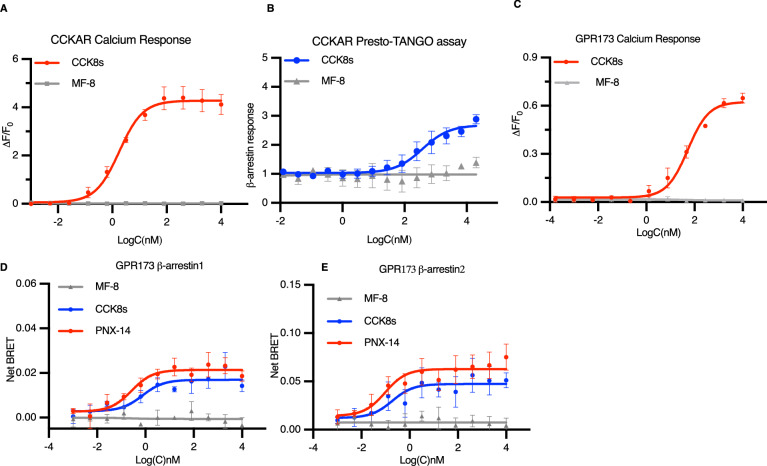
The CCKBR agonists induce neocortical long-term potentiation of excitatory synaptic transmission and enhance memory formation, while its antagonists weaken the potentiation in the amygdala and alleviate depression-like behaviors. However, the mechanism that drives CCKBR dependent long-term potentiation remains elusive. There is also no signaling pathway-biased CCKBR agonist to modulate the potentiation. Here, we discover a β-arrestin biased CCKBR agonist MF-8 with IC50 = 0.9 nM. The activation of CCKBR with MF-8 fails to induce the potentiation but efficiently induces CCKBR endocytosis. Multi-Electrode Array results demonstrate that the potentiation is dependent on Gαq/11-Ca2+ and Gαs-cAMP signaling pathways. The potentiation is entirely blocked by MF-8 through β-arrestin signaling. Furthermore, MF-8 effectively inhibits the formation of cue-to-cue associative fear memory. These results reveal the signal pathway preference of the CCKBR long-term potentiation and identify a blocker of the potentiation, which provides us with broader insights into developing drugs targeting CCKBR.


Conflict of interest statement

Competing interests: The authors declare no competing interests.

Figures

Fig. 1
Fig. 1. MF-8 binds to CCKBR with high affinity.
A β value was calculated based on the data from PRESTO-Tango and calcium mobilization assays. See also Table 1. CCK8s was used as the balanced agonist, n = 4. B Normalized dose-response curves of CCK8s (blue, n = 4) and MF-8 (red, n = 5) to CCKBR in calcium mobilization assay. C Normalized dose-response curves of CCK8s (blue, n = 5) and MF-8 (red, n = 4) in the PRESTO-Tango assay. D The schematic of the FRET-based binding system. E The dose-dependent response curve of MF-8 (red, n = 4) and CCK8s (blue, n = 5) at 293T cells expressing transfected HaloTag-CCKBR in the FRET assay. For (AC) and (E), data were presented as means ± s.e.m.
Fig. 2
Fig. 2. The CCKBR-LTP in the AC is not dependent on β-arrestin signaling.
A The flow chart of the whole fEPSP recording with the representative diagram for the positions of multi-electrode arrays in the mouse AC (close to the microscope) and the drug-LFS-induced-LTP paradigm above the flow chart (Created in BioRender. Zhang, M. (2025) https:// BioRender.com/s14o899). B Normalized amplitudes of fEPSPs and (C) average change in fEPSP amplitude (%) before and after LFS with 200 nM CCK8s treatment for 10 min (light blue, N = 3 mice, 8 slices, P < 0.0001), 20 nM MF-8 (light purple, N = 2 mice, 6 slices, P = 0.7621), 200 nM MF-8 (pinkish purple, N = 2 mice, 5 slices, P = 0.5561) in C57 mice. D Normalized amplitudes of fEPSPs and (E) average change in fEPSP amplitude (%) before and after LFS with the 10-min treatment of 200 nM CCK8s in AC of C57. For (D, E), measurements were taken following a 1-h preincubation period of 100 μM barbadin (purple, N = 3 mice, 8 slices, P < 0.0001) or aCSF preincubation (bice, N = 3 mice, 5 slices, P < 0.0001). F The virus expression of AAV2/9-mCaMKIIa-MasterRNAi30e(NC)-eGFP-WPER(upper panels), AAV2/9-mCaMKIIa -MasterRNAi30e (mArrb2)-eGFP-WPER(central panels) and AAV2/9-mCaMKIIa-MasterRNAi30e (mArrb1)-eGFP-WPER (lower panels) in AC. Blue: DAPI, green: virus, red: β-arrestin; Scale bar: 50 μm. G Normalized amplitudes of fEPSPs and (H) average change in fEPSP amplitude (%) before and after LFS with the 10-min treatment of 200 nM CCK8, whose AC expressed AAV2/9-mCaMKIIa-MasterRNAi30e(NC)-eGFP-WPER (shRNA(NC), tangerine, N = 3 mice, 6 slices, P < 0.0001), AAV2/9-mCaMKIIa-MasterRNAi30e(mArrb2)-eGFP-WPER (shRNA (β-arrestin1), green, N = 3 mice, 8 slices, P < 0.0001) and AAV2/9-mCaMKIIa -MasterRNAi30e(mArrb1)-eGFP-WPER (shRNA(β-arrestin2), ocean, N = 3 mice, 7 slices, P < 0.0001). For (C, E, H), data were means ± s.e.m. values. Two-way ANOVA were used with ***P < 0.001, ****P < 0.0001; ns, not significant; Šídák's correction.
Fig. 3
Fig. 3. The CCKBR-mediated LTP in the AC is Gαq/11 and Gαs dependent.
A–G Normalized amplitudes of fEPSPs before and after TBS with one-hour preincubation with aCSF (Steel, N = 5 mice, 7 slices), 100 nM YF476 (Red, N = 3 mice, 7 slices), 10 μM U-73122 (Moss, N = 5 mice, 8 slices), 50 μM 2-APB (Mocha, N = 6 mice, 12 slices), 20 μM YM254890 (Dark purple, N = 3 mice, 6 slices), 100 μM Barbadin (Blue, N = 3 mice, 6 slices), 10 μM H-89 (Ocean, N = 5 mice, 10 slices) in C57 mice with representative trace of single fEPSP before (translucent color) and after (solid color) TBS. H Normalized amplitudes of fEPSPs before and after TBS, with 300 ng PTX injected into the AC of C57 24–48 h before recording (grape, N = 3 mice, 6 slices) with the representative of a single fEPSP before (translucent color) and after (solid color) TBS on above. I The average change in fEPSP amplitude (%) before (circle, translucent color) and after (square, solid color) TBS of groups. Vehicle: Steel, N = 5 mice, 7 slices, P < 0.0001; YF476: Red, N = 3 mice, 7 slices, P = 0.4533; U-73122: Moss, N = 5 mice, 8 slices, P = 0.4578; 2-APB: Mocha, N = 6 mice, 12 slices, P > 0.9999; YM254890: Dark purple, N = 3 mice, 6 slices, P = 0.901; Barbadin: Blue, N = 3 mice, 6 slices, P < 0.0001; H-89: Ocean, N = 5 mice, 10 slices, P = 0.105; PTX: grape, N = 3 mice, 6 slices, P < 0.0001. Data were presented as means ± s.e.m. values. Two-way ANOVA: ****P < 0.0001; ns, not significant; Šídák's corrected.
Fig. 4
Fig. 4. MF-8 is a β-arrestin-biased agonist of CCKBR.
A–L TRUPATH profiling in 293T-CCKBR cells. A–F Concentration-response curves for CCK8s (blue) and MF-8 (red) at 293T-CCKBR cells across 6 Gαi proteins. G, H Concentration-response curves for CCK8s (blue) and MF-8 (red) at 293T-CCKBR cells across two Gα12/13 proteins. I, J Concentration-response curves for CCK8s (blue) and MF-8 (red) at 293T-CCKBR cells across two Gαs proteins. K, L Concentration-response curves for CCK8s (blue) and MF-8 (red) at 293T-CCKBR cells across two Gαq proteins. M, N Concentration-response curves for CCK8s (blue) and MF-8 (red) at 293 T cells transfected with CCKBR across β-arrestins determined by BRET-based assays. O Relative activities for MF-8 and CCK8s against CCKBR. G-protein and β-arrestin signaling profiles for MF-8 and CCK8s using the results of Fig. 4A–N. Relative activities were represented as Δlog (Emax/EC50). All data were presented as means ± s.e.m. The number of independent repeated trials n is shown on the graph.
Fig. 5
Fig. 5. High specificity of MF-8 to CCKBR.
A The concentration-response curve of CCK8s (red, n = 4) and MF-8 (gray, n = 3) at 293T-CCKAR cells in calcium mobilization assays. B The concentration-response curve of CCK8s (blue, n = 4) and MF-8 (gray, n = 3) at HTLA cells expressing modified CCKAR in PRESTO-Tango assays. C The concentration-response curve of CCK8s (red, n = 3) and MF-8 (gray, n = 3) at CHO-GPR173 cells in the calcium mobilization assay. D, E The concentration-response curve of CCK8s (blue, n = 4), MF-8 (gray, n = 5) and PNX-14 (red, n = 6) at 293T-GPR173 cells in the BRET-based β-arrestin assay ((D) for β-arrestin1; (E) for β-arrestin2). All data were presented as means ± s.e.m.
Fig. 6
Fig. 6. MF-8 is able to induce CCKBR internalization at a low concentration.
A, D The test system schematic of (A) β-arrestin1(1-382aa) and (D) β-arrestin2-mediated CCKBR internalization assays. B, E The representative results correspond to (A) and (D). Left column: cells with Rho-2CF3 but without CCKBR agonist. Middle column: cells treated with Rho-2CF3 and 100 nM CCK8s. Right column: cells treated with Rho-2CF3 and 100 nM MF-8. Scale bar: 5 μm. C Quantification of endocytosis levels through colocalization analysis of EYFP-β-arrestin1(1-382aa) and HaloTag-tagged CCKBR. Control: blue, n = 30 cells; MF-8: red, n = 30 cells; CCK8: green, n = 34 cells. F Quantification of endocytosis levels through colocalization analysis of β-arrestin2-GFP and HaloTag-tagged CCKBR. Control: blue, n = 30 cells; MF-8: red, n = 29 cells; CCK8: green, n = 33 cells. For (C, F), all data were presented as means ± s.e.m., derived from three independent experiments; ordinary one-way ANOVA with Bonferroni’s multiple comparison was used. ****P < 0.0001; ns, not significant.
Fig. 7
Fig. 7. CCKBR-mediated calcium, cAMP accumulation, and LTP could be blocked by MF-8 with high potency.
A Dose-dependent response of MF-8 (blue, n = 3) and YF476 (red, n = 3) blocking 15 nM CCK8s-induced calcium mobilization in 293T-CCKBR cells. B Dose-dependent response of MF-8 (blue, n = 10) and YF476 (red, n = 10) blocking 200 nM CCK8s-induced cAMP accumulation in 293T-CCKBR cells. C The TBS protocol and the schematic flow chart for MEA recording (Created in BioRender. Zhang, M. (2025) https://BioRender.com/fmc3p2t). TBS paradigm: 100 Hz (x5), 5 Hz (x4), 0.1 Hz (x10). D CCKBR-LTP in the AC was blocked by MF-8. Left: fEPSPs amplitude traces before and after TBS with Vehicle (gray, 8 brain slices from 4 mice) and MF-8 (blue, 10 brain slices from 4 mice). Right: The average change in fEPSPs amplitude (%) before (translucent color) and after (solid color) TBS of groups. Vehicle: gray, 8 brain slices from 4 mice, P = 0.0005; MF-8: blue, 10 brain slices from 4 mice, P = 0.0581. Data were presented as means ± s.e.m. Two-way ANOVA: **P < 0.01; ns, not significant; Šídák's corrected.
Fig. 8
Fig. 8. MF-8 blocks the CCKBR-mediated LTP in a β-arrestin dependent manner.
A The representative 3D structure of the ligand-receptor complex highlighting hydrogen bond interactions. The ligand backbone is depicted in light green, and the receptor and key residues are depicted in orange. Atoms Br, O, N, and H are colored magenta, red, blue, and white, respectively. Hydrogen bonds are indicated by light blue dashed lines. Residue labels are annotated with Ballesteros-Weinstein numbering. B Effects of key residue mutations in the MF-8 recognition pocket of CCKBR in response to the stimulation with MF-8 in BRET-based β-arrestin assays. The heat map of ΔpEC50 is colored according to the ΔpEC50 where ΔpEC50 = pEC50 of mutant—pEC50 of wild type. The heat map of Emax (%) is colored according to the Emax of mutations relative to that of the wild type. C Normalized amplitudes of fEPSPs and (F) Average change in fEPSPs amplitude (%) before and after TBS in AC slices of CCKBR-KO mice expressing rAAV-hsyn-mCCKBR-P2A-EGFP (pink, 9 slices from 6 mice, P < 0.0001) and rAAV-hsyn-EGFP (gray, 15 slices from 4 mice, P = 0.3543). D Normalized amplitudes of fEPSPs and (H) Average change in fEPSPs amplitude (%) before and after TBS in AC slices of CCK-BR-KO mice expressing rAAV-hsyn-hCCKBR-P2A-EGFP. Preincubation of 200 nM MF-8 blocked the CCKBR-LTP in the AC (red, N = 3 mice, n = 8 slices, P = 0.802). TBS induced CCKBR-LTP in the AC of the Vehicle group (blue, N = 3 mice, n = 6 slices, P < 0.0001). E Normalized amplitudes of fEPSPs and (J) Average change in fEPSPs amplitude (%) before and after TBS in AC slices of CCK-BR-KO mice expressing rAAV-hsyn-hCCKBR (Asn353Ala) -P2A-EGFP. Preincubation of 200 nM MF-8 did not block the CCKBR-LTP (Moss, N = 4 mice, n = 6 slices, P = 0.0001). Preincubation of the vehicle did not influence CCKBR-LTP in the vehicle group (Mocha, N = 3 mice, n = 7 slices, P = 0.0003). L Normalized amplitudes of fEPSPs and (N) Average change in fEPSPs amplitude (%) before and after TBS following 2-h preincubation of barbadin (Blue, N = 3 mice, n = 5 slices, P = 0.0064), or barbadin + 200 nM MF-8 (Red, N = 3 mice, n = 6 slices, P = 0.0059) with AC slices of C57. M Normalized amplitudes of fEPSPs and (P) Average change in fEPSPs amplitude (%) before and after TBS following 2-h incubation of 200 nM MF-8 with AC slices of C57 expressing AAV2/9-mCaMKIIa-MasterRNAi30e(NC) -eGFP-WPER (Green, N = 3 mice, n = 8 slices, P > 0.9999), AAV2/9-mCaMKIIa -MasterRNAi30e(mArrb1)-eGFP-WPER (Red, N = 3 mice, n = 5 slices, P < 0.0001), and AAV2/9-mCaMKIIa -MasterRNAi30e(mArrb2)-eGFP-WPER (Dark blue, N = 3 mice, n = 9 slices, P < 0.0001). G, I, K, O, Q Representative of single fEPSP before (translucent color) and after (solid color) TBS. Data were means ± s.e.m. For (F, H, J, N, P) Two-way ANOVA Šídák's multiple comparisons tests were used: ****P < 0.0001; ***P < 0.001; ns, not significant.
Fig. 9
Fig. 9. MF-8 blocks CCKBR mediated fear memory.
A Diagram of MF-8 treatment on the day before tone-to-tone pair training, tone-to-tone pair training (day 1–3, f1 = 1k Hz, f2 = 4k Hz), baseline tests and conditioning of footshock with f2 (day 4), and freezing tests (day 5). B Bar charts show freezing percentages of the C57 mice with saline (gray, N = 12 mice) and MF-8 (red, N = 15 mice) injection. One-way ANOVA with Tukey’s multiple comparisons tests were used: ****p < 0.0001; **P < 0.01; NS, not significant. The exact P-values were shown in the source data.
Fig. 10
Fig. 10. Synthetic route of Fluo-Halo.
HaloTag(O2)amine, HBTU, DIEA, dry DMF, r.t., yield 48.1%.

References

    1. Yang, D. et al. G protein-coupled receptors: structure- and function-based drug discovery. Signal Transduct. Target. Ther.6, 7 (2021). - PMC - PubMed
    1. Zhang, M. et al. G protein-coupled receptors (GPCRs): advances in structures, mechanisms, and drug discovery. Signal Transduct. Target. Ther.9, 88 (2024). - PMC - PubMed
    1. Wang, W., Qiao, Y. & Li, Z. New insights into modes of GPCR activation. Trends Pharmacol. Sci.39, 367–386 (2018). - PubMed
    1. Calebiro, D., Koszegi, Z., Lanoiselée, Y., Miljus, T. & O’Brien, S. G protein-coupled receptor-G protein interactions: a single-molecule perspective. Physiol. Rev.101, 857–906 (2021). - PubMed
    1. Inoue, A. et al. Illuminating G-protein-coupling selectivity of GPCRs. Cell177, 1933–1947.e1925 (2019). - PMC - PubMed

LinkOut - more resources