. 2025 Dec 8;12(1):1931.
doi: 10.1038/s41597-025-06198-9.

Global Atmospheric River Lifecycle Detection Using Integrated Water Vapor and Vapor Transport

Affiliations

Global Atmospheric River Lifecycle Detection Using Integrated Water Vapor and Vapor Transport

Brandon Kerns et al. Sci Data. .

Abstract

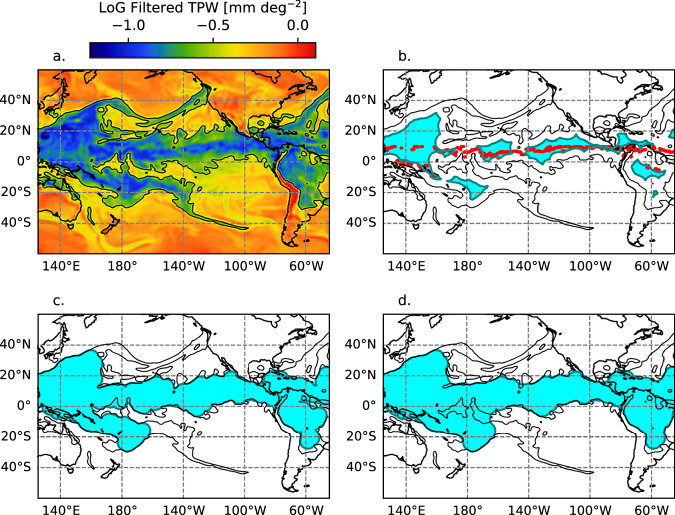
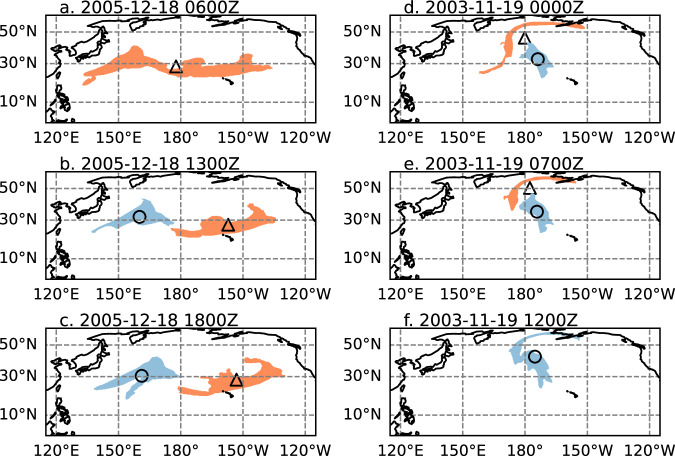
Atmospheric rivers (ARs) are narrow streams of enhanced water vapor transport. While there is no accepted quantitative definition of ARs, integrated water vapor transport (IVT) is most commonly used to detect them. Nevertheless, narrow features of enhanced total precipitable water (TPW) are common signatures of ARs. Current AR tracking methods are generally limited to using either IVT or TPW separately, and many do not track the ARs globally through their life cycles. In this study, a global Atmospheric River Lifecycle Detection (ARLiD) method and 44-year database that incorporates both IVT and TPW are presented. The inclusion of TPW provides consistency in identifying entire lifecycle of ARs and reduces uncertainties due to small changes in wind. ADLiD extends the AR systems both equatorward and poleward of the IVT. The data are useful for studies that wish to include portions of the AR life cycle during which the AR, or portions of the AR, have a stronger signature in TPW than in IVT.


Conflict of interest statement

Competing interests: The authors declare no competing interests.

Figures

Fig. 1
Fig. 1
Illustration of the input variables and ARLiD classifications for 1200 UTC 20 Oct. 2003. Total precipitable water for the greater Pacific region (a) and the zoomed in northeast Pacific region (b). Integrated water vapor transport for the greater Pacific region (c) and the zoomed in northeast Pacific region (d). Identified atmospheric river systems (red) and deep tropics region (cyan) for the greater Pacific region (e) and the zoomed in northeast Pacific region (f). Panels (b), (d), and (f) are zoomed in to the boxes drawn in (a), (c), and (e), respectively.
Fig. 2
Fig. 2
Illustration of the steps used to determine the deep tropics mask for 1200 UTC 20 Oct. 2003. (a) TPW with the Laplace of Gaussian filter applied (color shaded). For (b), (c), and (d), the cyan shading indicates the deep tropics mask identified at that step, as follows: (b) the first binary erosion step. The location of maximum TPW within 10°S–10°N for each longitude is indicated with the red dots; (c) after applying the binary dilation to the mask and the maximum TPW points in (b); and (d) the final mask is determined by applying an additional dilation then an erosion to the mask area in (c). In each panel, the unfiltered Laplace of Gaussian filtered TPW contour of −0.5 mm deg−1 is drawn in black.
Fig. 3
Fig. 3
Construction of AR objects from the IVT and TPW blobs. (a) LoG filtered IVT with the blob threshold (−7 kg m−1 s−1 deg−2) outlined in black. (b) TPW difference from the local area background with the TPW blob threshold (10 mm) outlined in black. (c) IVT blobs (grey shading) overlaid with the AR objects (red shading). (d) TPW blobs (grey shading) overlaid with the AR objects (red shading). The portion of the AR system that is from the IVT (c) and TPW (d) blobs appears as darker red shading. In (b) and (d), topography >1000 m (excluded from TPW blobs) is indicated with the hatching. In all panels, the deep tropics mask is indicated with a black dashed curve.
Fig. 4
Fig. 4
Example of splitting (ac) and merging (df) AR systems. The orange and blue shading indicate the areal extent of the AR systems at the times indicated in the panel labels. The centroid locations of the AR systems are indicated by the circle and triangle marker.
Fig. 5
Fig. 5
Time evolution of six individual AR systems as part of an AR family (#402 for the 2005–2010 tracking period) occurring in the North Pacific Ocean during 10 December 2005–12 January 2006. Each contour represents the boundary of the tracked AR system at a single time. Contours are drawn for every 6 h. The contour colors represent the time according to the colorbar. In the background, the contours for all AR systems in the family are drawn in grey. Initiation centroid points are indicated with star markers. Dissipation centroid points are indicated with X markers.
Fig. 6
Fig. 6
Initiation and dissipation density of ARs for June 1980 – June 2024. (a) Initiation of AR families; (b) Dissipation of AR families; (c) Initiation of individual ARs, and (d) dissipation of individual ARs. The units are count of AR centroids per year per 100,000 km. Bins are 5 × 5 deg.
Fig. 7
Fig. 7
Histogram of AR duration for June 1980 – May 2024. (a) Duration of individual AR systems. (b) Duration of AR families. Bins are every 24 h, inclusive on the left and exclusive on the right. The counts of total systems is given in the upper right. The count of systems with duration 48–71 h is at the upper right. The count of systems with duration >=21 days is at the lower right, and the rightmost bar includes all systems with duration >=21 days.
Fig. 8
Fig. 8
Comparison of AR frequency of occurrence for (a) ARLiD (this study), (b) SCAFET, (c) TempestLR, and (d) AR-CONNECT. See Table 1 for more details regarding the products.

References

    1. Zhu, Y. & Newell, R. E. Atmospheric rivers and bombs. Geophys Res Lett21, 1999–2002 (1994).
    1. Zhu, Y. & Newell, R. E. A proposed algorithm for moisture fluxes from atmospheric rivers. Mon Weather Rev126, 725–735 (1998).
    1. Ralph, F. M. & Dettinger, M. D. Storms, floods, and the science of atmospheric rivers. Eos (Washington DC)92, 265–266 (2011).
    1. Gimeno, L., Nieto, R., Vázquez, M. & Lavers, D. A. Atmospheric rivers: A mini-review. Frontiers in Earth Science2 (2014).
    1. Neiman, P. J., Ralph, F. M., Wick, G. A., Lundquist, J. D. & Dettinger, M. D. Meteorological characteristics and overland precipitation impacts of atmospheric rivers affecting the West coast of North America based on eight years of SSM/I satellite observations. J Hydrometeorol9, 22–47 (2008).

LinkOut - more resources