. 1979 Feb 6;18(3):508-19.
doi: 10.1021/bi00570a021.

Differential polarized phase fluorometric investigations of diphenylhexatriene in lipid bilayers. Quantitation of hindered depolarizing rotations

Differential polarized phase fluorometric investigations of diphenylhexatriene in lipid bilayers. Quantitation of hindered depolarizing rotations

J R Lakowicz et al. Biochemistry. .

Abstract

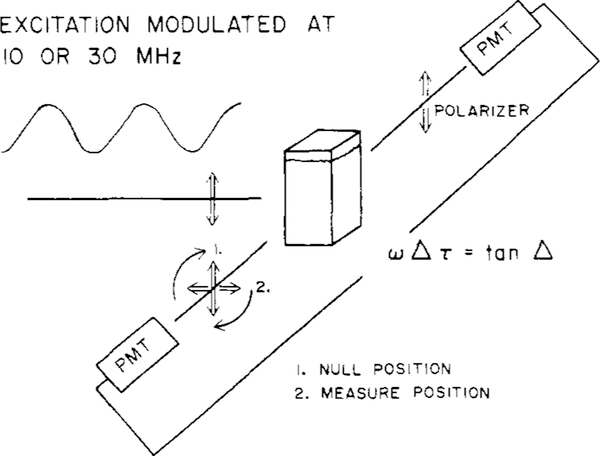
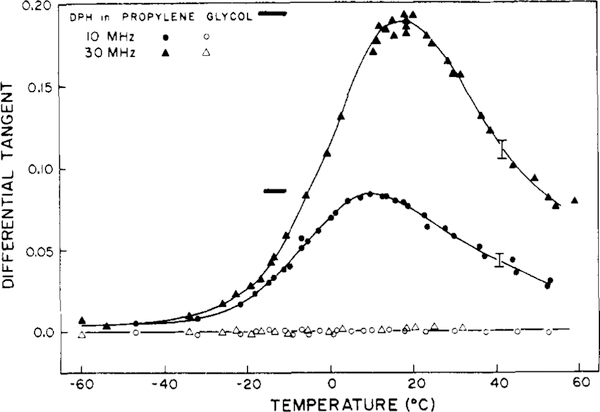
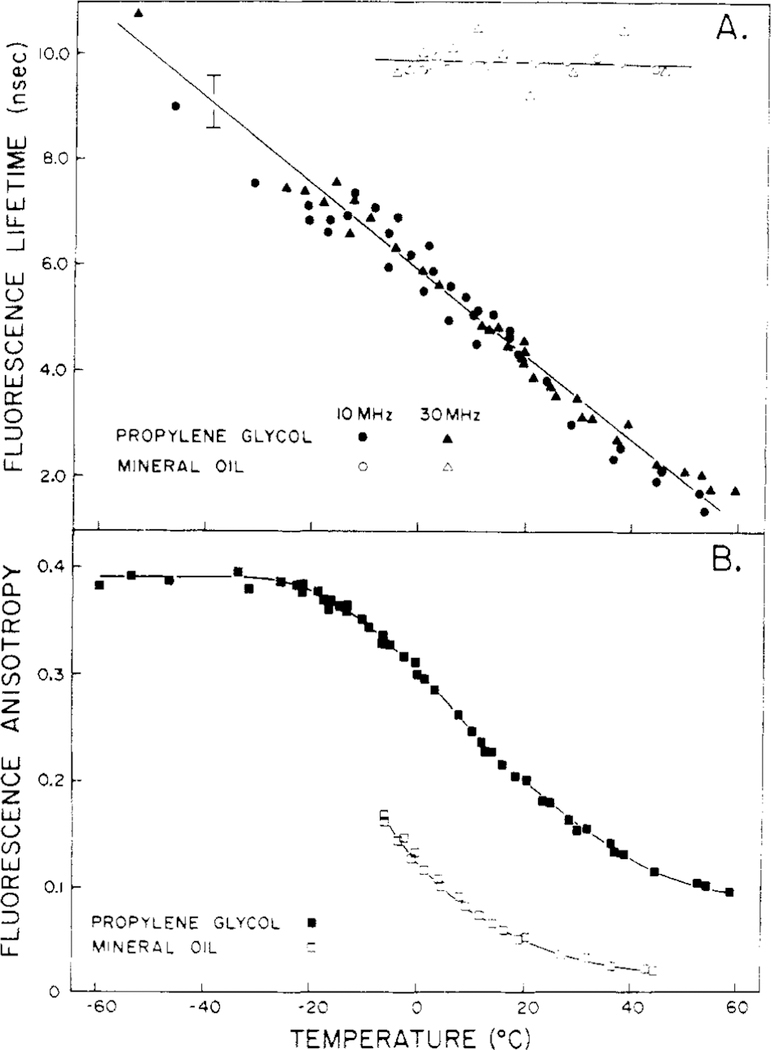
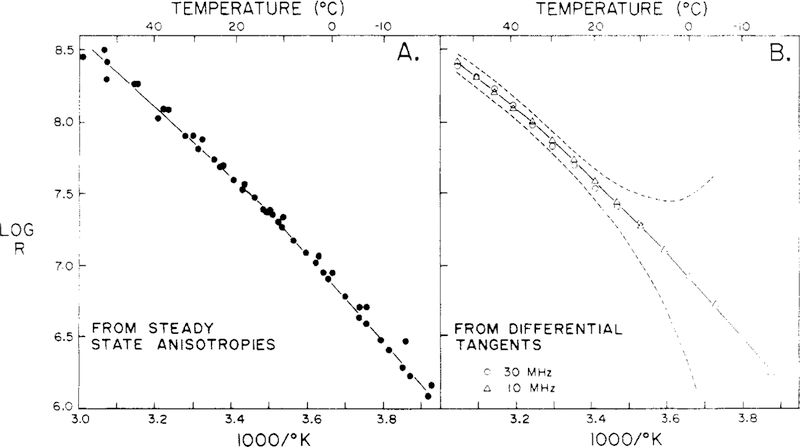
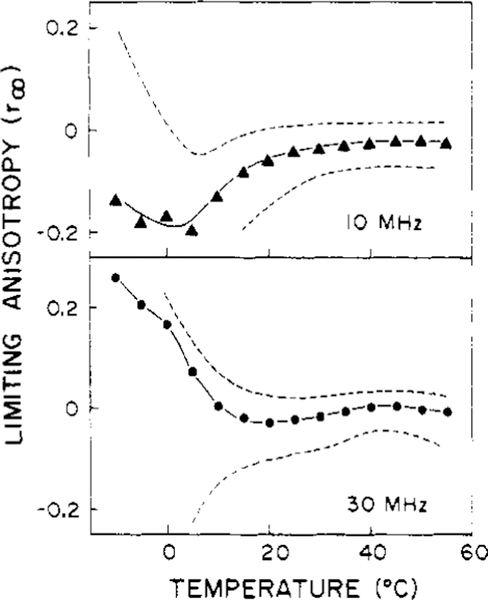
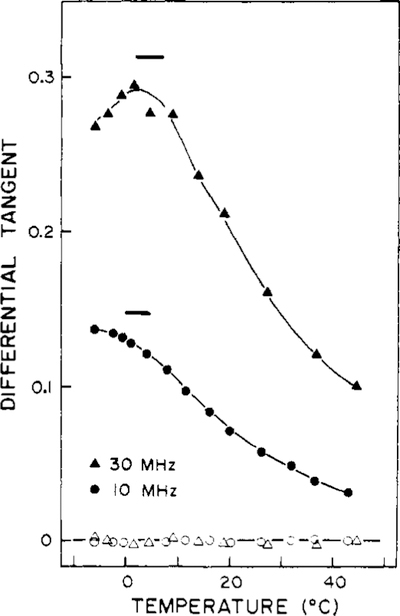
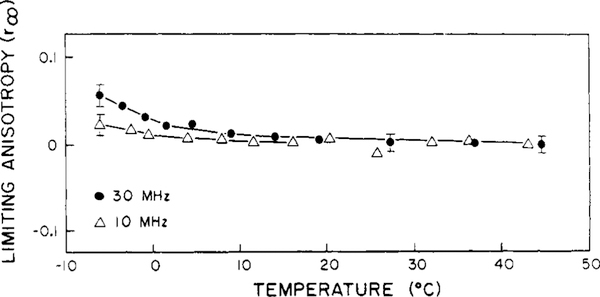
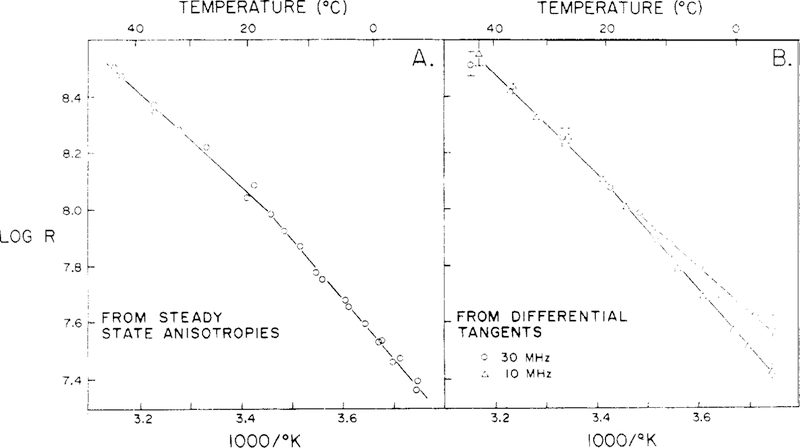
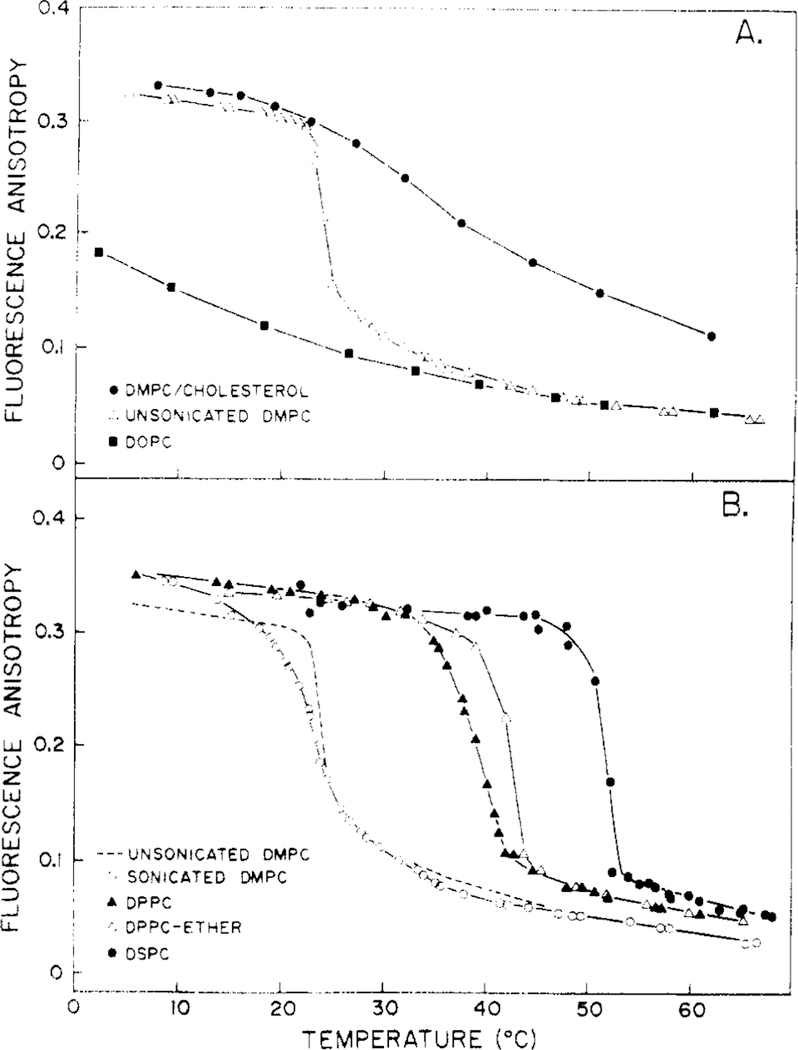
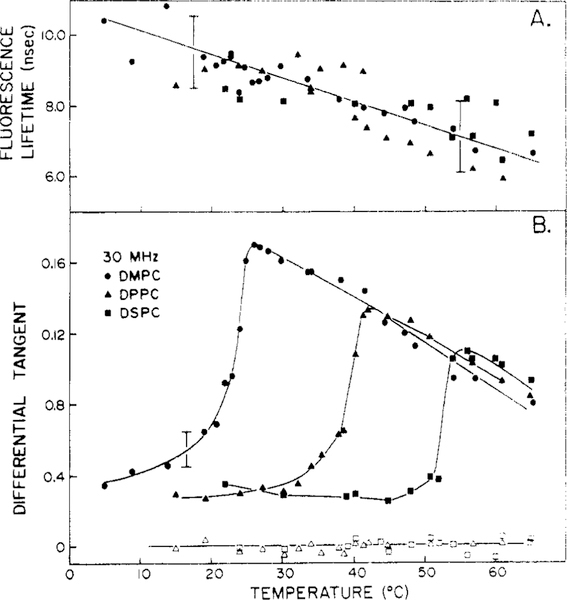
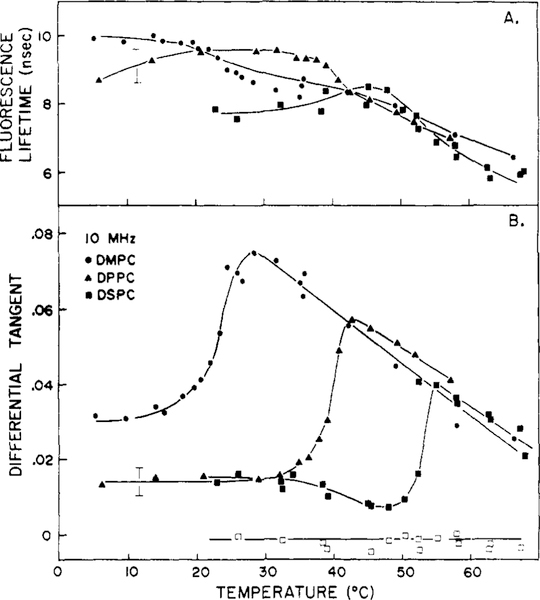
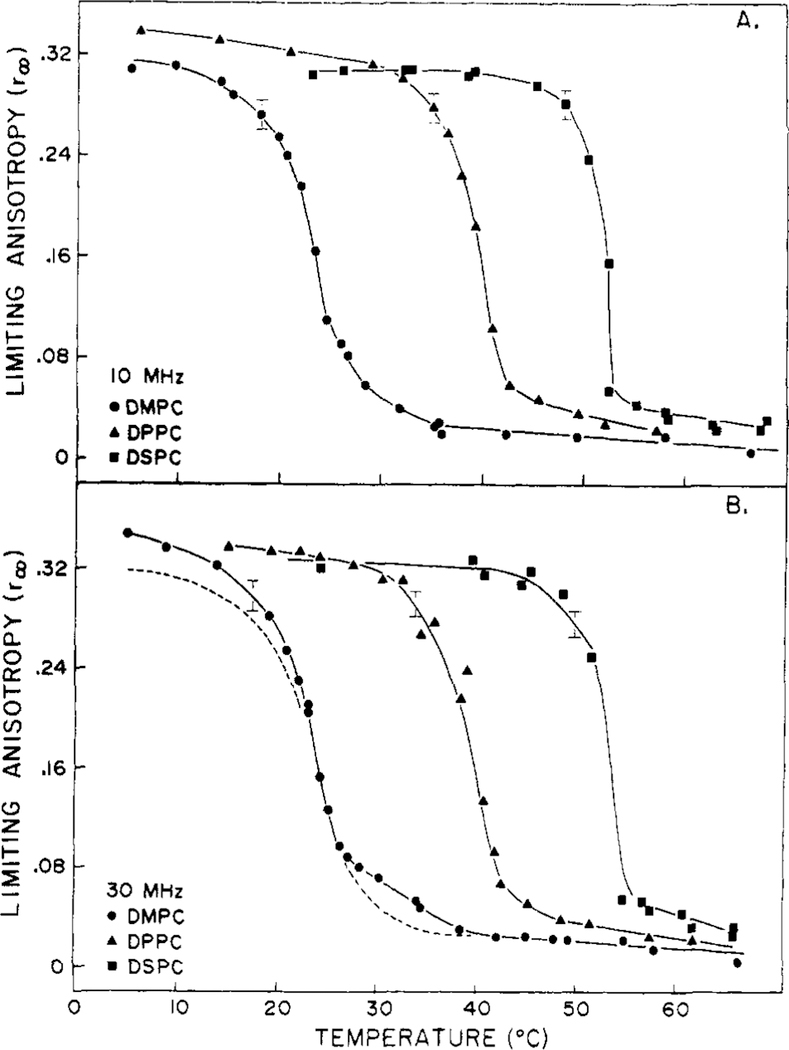
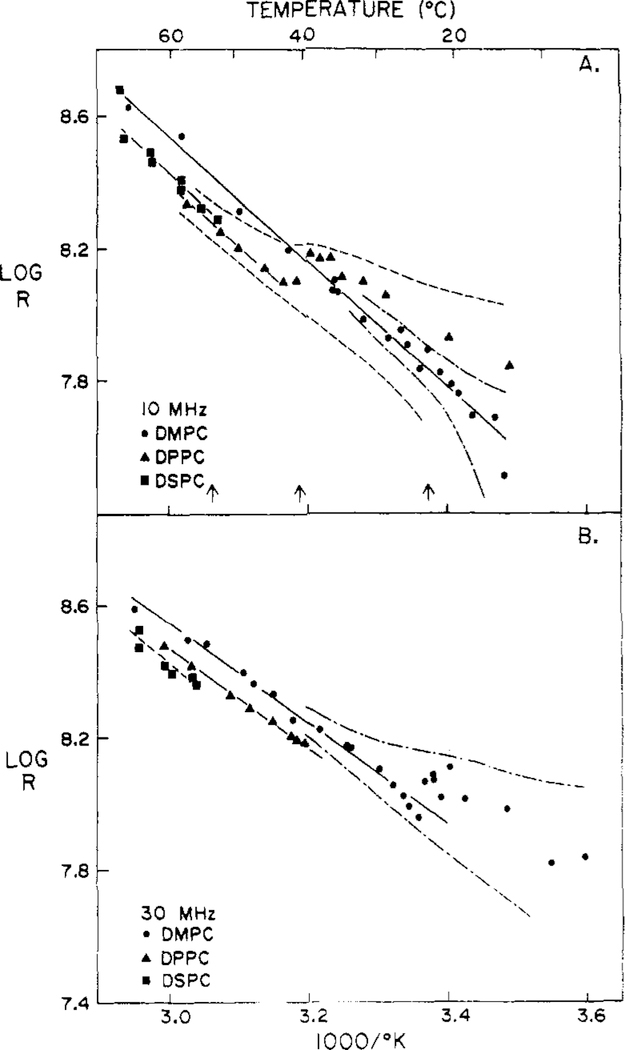
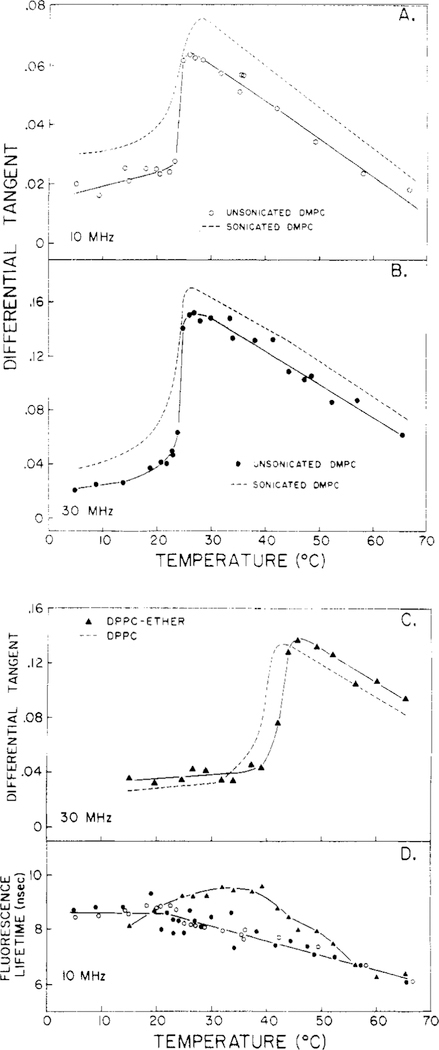
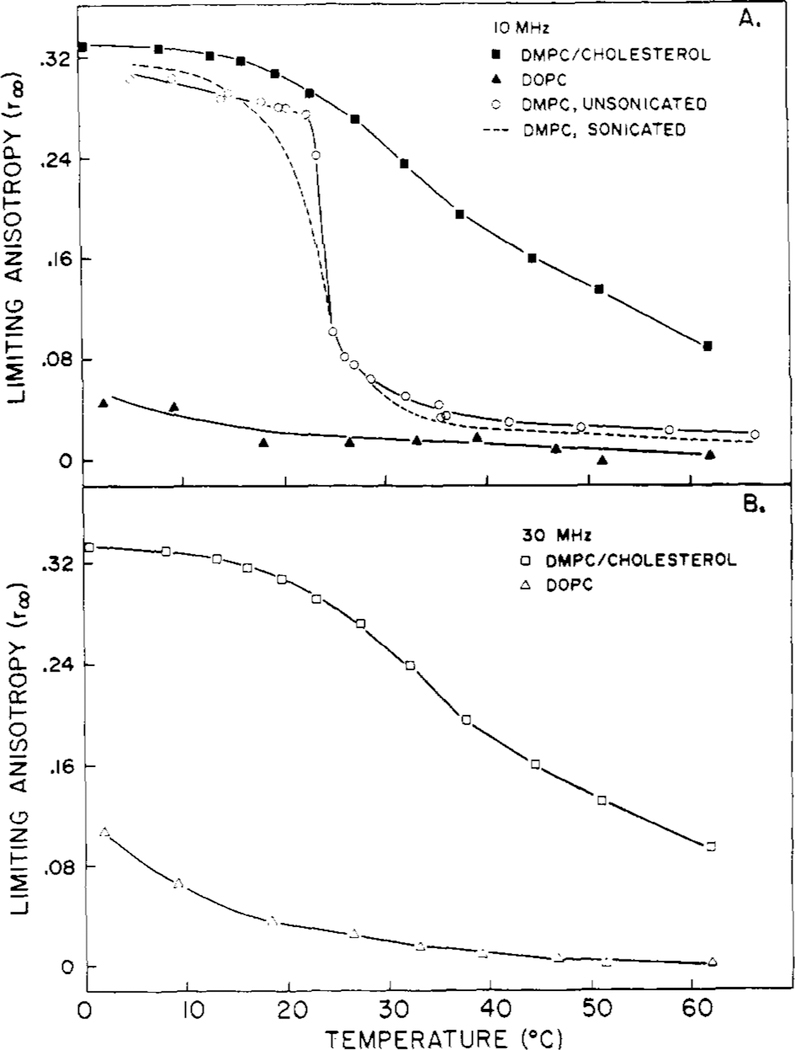
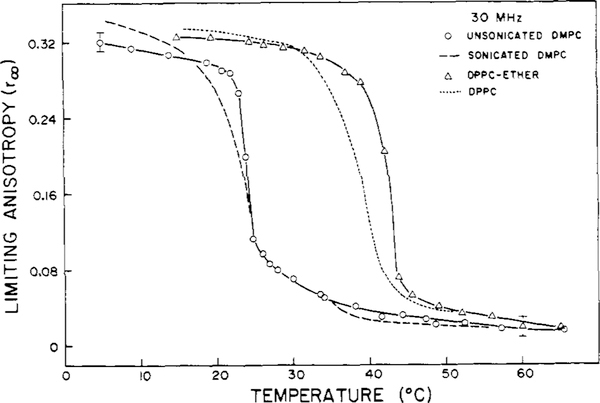
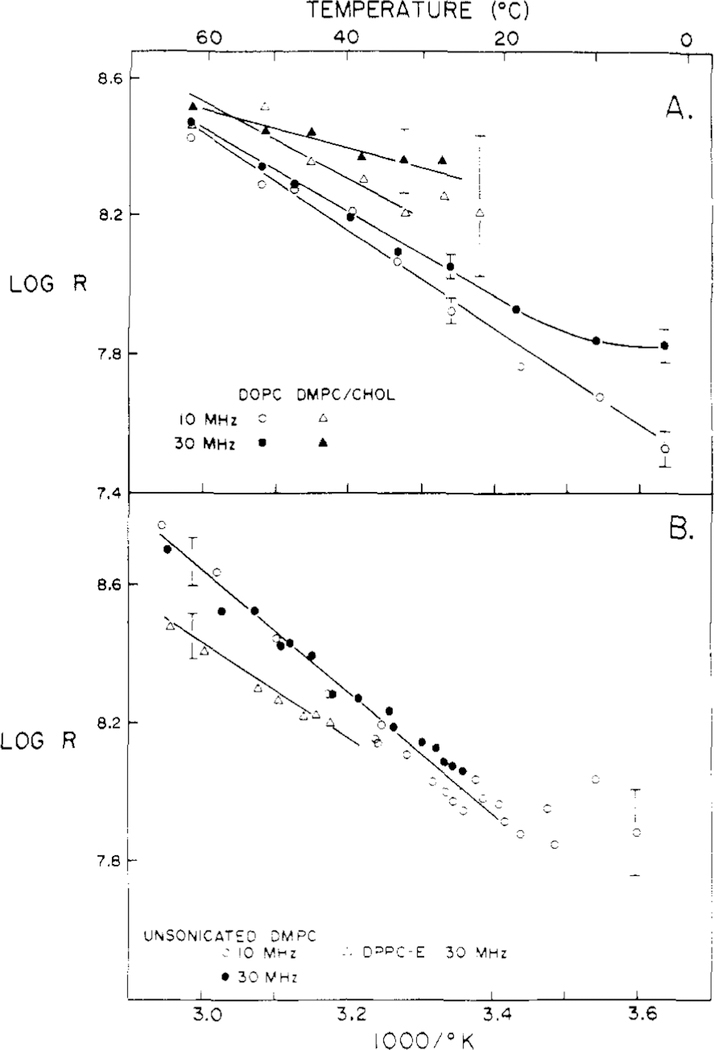
Differential polarized phase fluorometry has been used to investigate the depolarizing rotations of 1,6-diphenyl-1,3,5-hexatriene (DPH) in isotropic solvents and in lipid bilayers. For DPH dissolved in isotropic solvents, there is a precise agreement between the observed and predicted values for maximum differential tangents, indicating that in these media DPH is a free isotropic rotator. In lipid bilayers the tangent defects (i.e., the differences between the calculated and the observed maximum differential tangents) are too large to be explained by anisotropy in the depolarizing rotations but are accounted for by hindered isotropic torsional motions for the fluorophore [Weber, G (1978) Acta Phys. Pol A 54, 173]. This theory describes the depolarizing rotations of the fluorophore by its rotational rate R (in radians/second) and the limiting fluorescence anisotropy (r) at times long compared with the fluorescence lifetime. Through the combined use of both steady-state anisotropy measurements and differential phase measurements, we have demonstrated that one may obtain unique solutions for both R and r. For DPH embedded in vesicles prepared from dimyristoyl-, dipalmitoyl-, and distearoylphosphatidylcholines, the depolarizing motions are highly hindered at temperatures below the transition temperature (Tc) but are unhindered above Tc. The apparent rotational rates of the probe do not change significantly at Tc. These data suggest that the changes observed in the steady-state anisotropy near Tc derive primarily from changes in the degree to which the probe's rotations are hindered, and only to a small extent from changes in rotational rate. For DPH embedded in bilayers that contained 25 mol % cholesterol, no clear transition occurred and the rotations appeared to be hindered at all temperatures. The rotational motions of DPH embedded in dioleolyphosphatidylcholine were found to be far less hindered, but the rotational rates were similar to those obtained in the saturated phosphatidylcholines. Finally, the data show that in an anisotropic environment, such as that of a lipid bilayer, steady-state fluorescence anisotropy measurements alone cannot yield quantitatively meaningful rotational rates. Extrapolation of steady-state aniosotropy data to the quantitation of membrane viscosity is therefore difficult, if not invalid; however, qualitative comparisons can be useful.


Figures

FIGURE 1:
FIGURE 1:
Schematic of a differential phase fluorometer.
FIGURE 2:
FIGURE 2:
Differential tangents of DPH in propylene glycol. The solid dots represent the differential tangents at the frequencies indicated, and the open dots represent the tangent value observed when the excitation polarizer is horizontal, and hence orthogonal to both emission polarizers irrespective of their orientation. This figure contains data from two separate experiments. The solid bars indicate the theoretical tan Δmax for an isotropic rotator with r0 = 0.390 and τ = 5.0 and 4.3 ns at 10 and 30 MHz, respectively; [DPH] = 5 X 10⁻⁶ M.
FIGURE 3:
FIGURE 3:
Fluorescence lifetimes and steady-state fluorescence anisotropies of DPH in propylene glycol and mineral oil. This figure contains data from two separate experiments.
FIGURE 4:
FIGURE 4:
Rotational rates of DPH in propylene glycol. Rotational rates for DPH were obtained from steady-state fluorescence anisotropies (A) and from the hindered rotational model (B), using both 10- and 30-MHz data. In order to minimize scatter in the R values obtained from the hindered rotational model, we use a smoothed data set obtained from reading the required values of τ, tan Δ and r off the lines drawn through the data points on Figures 2 and 3. The dashed line shows the errors in the calculated R values which result from errors of ±0.5 ns in τ, ±0.05 ns in Δτ and ±0.01 in r.
FIGURE 5:
FIGURE 5:
Limiting anisotropies for DPH in propylene glycol obtained from the hindered rotational model. The smoothed data for DPH in propylene glycol was used. The dashed lines represent the errors in the calculated r value resulting from error of ±0.5 ns in τ, ±0.05 ns in Δτ, and ±0.01 in r. The major contributions to the error are in Δτ.
FIGURE 6:
FIGURE 6:
Differential tangents for DPH in mineral oil. The solid dots indicate the differential tangents, and the open dots represent the differential tangent observed when the excitation polarizer is horizontal. The solid horizontal bars indicate tan Δmax for an isotropic rotator with r0 = 0.390 and τ = 9.9 ns; [DPH] = 5 × 10⁻⁶M.
FIGURE 7:
FIGURE 7:
Limiting anisotropies of DPH in mineral oil obtained from the hindered rotation model. The error bars indicate the effect of ±0.05 ns in Δτ and ±0.01 in r. The errors in r dominate above 5 °C, and the errors in Δτ dominate below 5 °C.
FIGURE 8:
FIGURE 8:
Rotational rates for DPH in mineral oil obtained from steady-state anisotropies and the hindered rotational model. The raw data were used, and not smoothed data as were used for propylene glycol. The error bars indicated ±0.05 ns in Δτ.
FIGURE 9:
FIGURE 9:
Steady-state fluorescence anisotropies of DPH in the lipid bilayers used in these studies.
FIGURE 10:
FIGURE 10:
Differential tangents and fluorescence lifetimes of DPH in vesicles composed of saturated phosphatidylcholines, 30 MHz. The open symbols represent the crossed polarizer data for the lipid represented by the same closed symbols. The data for DMPC are from two separate vesicle preparations. Measurements were made at 30 MHz; solid circles represent DMPC, solid triangles, DPPC, solid squares, DSPC.
FIGURE 11:
FIGURE 11:
Differential tangents and fluorescence lifetimes of DPH in vesicles composed of saturated phosphatidylcholines, 10 MHz. The open squares represent the crossed polarizer data for DSPC vesicles. The figure contains data from two separate vesicle preparations of DMPC.
FIGURE 12:
FIGURE 12:
Limiting anisotropies (r) of DPH in vesicles composed of saturated phosphatidylcholines. Data are shown for 10 (A) and 30 MHz (B). The dashed line in part B represents the r values observed at 10 MHz. The errors in r are relatively constant with temperature. Below the transition temperature, errors in Δτ dominate, and above this temperature the errors in r are dominant.
FIGURE 13:
FIGURE 13:
Rotational rates of DPH in saturated phosphatidylcholine vesicles. Data are shown for 10 (A) and 30 MHz (B). The dashed lines on part A represent the errors in the calculated value of R for DPH in DPPC (---) and in DMPC (-·-·-) resulting from errors of ±0.05 ns in Δτ, Variations in R almost as large would result from errors in r = ±0.01. The rotational rates at temperatures below Tc or not shown due to the large experimental uncertainty. The arrows indicate the temperature at which the r value has decreased through one-half of the maximum observed change.
FIGURE 14:
FIGURE 14:
Differential tangents and fluorescence lifetimes for single bilayer and multilamellar bilayers of DMPC and DPPC-ether. (A) Multilamellar DMPC bilayers (○) and comparative data for single lamellar bilayers (---) at 10 MHz. (B) Same as A, except at 30 MHz (●). (C) Single lamellar bilayers of DPPC-ether (▲) and comparative data for DPPC (---). (D) Fluorescence lifetimes.
FIGURE 15:
FIGURE 15:
Differential tangents and fluorescence lifetimes for DPH in vesicles of DOPC and DMPC/cholesterol, 3/1.
FIGURE 16:
FIGURE 16:
Limiting anisotropies of DPH-labeled lipid bilayers.
FIGURE 17:
FIGURE 17:
Limiting anisotropies of DPH-labeled lipid bilayers. Error bars show uncertainty in r resulting from ±0.01 in r. This error is relatively constant across the r temperature profile.
FIGURE 18:
FIGURE 18:
Rotational rates of DPH in lipid bilayers.

Similar articles

Cited by

References

    1. Chen LA, Dale RE, Roth S, & Brand L. (1977) J. Biol. Chem 252, 2163. - PubMed
    1. Cogan U, Shinitzky M, Weber G, & Nishida T. (1973) Biochemistry 12, 521. - PubMed
    1. Cullis PR, De Kruijiff B, McGrath AE, Morgan CG, & Radda GK, (1976) in Structure of Biological Membranes (Abrahamsson S, & Pascher I, Eds.) p 389, Plenum Press, New York.
    1. Dale RE, Chen LA, & Brand L. (1977) J. Biol. Chem 252, 7500. - PubMed
    1. Heidt J. (1966) Acta Phys. Pol 15, 3.

Publication types

LinkOut - more resources