. 1979 Feb 6;18(3):520-7.
doi: 10.1021/bi00570a022.

Fluorescence anisotropy measurements under oxygen quenching conditions as a method to quantify the depolarizing rotations of fluorophores. Application to diphenylhexatriene in isotropic solvents and in lipid bilayers

Fluorescence anisotropy measurements under oxygen quenching conditions as a method to quantify the depolarizing rotations of fluorophores. Application to diphenylhexatriene in isotropic solvents and in lipid bilayers

J R Lakowicz et al. Biochemistry. .

Abstract

We have measured the fluorescence anisotropy of 1,6-diphenyl-1,3,5-hexatriene (DPH) as its fluorescence lifetime is decreased by oxygen quenching. Such studies were done on DPH dissolved in the isotropic solvent mineral oil and for DPH embedded in phospholipid vesicles of either dimyristoyl-l-α-phosphatidylcholine (DMPC) or dioleoyl-l-α-phosphatidylcholine (DOPC), each at several temperatures. In order to obtain adequate quenching increased pressures of oxygen had to be used. Oxygen quenching resulted in significant changes in intensity and anisotropy, and these effects were reversible. To control for possible effects of pressure on the systems under study, equivalent experiments were performed with nitrogen, argon, or helium forming the gas phase. Under these last-mentioned conditions, changes in intensity and anisotropy were insignificant when compared with those observed with oxygen quenching. The depolarizing rotations of the fluorophore are described by its rotation rate (R) in radians/seconds and its limiting anisotropy at times which are long compared with the fluorescence lifetime, r. This latter parameter provides a measure of the degree to which the fluorophore’s environment hinders its rotational diffusion. Oxygen quenching of fluorescence provides a means to vary the fluorescence lifetime simultaneous observation of the steady-state fluorescence anisotropy allows quantitation of both R and r. For DPH in mineral oil at two different temperatures we found that the values of R obtained from this quenching –anisotropy measurement agreed precisely with those obtained from steady-state anisotropy measurements and with the values obtained from differential polarized phase fluorometry (Lakowicz, J. R., et al. (1979) Biochemistry 18 (preceding paper in this issue)). Additionally, r was found to be zero. These results indicate that in mineral oil DPH behaves as an ideal unhindered isotropic rotator. In contrast. DPH embedded in lipid bilayer vesicles of DMPC behaves as an isotropic but highly hindered rotator below the phase transition temperature, as is indicated by r ≃ 0.33. Above the phase transition temperature the depolarizing rotations become significantly less hindered, r ≃ 0.03. In DOPC vesicles the depolarizing rotations are unhindered at all temperatures. The temperature profiles of R and r obtained for DPH in lipid bilayers were in agreement with those observed using differential polarized phase fluorometry. Quenching–anisotropy measurements of the type we have described provide a powerful method for investigation of time-resolved decays of fluorescence anisotropy without the direct use of time-resolved methods. The estimation of membrane microviscosity from steady-state anisotropy measurements assumes that the nature of the depolarizing rotations of the fluorophore in the membrane are identical with those in an isotropic reference solvent. Our results indicate that this assumption is invalid. We estimated the apparent membrane viscosity by three methods: (1) from steady-state anisotropy measurements; (2) from the rotational rate of DPH within its hindered environment; and (3) from the diffusivity of molecular oxygen. Each method yielded a different value with steady-state polarization giving the highest and oxygen diffusivity the lowest. These results show that any quantitative estimate of microviscosity depends critically upon the molecular process used for its estimation.


Figures

FIGURE 1:
FIGURE 1:
Fluorescence emission spectra of DPH in DMPC vesicles. Spectra are shown for DPH-labeled DMPC vesicles for the same sample under an argon atmosphere (---) and after equilibration with 1550 psi of oxygen pressure (—), both normalized to the same maximum intensity. At 1550 psi of oxygen F0/F is 44.4 at the experimental temperature of 29.6 °C.
FIGURE 2:
FIGURE 2:
Stern–Volmer plots of the oxygen quenching of DPH in DMPC vesicles.
FIGURE 3:
FIGURE 3:
Separation of the static and dynamic oxygen quenching constants.
FIGURE 4:
FIGURE 4:
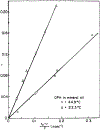
Oxygen quenching–anisotropy plot of DPH in mineral oil.
FIGURE 5:
FIGURE 5:
Oxygen quenching–anisotropy plots of DPH-labeled DMPC vesicles. Data for 3, 11, and 14 °C are omitted from this plot since r is relatively invariant with quenching, these values being 0.35, 0.35, and 0.33, respectively. Unfortunately, as a result of the small changes in r with quenching, the rotational rates could not be determined at these temperatures.
FIGURE 6:
FIGURE 6:
Limiting anisotropies (r) as observed by oxygen quenching–anisotropy measurements and differential polarized phase fluorometry. Data are shown for DMPC (○) and DOPC (□) labeled with DPH as observed by the quenching method. For comparison, data are shown which were obtained by differential phase measurements, DMPC (---). DOPC (⋯), the latter at both 10 (lower) and 30 MHz (upper).
FIGURE 7:
FIGURE 7:
Comparison of the rotational rates of DPH as observed from oxygen quenching–anisotropy studies and differential phase measurements. Rotational rates for DPH, as observed by the oxygen quenching–anisotropy method, are shown for DMPC (○) and DOPC (□). For comparison we show these same rates for DPH in DMPC (---) and DOPC (⋯), as observed by differential polarized phase fluorometry. The numbers indicate 10 and 30 MHz data.
FIGURE 8:
FIGURE 8:
Oxygen quenching–anisotropy plot of DPH-labeled DOPC vesicles.
FIGURE 9:
FIGURE 9:
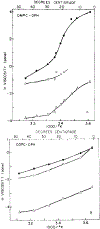
Comparison of membrane microviscosities as calculated by three different methods. Data are shown for DMPC (A) and DOPC (B) vesicles labeled with DPH. Microviscosities were calculated from the steady-state anisotropy measurements in the absence of oxygen quenching (●), from the rotational rate of the fluorophore as observed by oxygen quenching–anisotropy measurements (○), and from the diffusivity of oxygen (Δ). The procedures used are described in the Discussion.

References

    1. Anderson SR, & Weber G (1965) Biochemistry 4, 1948.
    1. Boaz H, & Rollefson GK (1950) J. Am. Chem. Soc 72, 3435.
    1. Bridge JB, & Johnson P (1973) Eur. Polym. J 9, 1327.
    1. Chen LA, Dale RE, Roth S, & Brand L (1977) J. Biol. Chem 252, 2163. - PubMed
    1. Cogan V, Shinitzky M, Weber G, & Nishida T (1973) Biochemistry 12, 521. - PubMed

Publication types

LinkOut - more resources