

Diffusion of sucrose, sodium, and water in ventricular myocardium
- PMID: 4440753
- PMCID: PMC3024886
- DOI: 10.1152/ajplegacy.1974.227.5.1116
Diffusion of sucrose, sodium, and water in ventricular myocardium
Abstract
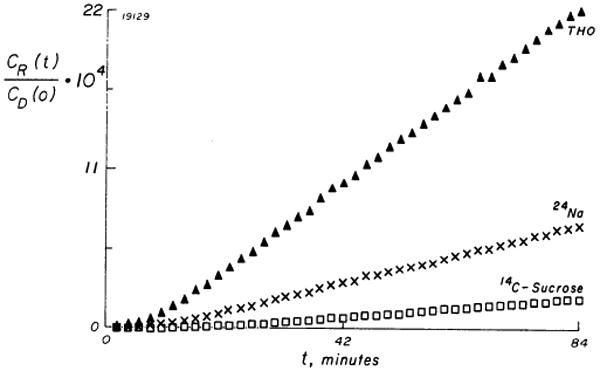
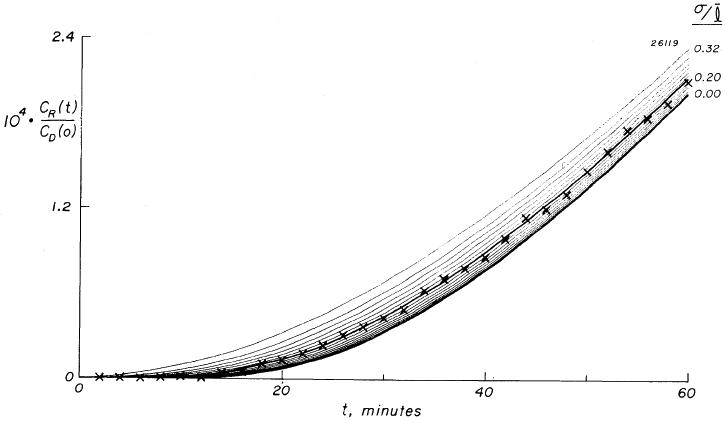
The cumulative fluxes of radioactive sucrose, sodium, and water across a sheet of cat right ventricle were studied simultaneously to obtain the apparent tissue diffusion coefficients for extravascular diffusion at 37°C. The sucrose data fitted the equations for diffusion in tortuous channels in a plane sheet with a tortuosity factor, λ, of 2.11 ± 0.11 (mean ± SE, n = 10). The fit of the earliest data before attainment of steady state was improved by assuming a Gaussian distribution of diffusion path lengths through the extracellular space, but λ was only changed by a few percent. The sucrose diffusion channel contained 0.27 ± 0.03 ml of total tissue water, which is more than measured by others but still less than the expected sucrose space. The steady-state data for sodium agreed with the model for extracellular diffusion using λ and the area available for diffusion for sucrose when sodium equilibration with a dead-end pore volume (presumed to be intracellular) was taken into account. The cumulative flux data for water were monotonic and lacked secondary inflections. Thus the apparent tissue diffusion coefficients for sucrose, sodium, and water were (in 10−6 cm2/s) 1.77 ± 0.23, 5.13 ± 0.68, and 7.39 ± 0.99, respectively, representing a reduction to 23% of the free diffusion coefficient for sucrose and sodium and 22% for water.
Figures
References
-
- Armstrong W, Lurie D, Burt MR, High JR. Extracellular volume and ionic content of frog ventricle. Am J Physiol. 1969;217:1230–1235. - PubMed
-
- Bassingthwaighte JB, Knopp TJ, Hazelrig JB. Alfred Benzon Symp Capillary Permeability. 2nd. Copenhagen: 1970. A concurrent flow model for capillary-tissue exchanges; pp. 60–80.
-
- Bassingthwaighte JB, Reuter H. Calcium movements and excitation-contraction coupling in cardiac cells. In: DeMello WC, editor. Electrical Phenomena in the Heart. New York: Academic; 1972. pp. 353–395.
-
- Coleman HN, Dempsey PJ, Cooper T. Myocardial oxygen consumption following chronic cardiac denervation. Am J Physiol. 1970;218:475–478. - PubMed
MeSH terms
Substances
Grants and funding
LinkOut - more resources
Full Text Sources
Miscellaneous