. 1974 Sep;35(3):483-503.
doi: 10.1161/01.res.35.3.483.

A concurrent flow model for extraction during transcapillary passage

A concurrent flow model for extraction during transcapillary passage

J B Bassingthwaighte. Circ Res. 1974 Sep.

Abstract

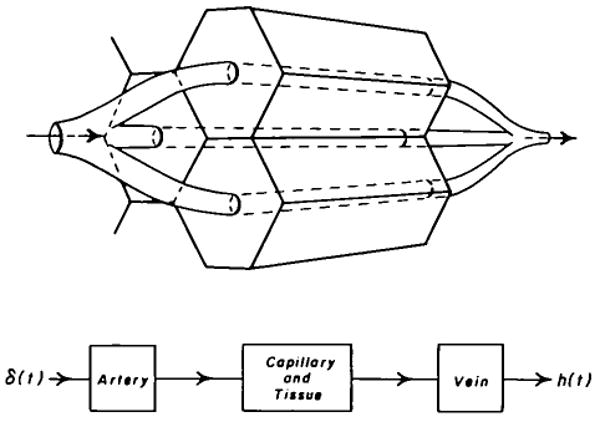
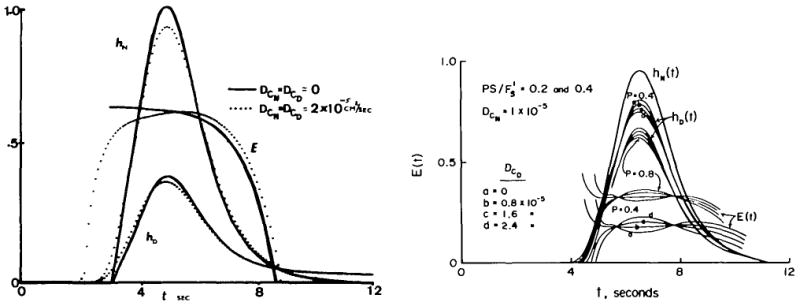
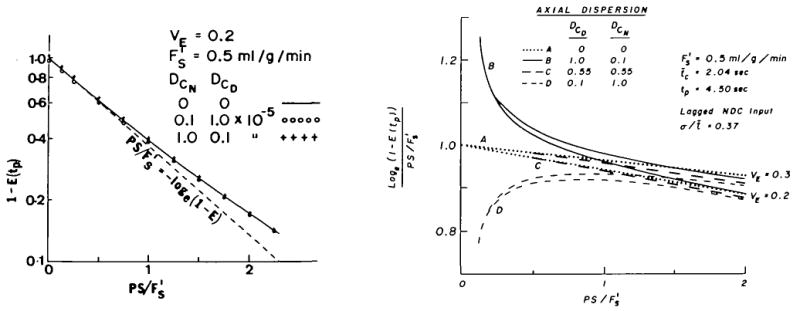
A model for capillary-tissue exchange in a uniformly perfused organ with uniform capillary transit times and no diffusional capillary interactions was designed to permit the exploration of the influences of various parameters on the interpretation of indicator-dilution curves obtained at the venous outflow following the simultaneous injection of tracers into the arterial inflow. These parameters include tissue geometric factors, longitudinal diffusion and volumes of distribution of tracers in blood and tissue, hematocrit, volumes of nonexchanging vessels and the sampling system, capillary permeability, P. capillary surface area, S, and flow of blood- or solute-containing fluid, Fs′. An assumption of instantaneous radial diffusion in the extravascular region is appropriate when intercapillary distances are small, as they are in the heart, or permeabilities are low, as they are for lipophobic solutes. Numerical solutions were obtained for dispersed input functions similar to normal intravascular dye-dilution curves. Axial extravascular diffusion showed a negligible influence at low permeabilities. The “instantaneous extraction” of a permeating solute can provide an estimate of PS/Fs′, the ratio of the capillary permeability–surface area product to the flow, when PS/Fs′ lies between approximately 0.05 and 3.0; the limits of the range depend on the extravascular volume of distribution and the influences of intravascular dispersion. The most accurate estimates were obtained when experiments were designed so that PS/Fs′ was between 0.2 and 1.0 or peak extractions were between 0.1 and 0.6.


Figures

FIGURE 1
FIGURE 1
Diagram of capillary-tissue model composed of hexagonal axisymmetric columns of equal length. With concurrent, identical flows in adjacent capillaries having coincident entrances and exits, there are no concentration gradients across the interfaces between regions and no net fluxes between hexagons. See text for abbreviations.
FIGURE 2
FIGURE 2
Responses of capillary-tissue model to three input functions (see text). Parameters were: Rc = l.62μ, L = 400μ, R = 7.5μ, υ c = 0.15, Fa/W = 1.0 ml/g min−1, ρ = 1.063 g/ml, P = 2 × 10⁻⁵ cm/sec, υE = 0.32, nx = 50, Hct = 0.5, υrbc = 0, Dc = DE = 0. Parameters of the lagged normal density curve input used in the middle section of the figure were σ = 0.81 seconds, τ = 1.0 seconds, and tc = 2.5 seconds. PS = 0.59 ml/g min−1 and PS/Fs′ = 1.39.
FIGURE 3
FIGURE 3
Effect of permeability on E(t). Values of P × 105 cm/sec are given on the figure. For Cin (t), a lagged normal density curve was used with σ = 1.0 second, τ = 1.0 second, and tc = 4.0 seconds. Left: Curves of hN(t). hD(t). and E(t) are shown for permeabilities of 0.5 to 8.0. Increasing P gave higher values of Emax. Parameters are the same as they are in Figure 2 except R = 7.5μ and Rc = 2.0μ. Right: Effect of a linear increase in permeability along the length of the capillary. For both responses the average P = 2 × 10⁻⁵ cm/sec and PS = 0.6 ml/g min−1. The values of Emax were the same whether P(x) was constant or not, but in the case with P(x) increasing strongly toward the veins, most of the tracer escaped in the downstream end of the tissue hexagon, leaving the upper end relatively devoid of tracer. This situation had the effect of reducing the effective extravascular volume of distribution and promoting earlier back diffusion so that E(t) fell to zero at an earlier time. Rc = 1.62μ.
FIGURE 4
FIGURE 4
Effects of contact time and exchangeable intravascular volumes on extraction. With Fa/W = 1 ml/g min−1, υV = 0.15, Rc = 2μ, Hct = 0.5, υrbc = 0, P = 1.5 × 10⁻⁶ cm/sec, and ρ = 1.063 g/ml, S = 607 cm2/g, PS = 0.55 ml/g min−1, and PS/Fs′ = 1.28. Top Left: Increasing the fractional volume. υV, of the nonexchanging arteries and veins from 5% to 25% of the organ volume reduced the functional myocardial mass and the number of capillaries and resulted in a 13% diminution in Emax. Top Right: With υV = 0.15, Rc was increased from 1.6μ to 2.6μ in steps of 0.25μ, resulting in reduced intravascular velocity and increased capillary surface area, which thereby caused Emax to increase from 0.52 to 0.70. Other parameters were the same as they were for the top left section of this figure. Bottom Left: Increasing hematocrit from 30% to 50% with υrbc = 0 decreased plasma volume and resulted in an increase in Emax from 0.48 to 0.60. υV = 0.15; other parameters are the same as they are for the top left section. Bottom Right: With Hct constant at 0.50, increasing the rapidly exchangeable fraction of the erythrocyte from 0 to 0.8 reduced Emax from 0.60 to 0.40; this situation is the same as that which occurs when plasma flow is increased 80% or Hct is reduced to 0.10.
FIGURE 5
FIGURE 5
With a small extravascular volume of distribution υEVE, tracer returned rapidly from extravascular tissue into the blood, quickly reducing E(t) from its initial value. The effect of increasing the extravascular volume of distribution was to delay return of tracer and prolong the plateau of E(t). Since axial diffusion was zero, the initial value for each E(t) was Emax, in this case 0.62. Parameters were the same as those given for the top left section of Figure 4, and υV = 0.15.
FIGURE 6
FIGURE 6
Effects of longitudinal intracapillary diffusion. Left: Finite axial intravascular dispersion (dotted lines) of both tracers, permeant and nonpermeant, gave lower values for the early part of E(t), although Emax was very nearly as high (0.615 compared with 0.633) as it was when dispersion was zero (solid lines). Right: When the reference tracer became more dispersed than the permeating tracer, E(t) was initially high and decreased to a temporary minimum. When the permeating tracer was relatively more dispersed, E(t) rose gradually to peaks that were slightly greater than the value of Emax obtained when axial dispersion was zero for both tracers. The values of E(t) at the first nodes at 5.4 seconds were 99% of Emax obtained with DcN = DcD = 0. See text.
FIGURE 7
FIGURE 7
Effects of back diffusion and axial diffusion on estimates of PS. Left: The broken line is the classical calculation. Eq. 2. With a limited extravascular region, υE = 0.2, tracer returns, reducing E(tρ) (solid line). Axial intravascular dispersion of reference and permeant tracers causes small changes in E(t), which result in substantial errors in estimating PS only at low PS/Fs′. Right: Ratio of PS/Fs′ estimated by Eq. 2 to actual PS/Fs′ in eight situations (four differing axial dispersion effects at each of two extravascular volumes of distribution). The “ideal” line at 1.0 would occur with υE = ∞; smaller values of υE deviate more from the ideal. Lines A (no intravascular dispersion) and C (equal dispersion of permeant and reference tracers) approach the ideal at low PS/Fs′, but C deviates more than A at high PS/Fs′. Relatively greater dispersion of the permeant tracer (lines B and circles in the left section of figure) gives increased E(tp) and slight overestimation of PS at low PS/Fs′. Relatively greater dispersion of the nonpermeant (Taylor diffusion) does the opposite (lines D and crosses in the left section).
FIGURE 8
FIGURE 8
Effect of dispersion in the venous outflow. The capillary outflow is convoluted with venous transport functions, hυ(t), representing volumes of outflow veins that are small (t̄υ = 1 second) and large (t̄υ = 10 seconds). The dispersion occurring with large venous transit times resulted in lower apparent values of Emax and underestimation of PS. The reduction in Emax was small when υE was large, giving minimal back diffusion, but the diminution of Emax and particularly E(tp) was substantial when υE was small.
FIGURE 9
FIGURE 9
Isometric projection of tracer concentrations in a capillary-tissue model taking radial diffusion into account (4) at 0.3 seconds (left) and 0.6 seconds (right) after introduction of a 0.01-second pulse of tracer into the arterial end of the capillary at time zero. X is the fractional distance along the capillary, r is the fractional distance from the center of the capillary to the outside of the tissue hexagon, and flow is from left to right. Parameters are: Rc = 4μ, R = 10μ, L = 100μ, P = 250 × 10−5 cm/sec, DEr = DEx = 1 × 10⁻⁵ cm2/sec. t̄c = 0.66 seconds, and PS/Fs′ = 8.2. Even with this high value for permeability, the concentration gradient across the capillary membrane was steep: however, even with this fairly low value of DEr/(R − Rc)2, the radial concentration gradients in the tissue were negligible. Axial gradients persisted for many seconds.

References

    1. Crone C. Permeability of capillaries in various organs as determined by use of the “indicator diffusion” method. Acta Physiol Scand. 1963;58:292–305. - PubMed
    1. Sangren WC, Sheppard CW. Mathematical derivation of the exchange of a labeled substance between a liquid flowing in a vessel and an external compartment. Bull Math Biophys. 1953;15:387–394.
    1. Renkin EM. Transport of potassium-42 from blood to tissue in isolated mammalian skeletal muscles. Am J Physiol. 1959;197:1205–1210. - PubMed
    1. Bassingthwaighte JB, Knopp TJ, Hazelrig JB. Concurrent flow model for capillary-tissue exchanges. In: Crone C, Lassen NA, editors. Capillary Permeability, Alfred Benzon Symposium II. Munksgaard; Copenhagen: 1970. pp. 60–80.
    1. Goresky CA, Ziegler WH, Bach GG. Capillary exchange modeling: Barrier-limited and flow-limited distribution. Circ Res. 1970;27:739–764. - PubMed