. 1968 Aug;23(2):259-78.
doi: 10.1161/01.res.23.2.259.

Estimation of coronary blood flow by washout of diffusible indicators

Estimation of coronary blood flow by washout of diffusible indicators

J B Bassingthwaighte et al. Circ Res. 1968 Aug.

Abstract

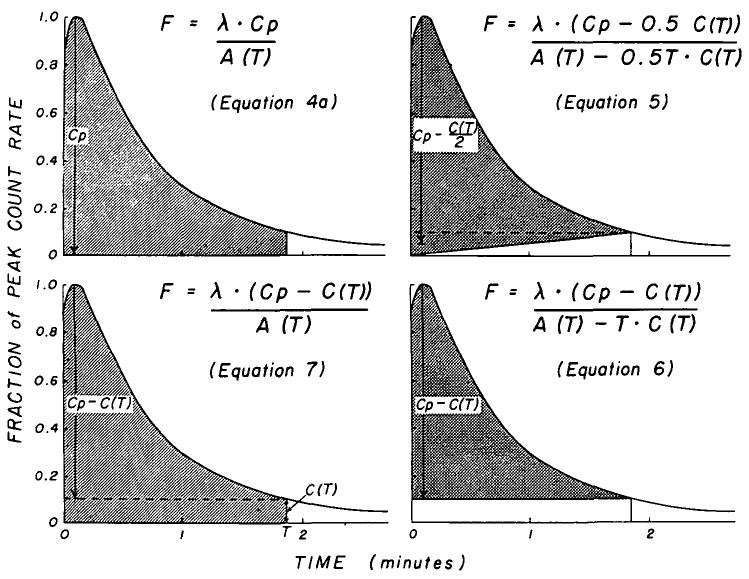
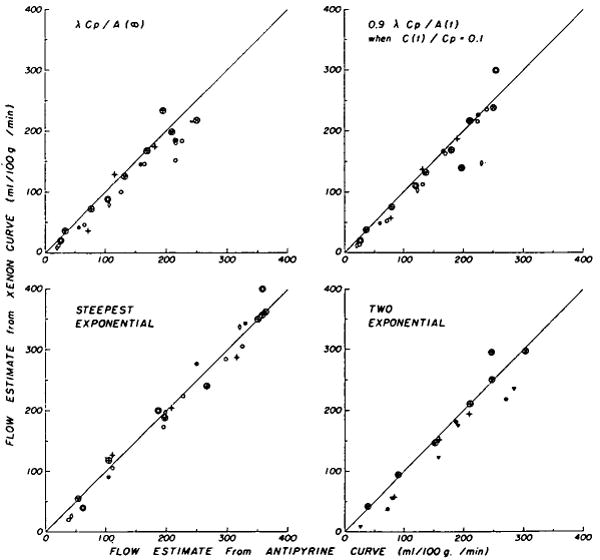
In 13 canine hearts, 158 disappearance curves for 133Xe and antipyrine-125I, given by intra-arterial slug injection, were recorded at a wide range of perfusion rates. Flow rates (ml/100 g/min) calculated from these curves by a variety of methods were compared with measured flow rates (Fa) per weight of perfused tissue. Perfusion of isolated, supported hearts and of anterior descending coronary arteries in open-chest dogs provided similar data. The semilogarithmic slope of curves from apex or whole heart decreased with time, particularly at high flow rates. There was a small, consistent difference in shape between antipyrine and xenon curves, suggesting that radioactivity in fat contributed somewhat to this tailing. Estimation of flow rate from the steepest semilog slope yielded an average value of 1.1Fa for all rates; estimation from slope at 30% of peak radioactivity gave 0.9Fa. The curves were closely described by a two-exponential equation which gave flow estimates of 0.95Fa when collimation limited the observations to the heart apex, and lower values when the whole heart was observed. Peak height/area methods gave values of approximately 0.75Fa in spite of various compensations for the impossibility of recording the curve until radioactivity = 0.


Figures

Figure 1
Figure 1
Semilogarithmic plots of xenon washout curves at various blood flow rates in four experimental situations (i.m. = intramuscular, i.a. = intra-arterial). The curves of each panel were obtained from the same preparation within 2 hours of each other. The actual flow rate (ml/100 g tissue/min) is indicated for each curve. The nonlinear plots seen in all panels illustrate that monoexponential washout does not occur, even when recirculation is prevented (all panels except the upper right) and even when intramuscular injection was used, upper left.
Figure 2
Figure 2
Flow calculated from exponential slope of portion of the curve centered at a time when C(t)/Cp = 0.3. (F = estimate flow and Fa = actual flow.) Data of each panel are summarized by regression equations given in Table 1. Each symbol refers to the same dog heart.
Figure 3
Figure 3
Two-exponential curves (equation 2) fitted to four pairs of isotope disappearance curves from one isolated heart experiment. The antipyrine-125I was injected intra-arterially 3 to 8 minutes before the 133Xe injection; flow rate and perfusion pressure were constant for each pair of curves. Equation 3 has been fitted to the xenon count rates, CXe, and to the antipyrine count rates, CAp, and plotted at every third point. For an example, the equations for the curves of the left upper panel are: CAp(t) = 1,160[0.32(47)exp(−.47t/λ) + 0.68(17) exp(−.17t/λ)]; CXe(t) = 1,200[0.43(18.3)exp(−.18/λ) + 0.57(2)exp(−.02t/λ)]. F̄X and F̄A are flows calculated by equation 3 for xenon and antipyrine curves, respectively.
Figure 4
Figure 4
Mean flow from two-exponential analysis calculated by means of equations 2 and 3. Regression equations are given in Table 1.
Figure 5
Figure 5
Geometric representation of four variations of the height/area (H/A) formula. The shaded portion represents the area in the denominator of each equation; the vertical arrow represents the height, H. In each, the area increases as the integration period lengthens and in all but the original method (upper left) the height used in the calculation also increases. F is in ml/g/min.
Figure 6
Figure 6
Dependency of flow estimation by height/area (H/A) on relative count rate at time, T, during tail of curve, for the four variations of the H/A method shown in Figure 5. Each line represents the late portion of one xenon washout curve and all are from the same isolated heart. The numerals on each line represent the actual flow rate, Fa, and the ordinate is the ratio of estimated to actual flow, F/Fa. C(T)/Cp is zero when the isotope washout curve has returned to the base line, and a close approximation to the F/Fa that would be obtained is given by extrapolating each line to C(T)/Cp = 0, for example, at the point F0 (upper left). Only one method (lower left) is insensitive to the level of C(T)/Cp at which the formula is applied.
Figure 7
Figure 7
Flow rates estimated by height/area (H/A) method of equation 7 using T = time when C(T)/Cp = 0.1 (see Fig. 5, lower left). The consistent underestimation of flow indicates that λ should be larger than 0.7. Regression equations are given in Table 1, symbols in Figure 1.
Figure 8
Figure 8
Comparison of flows estimated in the isolated heart preparation from antipyrine and xenon curves by four methods (see Table 2). The circled symbols indicate estimates from curves obtained by collimation on the apex. Each xenon curve was recorded 3 to 8 minutes after the antipyrine curve with which it was paired, at constant perfusion rate. Regression equations (Table 3) are given for FXe, the flows estimated from xenon curves, versus FAp, the flows estimated from antipyrine curves.
Figure 9
Figure 9
Flows estimated from curves recorded from the whole heart plotted against those from the apical curves, by the method of equation 7 (as in Figure 7, using T at C(T)/Cp = 0.1).

Similar articles

Cited by

References

    1. Herd JA, Hollenberg M, Thorburn GD, Kopald HH, Barger AC. Myocardial blood flow determined with krypton 85 in unanesthetized dogs. Am J Physiol. 1962;203:122. - PubMed
    1. Ross RS, Ueda K, Lichtlen PR, Rees JR. Measurement of myocardial blood flow in animals and man by selective injection of radioactive inert gas into the coronary arteries. Circulation Res. 1964;15:28. - PubMed
    1. Zierler KL. Equations for measuring blood flow by external monitoring of radioisotopes. Circulation Res. 1965;16:309. - PubMed
    1. Lassen NA, Klee A. Cerebral blood flow determined by saturation and desaturation with krypton85: An evaluation of the validity of the inert gas method of Kety and Schmidt. Circulation Res. 1965;16:26. - PubMed
    1. Kety SS. Measurement of regional circulation by the local clearance of radioactive sodium. Am Heart J. 1949;38:321. - PubMed