. 1966 Aug;19(2):332-46.
doi: 10.1161/01.res.19.2.332.

Plasma indicator dispersion in arteries of the human leg

Plasma indicator dispersion in arteries of the human leg

J B Bassingthwaighte. Circ Res. 1966 Aug.

Abstract

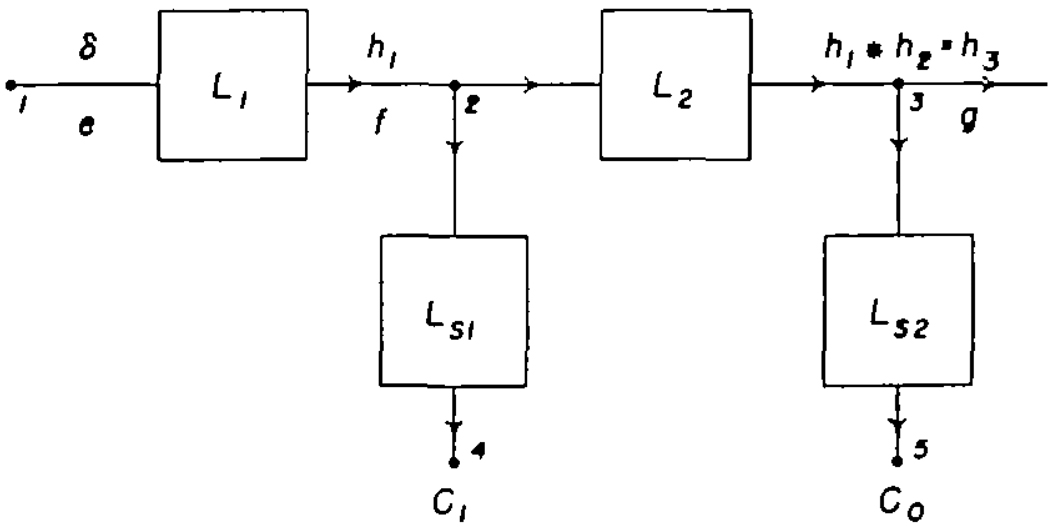
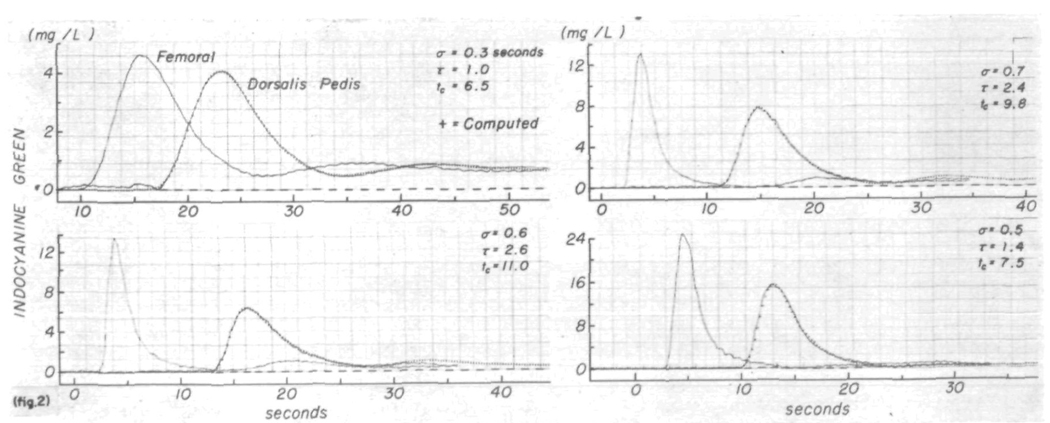
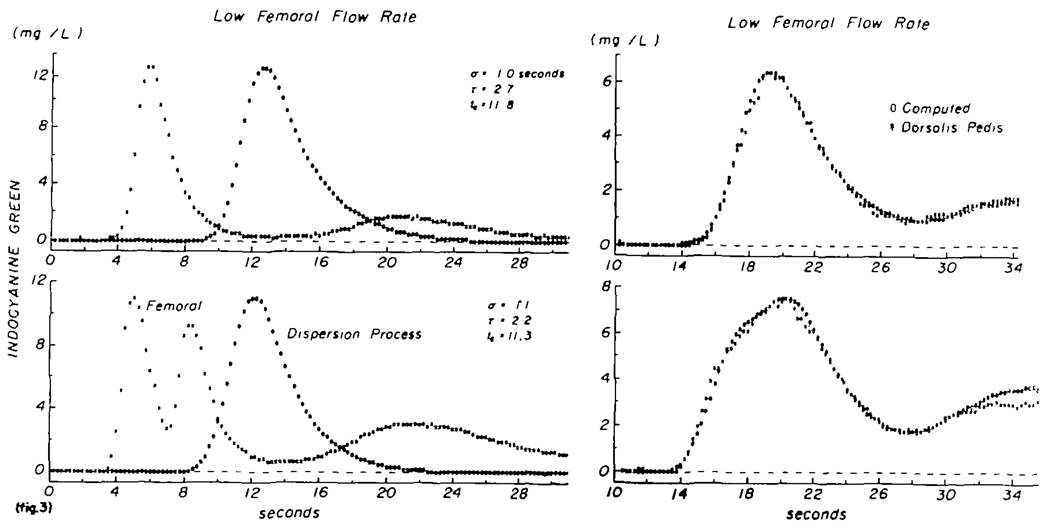
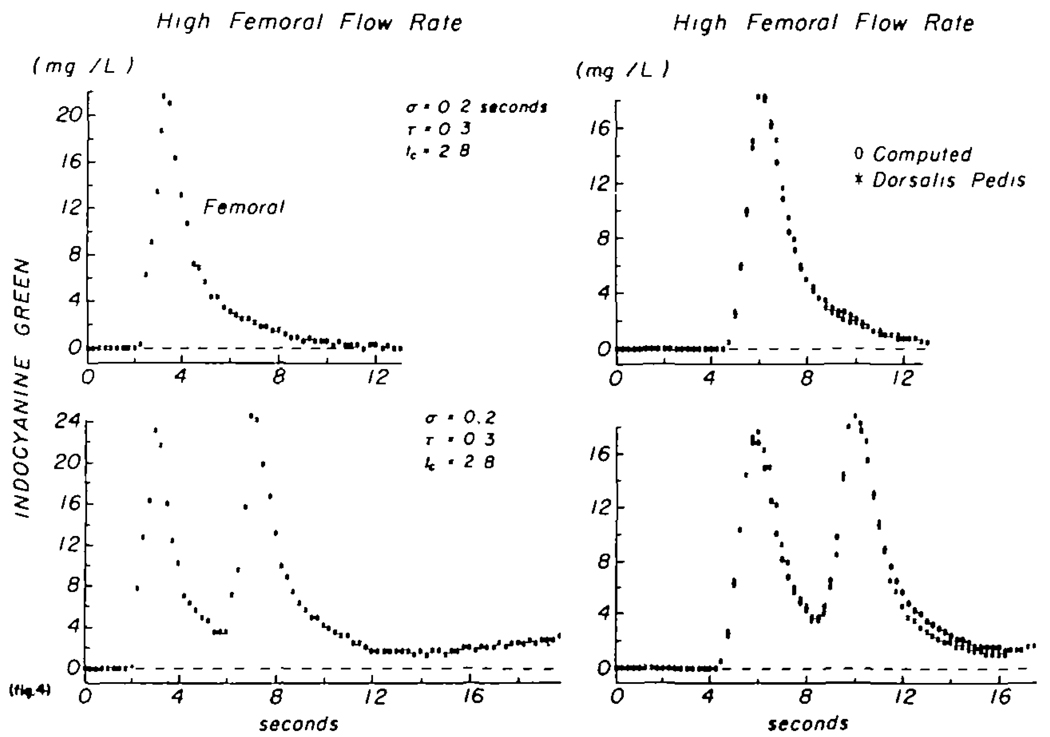
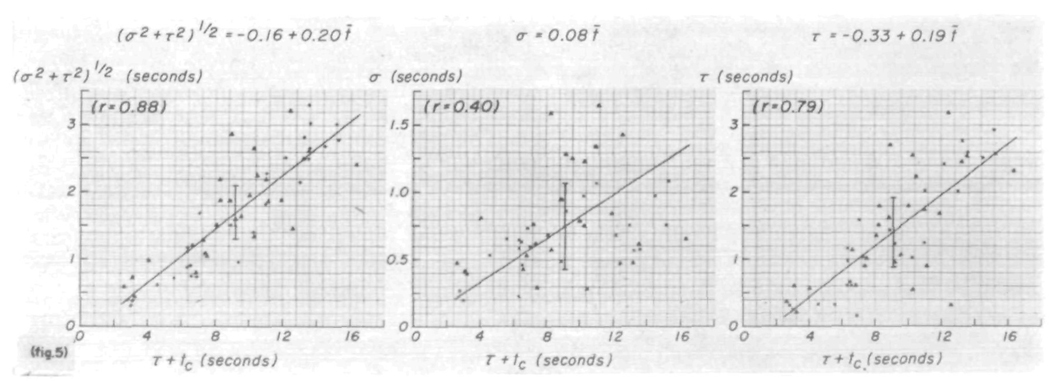
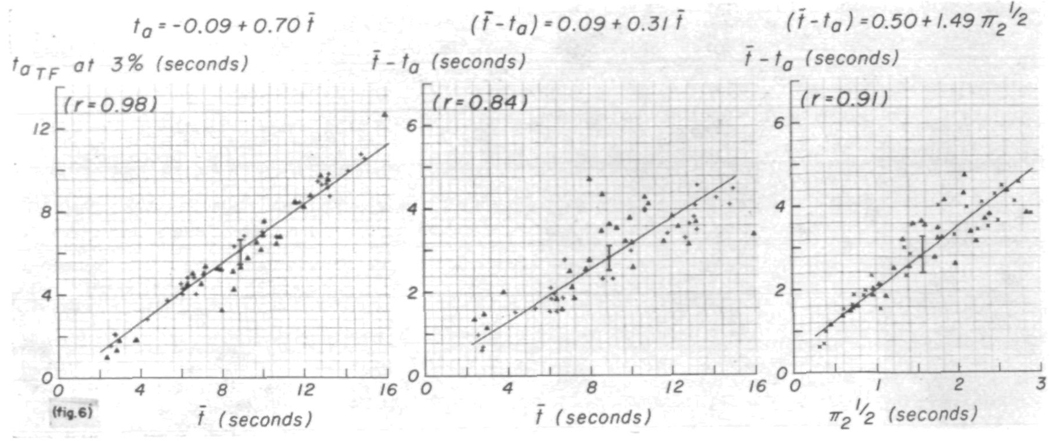
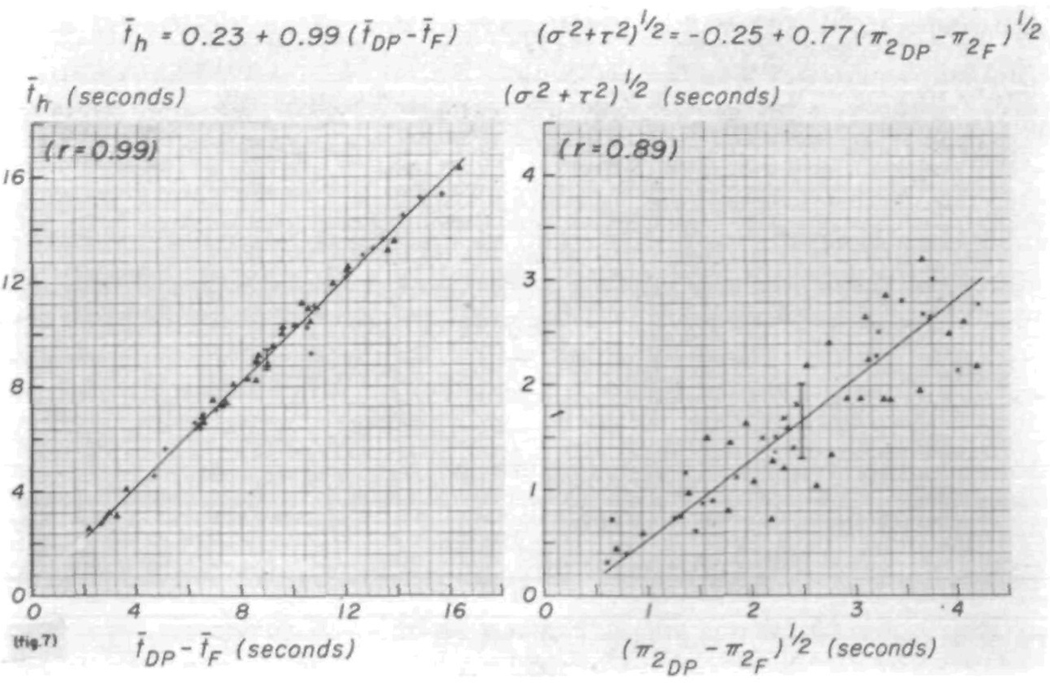
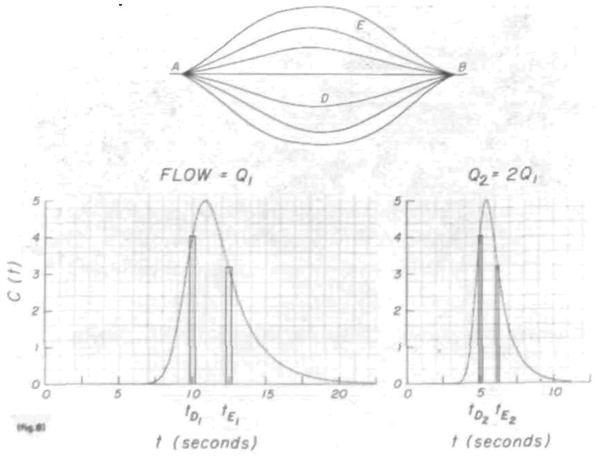
Indicator-dilution curves were recorded from the femoral and dorsalis pedis arteries of five normal men after injections of indocyanine green into the superior vena cava or thoracic aorta. By considering the femoral curves as inputs to a mathematically linear system and the dorsalis pedis curves as outputs, transfer functions (the distribution of transit times) for the arterial segment between these sites were obtained in terms of a four-parameter model, the lagged normal density curve, over a sixfold range of flow rates. The parameters of the spread (dispersion) of 57 transfer functions were proportional to the mean transit time. The mean difference between transit time and appearance time was 0.30 ; the square root of the variances was 0.18 . These linear relationships suggest that flow rate has no significant influence on dispersion and that, since no transition from laminar to turbulent flow was apparent, arterial flow characteristics were not significantly changed over a wide range of flow rates. The secondary implication is that the rate of spatial longitudinal spreading of indicator with distance traveled is primarily a function of the geometry of the arterial system, not of the rate of flow, and, therefore, that the spatial distribution at any instant is a function of this rate and of the distance traveled through the system.


Figures

FIGURE 1
FIGURE 1
Block diagram of the experimental situation. Point 1 (left) is the injection site, 2 is the tip of the femoral sampling system, 3 is the tip of the sampling system in the dorsalis pedis artery, and 4 and 5 are the recorded outputs of the densitometers of the femoral and dorsalis pedis sampling systems.
FIGURE 2
FIGURE 2
Use of a lagged normal density curve as the transfer function relating pairs of time-concentration curves. The pair of curves (continuous lines) in each panel were recorded simultaneously from the femoral and dorsalis pedis arteries. Femoral curves were convoluted with lagged normal density curves whose parameters, σ, τ, and tc are listed. Computed output curves (+ signs) closely approximate the recorded dorsalis pedis curves. Coefficients of variation between these computed and recorded output curves were 0.003, 0.007, 0.009, and 0.012. The average coefficient of variation for all the experiments was 0.007. Curves in the left upper panel, recorded after injection into the superior vena cava, illustrate one of the best results. Aortic injections were used to produce the other curves.
FIGURE 3
FIGURE 3
Test of constancy of the transfer function at normal femoral flow rate. Left panels: curves recorded from the femoral artery (asterisks) and the calculated transfer function (zeros) whose parameters are listed and whose amplitude was 1. Right panels: curves recorded at the dorsalis pedis artery (asterisks) and the computed output curve (zeros). Upper panels: single injection into the thoracic aorta. Lower panels: two single injections 3 sec apart. Mean transit time (τ + tc) after the single injection was 14.5 sec and after the double injection, 13.5 sec. This inconstancy was typical and prohibits the use of these curves as a test of linearity.
FIGURE 4
FIGURE 4
Test of the constancy of the transfer function at a high femoral flow rate (during infusion of adenosine triphosphate into the common iliac artery at a rate of 1.0 mg/min). The situation is similar to that of figure 3. Lower panels: two injections 4 sec apart. In this case the mean transit time remained constant at 3.1 sec and the transfer function was also the same despite the difference in form of the two curves, thereby suggesting that the arterial segment may be considered to behave as a linear system.
FIGURE 5
FIGURE 5
Parameters of the model simulating the transfer function. Left panel dispersion, as estimated by the square root of the variance of the transfer function, (σ2 + τ2)½, is linearly related to the mean transit time, τ + tc (which equals t̄), in a manner similar to that seen for the recorded curves. Middle and right panels: σ and τ of the transfer function exhibit very scattered, approximately linear relationships to τ + tc. Triangles denote data recorded following injection into superior vena cava; +’s or x’s denote injection into the aorta. Length of the vertical line at the average point is two standard deviations.
FIGURE 6
FIGURE 6
Dispersion of the transfer function. The relationships of ta and (t̄ — ta) to the mean transit time between the sampling sites are similar to those relating the corresponding parameters of the recorded curves, but the scatter is significantly greater. The positive Y-intercept in the relationship between (t̄ — ta) and π2½ suggests that the shape of the transfer function is slightly affected by the flow rate. Symbols as in figure 5; ta is defined as the time at which h(t) first exceeds 3% of its peak value.
FIGURE 7
FIGURE 7
Relationships between moments of the transfer function and moments of the recorded curves. The systematic deviation of the relationship between the variances, the second moments, is partly due to error in computing π2.
FIGURE 8
FIGURE 8
Diagrammatic representation of the effect of change of flow rate in a generalized flow system. When the rate is doubled, the dilution curve is halved in area and the transit time through any particular path, D or E, between A and B is also halved. In such a system the various measures of the breadth of concentration-time curves are linearly related to the mean transit time.

References

    1. Bassingthwaighte JB, Ackerman FH, Wood EH. Applications of the lagged normal density curve as a model for arterial dilution curves. Circulation Res. 1966;18:398. - PMC - PubMed
    1. Stephenson JL. Theory of the measurement of blood flow by the dilution of an indicator. Bull. Math. Biophys. 1948;10:117. - PubMed
    1. Visscher MB, Johnson JA. The Fick principle: Analysis of potential errors in its conventional application. J. Appl. Physiol. 1953;5:635. - PubMed
    1. Stow RW. Systematic errors in flow determinations by the Fick method. Minn. Med. 1954;37:30. - PubMed
    1. González-Fernández JM. Theory of the measurement of the dispersion of an indicator in indicator-dilution studies. Circulation Res. 1962;10:409. - PubMed