

Review
Progress in homotransplantation of the liver
- PMID: 5333482
- PMCID: PMC2975435
Item in Clipboard
Review
Progress in homotransplantation of the liver
Adv Surg.
1966.
No abstract available
Figures
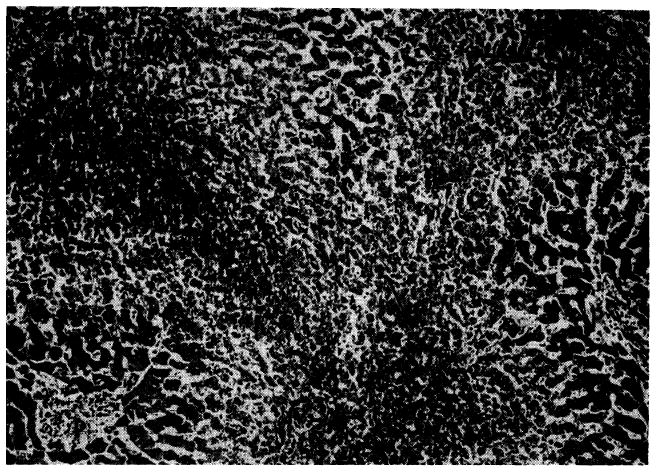
Outflow block in a canine hepatic homograft 4 days after transplantation. The centrilobular sinusoids (arrows) are distended with blood, and adjacent hepatocytes are necrotic. There is accumulation of fat in the liver cells of the middle lobular zone. Only hepatocytes adjacent to the portal tracts (P) are normal. Hematoxylin-eosin; ×40.
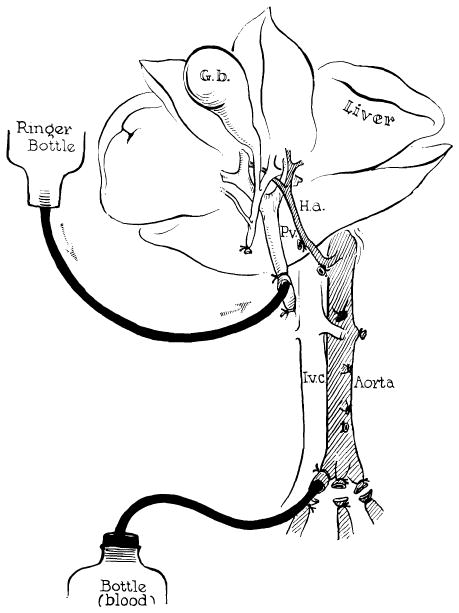
Method of further cooling a liver homograft just before its removal. Donor animals are operated on with total body hypothermia of 29–31°C. Cold lactated Ringer’s solution is infused through the portal vein at the same time the donor animal is exsanguinated. (Figs. 2, 3 and 17 from Starzl et al. [82].)
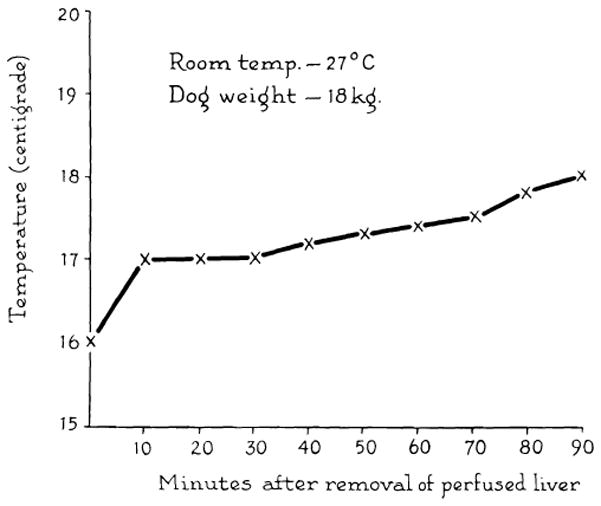
Rewarming curve of interior of donor liver exposed to room temperature for 1½ hr. Cooling was achieved by the method in Figure 2.
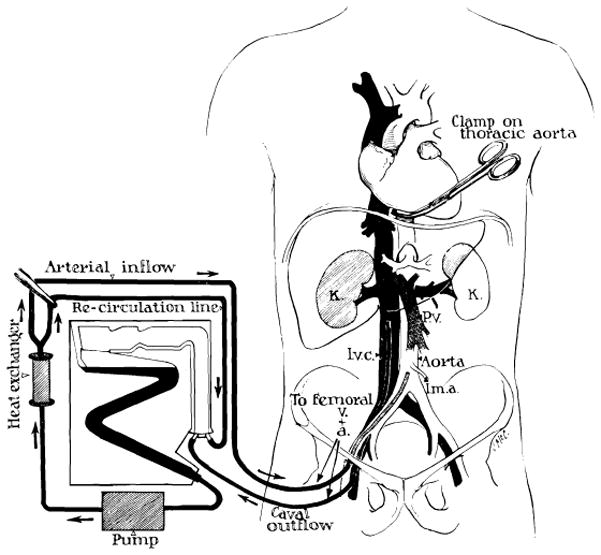
Technic of extracorporeal cadaver perfusion. Catheters are inserted via the femoral vessels into the aorta and vena cava as soon as possible after death. The extracorporeal circuit is primed with heparinized glucose or electrolyte solution to which procaine is added. The cadaver is anticoagulated with first surge of the pump. Temperature control is provided by the heat exchanger. (From Starzl [86].)
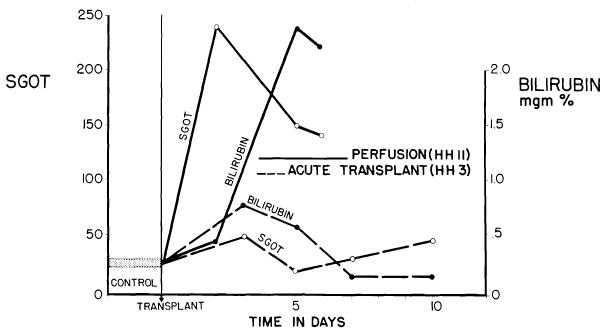
Acute liver injury after use of cadaveric canine homograft (solid lines). Note sharp increases of SGOT and bilirubin following orthotopic transplantation of cadaveric homograft (HH 11), which had a total ischemic interval of 2 hr., 17 min. Contrasting minor abnormalities after use of a living donor are shown (broken lines). (From Marchioro et al. [57].)
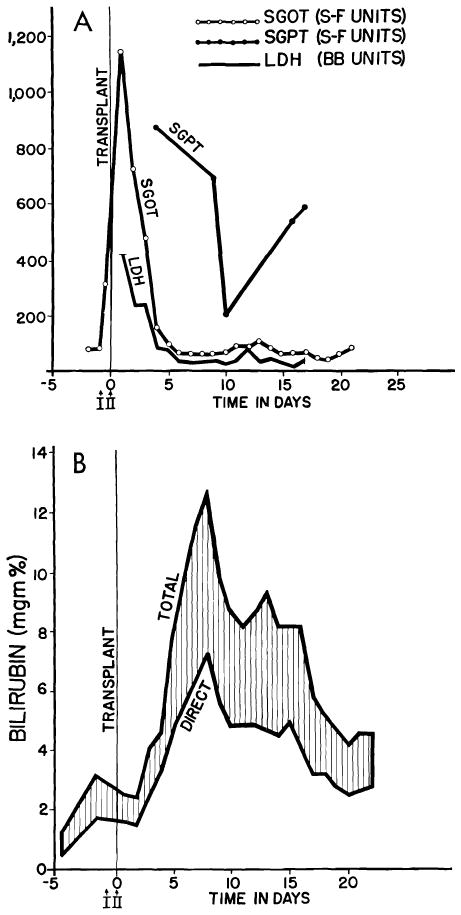
Serious injury to human liver homograft (Case 2, Colorado series). Time from donor death to revascularization in the recipient was 152 min. during 98 of which, extracorporeal perfusion was carried out. A, acute increases of serum enzyme values, which reversed in a few days. B, deepening jaundice in first 8 days. Both enzyme alterations and acute hyperbilirubinemia were probably due to ischemia rather than rejection. (Figs. 6, 41 and 42 from Starzl et al. [88].)
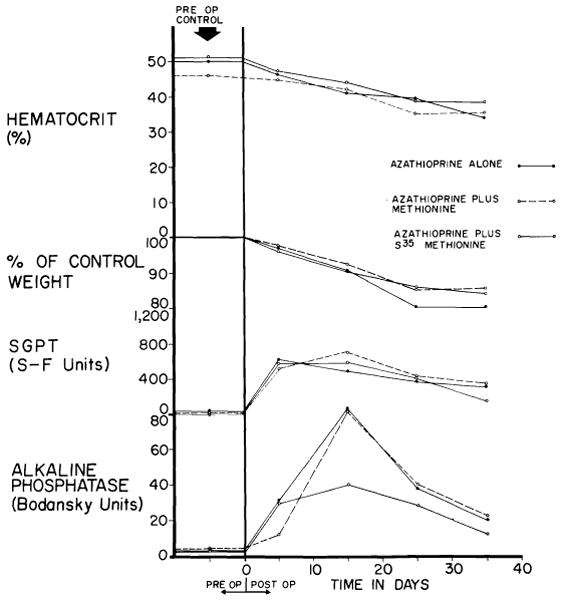
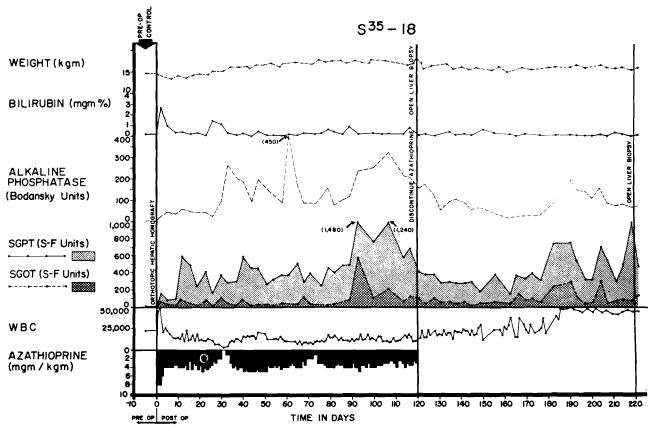
Toxicity of azathioprine when used alone, with S35 methionine and with methionine. Six dogs were in each of the 3 test groups. Despite abnormalities of liver function, jaundice did not develop. (Figs. 7, 8, 18, 23–28, 30, A, 33 and 36 from Starzl et al. [93].)
Liver of a dog given azathioprine for 26 days. There is necrosis of liver cells in center of the lobule. Hematoxylin-eosin; × 40.
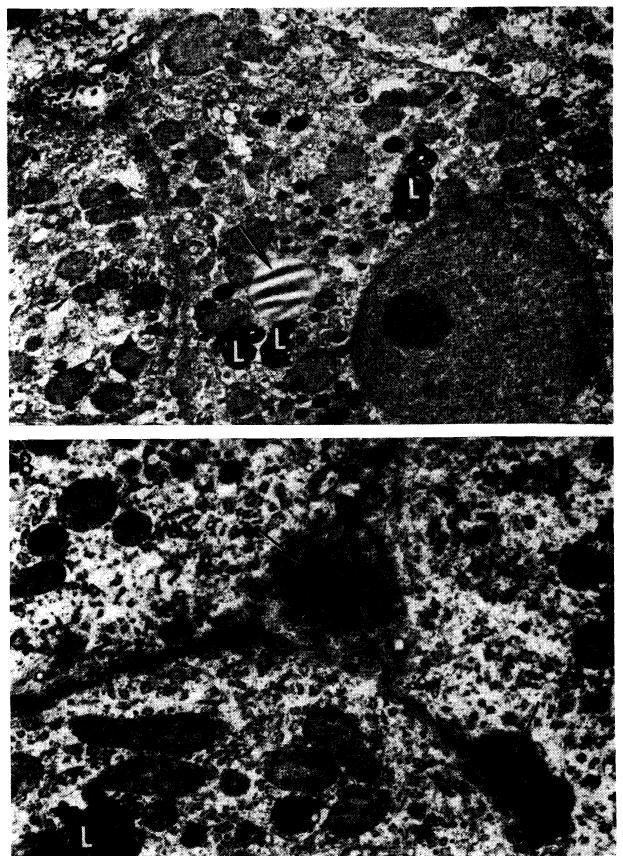
Ultrastructural changes caused by azathioprine in canine liver (from nontransplanted animals). A, after 40 days of azathioprine treatment. With light microscopy, there was pallor of centrilobular hepatocytes but no necrosis. This electron micrograph shows that cytoplasm lacks glycogen and the normal amount of rough endoplasmic reticulum, but contains an excess of lipofuscin (L) and lipid (arrow). Bile canaliculi are unaltered; ×2000. B, more severely damaged liver after azathioprine treatment for 40 days. Centrilobular hepatocyte necrosis was evident on light microscopy, similar to that in Figure 8. Two bile canaliculi (arrows) are blocked by inspissated bile. Microvilli in the larger of the canaliculi are scanty and short. Adjoining hepatocytes lack glycogen and normal amount of rough endoplasmic reticulum and contain excess lipofuscin (L). Electron micrograph; ×4000.
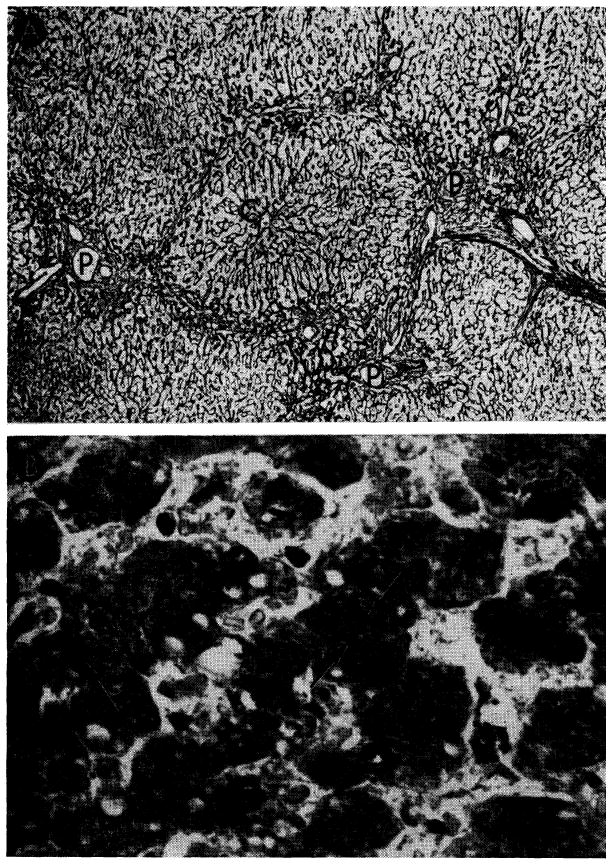
Hepatotoxicity of immunosuppressive agents in human recipients of renal homografts. A, liver from a patient who died 155 days after renal homograft. During the whole time she received azathioprine and prednisone. Reticulin is increased around the portal tracts (P), which are linked by bands of connective tissue. Central vein (C) is normal. Silver stain for reticulin; ×30. B, centrilobular cholestasis in liver from a patient who died 207 days after receiving a renal homograft; he had azathioprine throughout that period. Inspissated bile plugs the canaliculi (arrow). Hematoxylin-eosin; ×600.
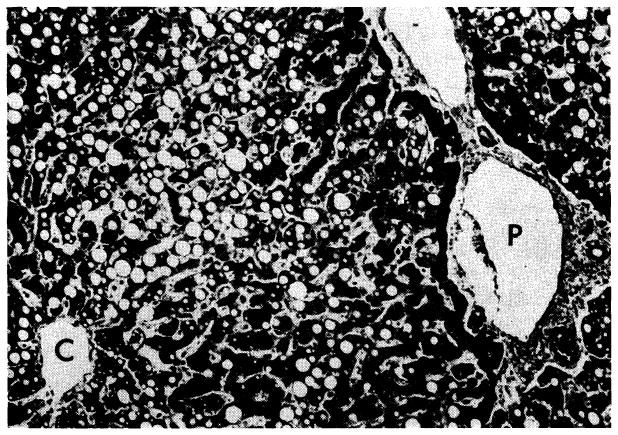
Widespread fat accumulation in liver of a patient who died 50 days after renal homotransplantation. He was treated throughout with azathioprine and prednisone. C, central vein; P, portal tract. Hematoxylin-eosin; × 100.
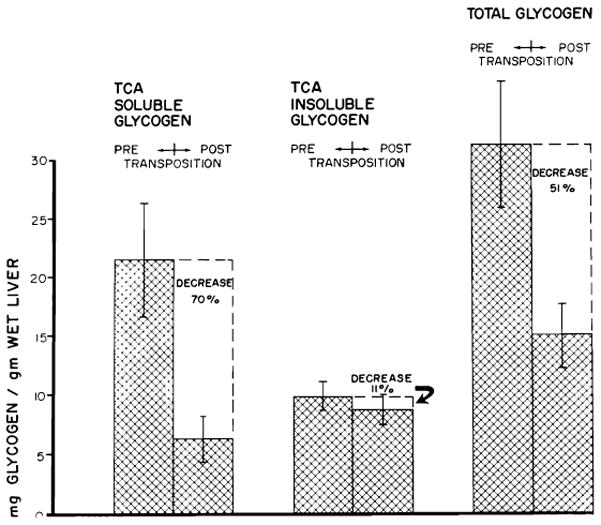
Mean changes in liver glycogen fractions of 17 dogs following transposition. Vertical lines represent ±1 SE. (Figs. 12–14 from Starzl et al. [92].)
Split liver preparation employed to test influence of splanchnic venous flow on liver morphology. Half of the liver receives splanchnic flow but the other half receives inflow from the inferior vena cava, making it analogous to a portacaval transposition. A, right half of the liver perfused with systemic venous blood. B, left half supplied by systemic venous blood. (From Marchioro et al [59].)
Result of experiment in Figure 13, B. The atrophic left portion the liver (52 Gm.) has been detached from the normal right fraction (234 Gm.). Specimen was obtained 73 days after operation.
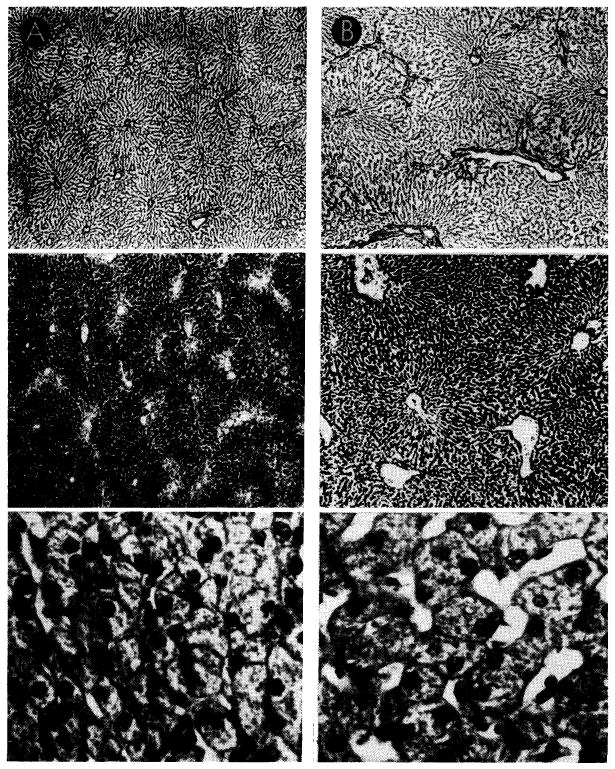
Canine liver, one-half perfused with blood from the inferior vena cava (A), the other half retaining normal portal venous supply (B). Top sections were impregnated with silver to show lobular reticulin framework; center sections, glycogen stained with periodic acid-Schiff reagent; bottom sections, hematoxylin-eosin. Magnifications are the same for the two sides. Liver which received vena caval blood (A) shows shrinkage of liver lobules, depletion of centrilobular glycogen and atrophy of hepatocytes when compared to the part which received portal blood (B).
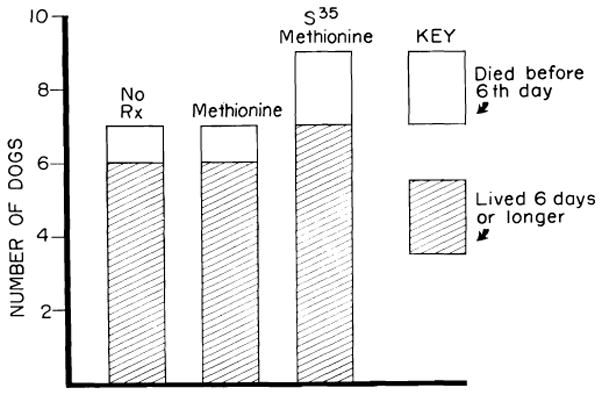
Results of orthotopic transplantation in dogs not receiving immunosuppressive therapy. Seven of the animals received no treatment; 7 had methionine, intravenously each day; 9 received radioactive methionine. Neither methionine nor its isotope potentiated homograft survival. Mean survival of the 22 dogs which survived operation was 7.1 days.
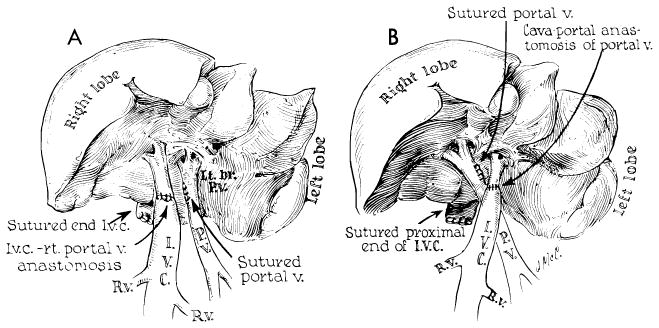
Method for decompression of inferior vena caval and splanchnic systems during removal of recipient liver and replacement with a homograft. Note that a preliminary portacaval shunt has been placed. By means of this temporary anastomosis, the two venous systems are connected, allowing their decompression with a single external by-pass.
Reconstruction after orthotopic liver homotransplantation in the dog. Internal biliary drainage is with a cholecystoduodenostomy. Aorta is transplanted in continuity with the hepatic artery of the homograft.
Biochemical changes after orthotopic liver transplantation to the untreated recipient. A brief period of good function follows operation, but deterioration of the biochemical pattern is unrelenting once it has begun.
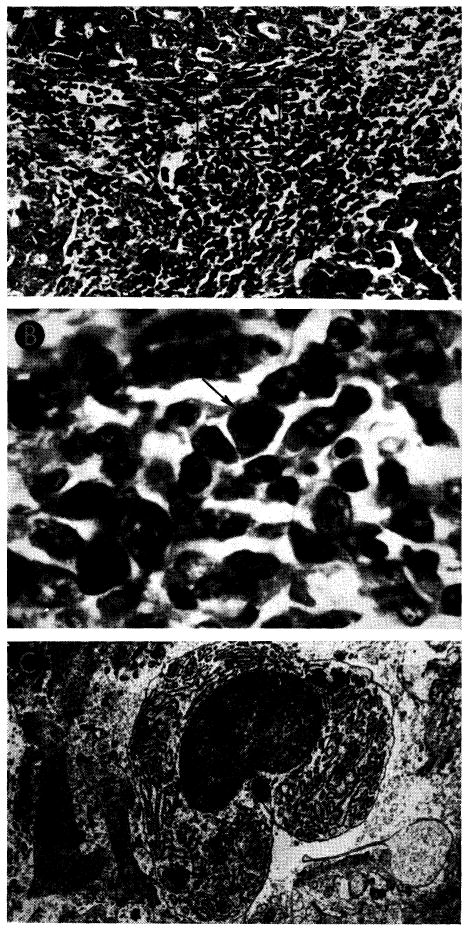
Untreated canine hepatic homograft at 6 days. Portal veins (P) and central veins (arrow) are surrounded by dense cellular infiltration. There is centrilobular necrosis with hemorrhage. Cytoplasm of surviving hepatocytes in the middle and peripheral zones of the lobules contains abundant lipid. Hematoxylin-eosin; ×30.
Vascular changes in homografts of untreated recipients. A, portal tract of untreated canine hepatic homograft shown in Figure 20. Portal vein is surrounded by mononuclear cells, some of which can be seen in the vessel wall. Hepatic artery is unaffected. Hematoxylin-eosin; ×500. B, central vein, surrounded by mononuclear cells, from untreated canine homograft shown in Figures 9 and 10. Some cells are adhering to the endothelium and others are infiltrating the vein wall. Hematoxylin-eosin; ×500. C, focus of fibrinoid necrosis (arrows) in wall of a small branch of the hepatic artery in a canine liver 7 days after homotransplantation. Hematoxylin-eosin; ×500.
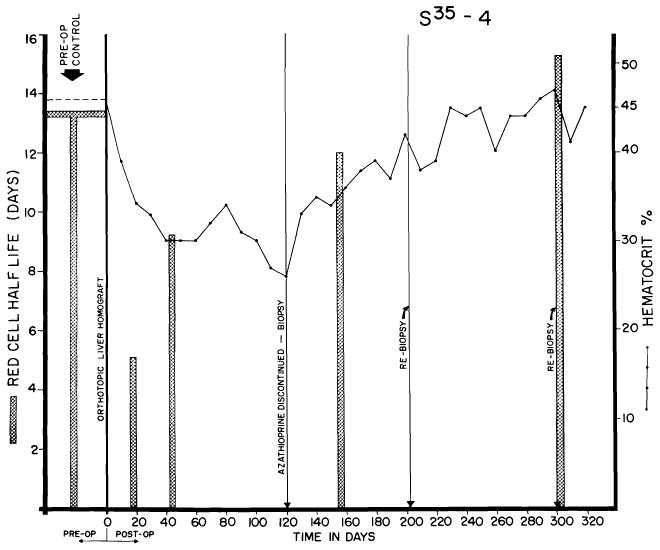
Survival after 116 orthotopic homotransplantation experiments in dogs. Mortality in the 1st week was 27.5%, almost always the result of acute pulmonary sepsis. Animals living longer than 1 week had a better than 50% chance of living 25 days or more and about a 30% chance of living 50 days or more. Maximal survival has been 11½ months.
Red cell survival and hematocrits in dog alive 344 days after orthotopic transplantation. Note sharp reduction of red cell half-life in 1st postoperative month, with gradual return toward normal. Red cell survival was not altered by withdrawal of azathioprine at end of 4 months, but the depressed hematocrit rose sharply in succeeding months.
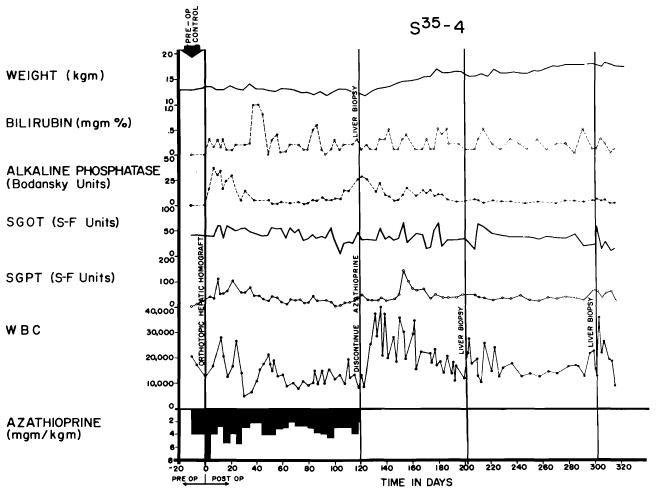
Course of an animal which never had any clinically evident homograft rejection. Note rapid weight gain following cessation of therapy at 4 months. The pronounced leukocytosis after withdrawal of immunosuppression was commonly seen. This animal, given adjuvant therapy with S35 methionine, was still alive after 344 days.
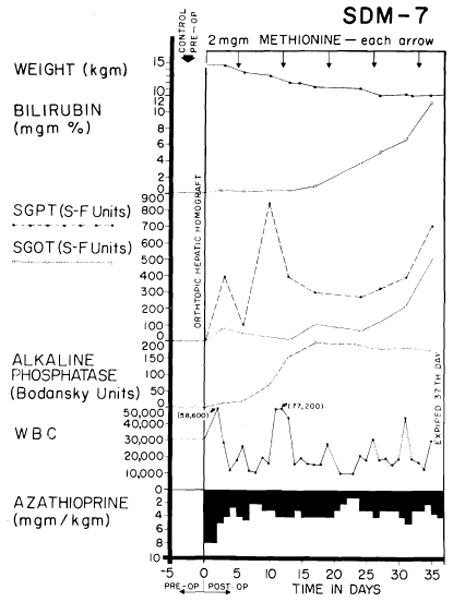
Example of inexorable rejection despite immunosuppressive therapy. Serum bilirubin was the most useful measurement for following the course after homotransplantation, since the other abnormalities of liver function depicted can also be caused by azathioprine.
Virtually complete reversal of severe hepatic rejection. Note severe jaundice, which ultimately disappeared. The animal was still alive at time of writing. Reversal was accomplished without alteration of immunosuppressive therapy. The animal received adjuvant S35 methionine, methionine and choline.
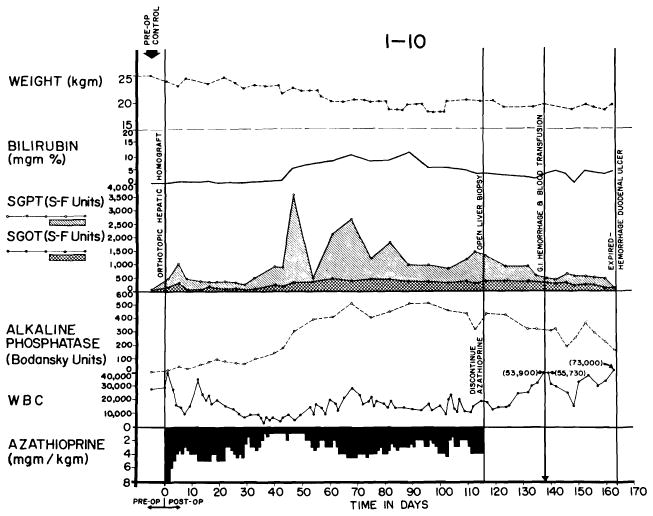
Reversal of rejection in an animal treated with azathioprine. Serum bilirubin rose to more than 10 mg., then declined. Improvement of liver function continued after discontinuance of azathioprine therapy at 116 days. Death 45 days later was due to massive hemorrhage from a large duodenal ulcer.
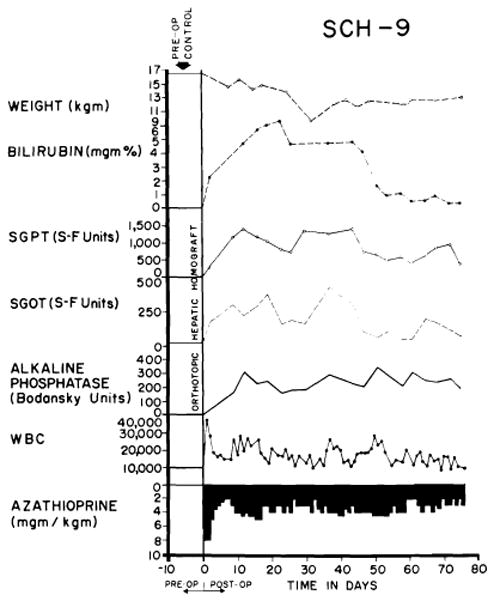
Course of an animal which had no clinically evident rejection during the first 4 months. After azathioprine was discontinued, liver function deteriorated, though the animal appeared healthy and had little weight loss. The late rejection partially reversed without reinstitution of therapy.
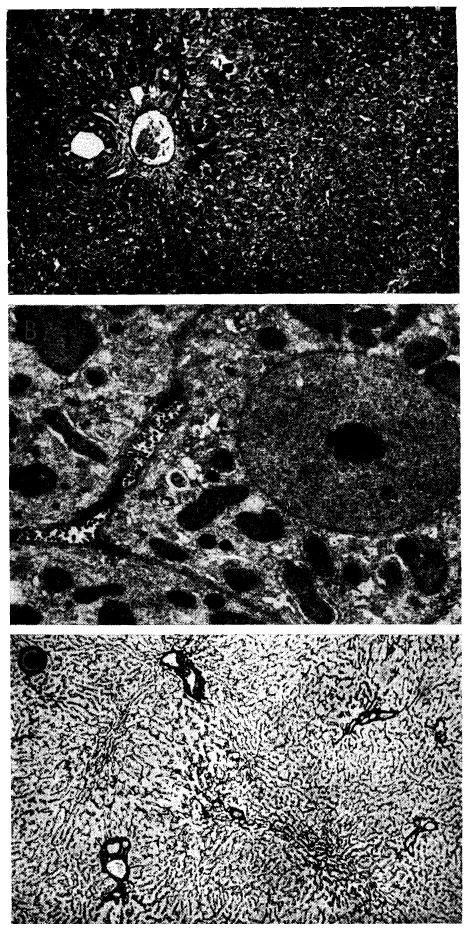
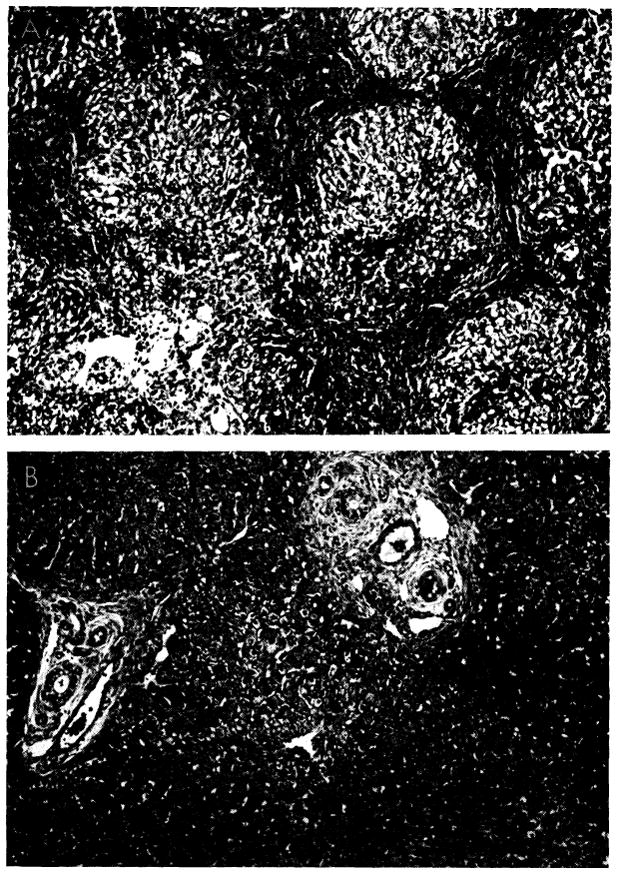
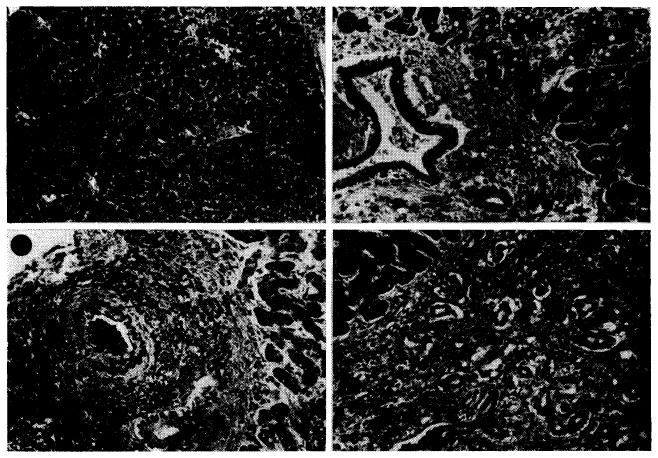
Liver homograft rejection in animals treated with azathioprine. In dogs that died 1–2 weeks after operation, pathologic changes are similar to those with homotransplantation to the unmodified recipient, differing only in that the sequence of destruction is delayed. A, treated canine hepatic homograft, undergoing rejection at 7 days. Portal tract is heavily infiltrated by mononuclear cells. Outlined rectangular area is shown in greater detail in B. Hematoxylin-eosin; ×250. B, details of cellular infiltration in portal tract of hepatic homograft in A. Many of the cells are large blast cells with several nucleoli and pyronin-positive cytoplasm; one is in mitosis (arrow). Hematoxylin-eosin; ×600. C, treated hepatic homograft at 8 days. A plasma cell with abundant rough endoplasmic reticulum in its cytoplasm is seen in a portal tract. Electron micrograph; × 2,400.
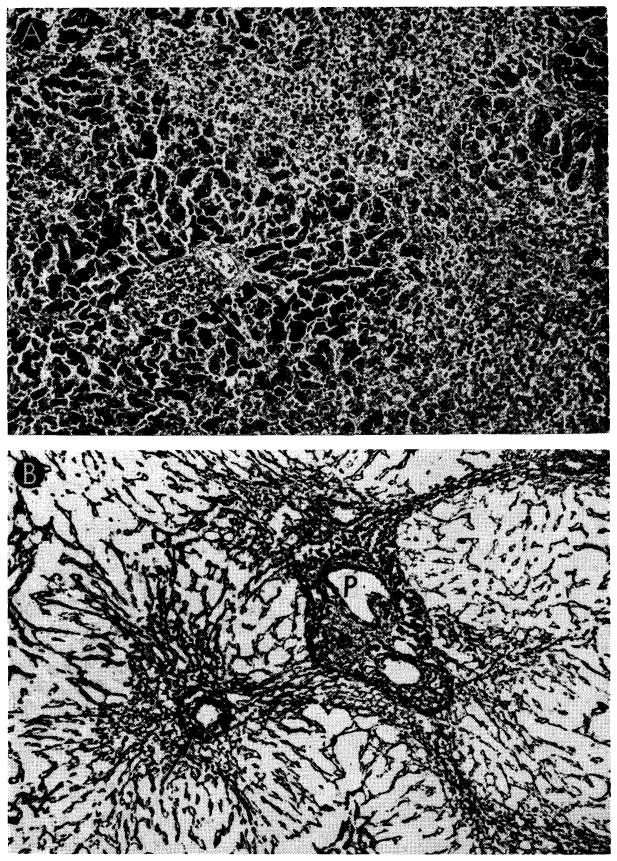
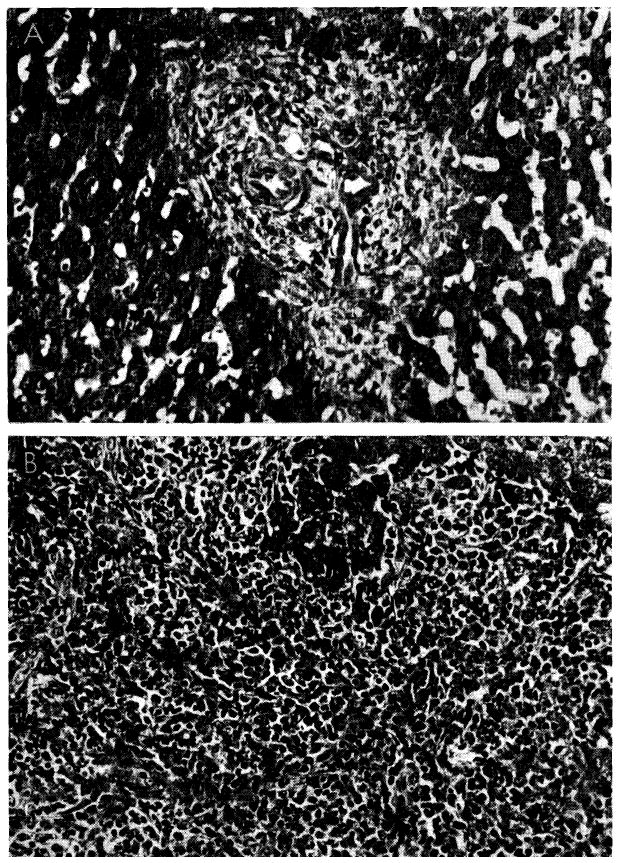
Unsuccessful control of rejection after orthotopic liver transplantation. A, hepatic homograft rejected in 15 days despite azathioprine treatment. There is widespread destruction of hepatocytes in central and middle zones of the lobules. Only a rim of liver cells remains around the small portal tract (arrow), which is heavily infiltrated by mononuclear cells. Hematoxylin-eosin; ×40. B, early distortion of architecture resulting from canine liver rejection in the modified host. These changes determine the pattern of healing in animals which survive this critical period. Centrilobular loss of hepatocytes has been followed by collapse and condensation of reticulin around the central vein (arrow). P, portal tract. Reticulin stain; ×40.
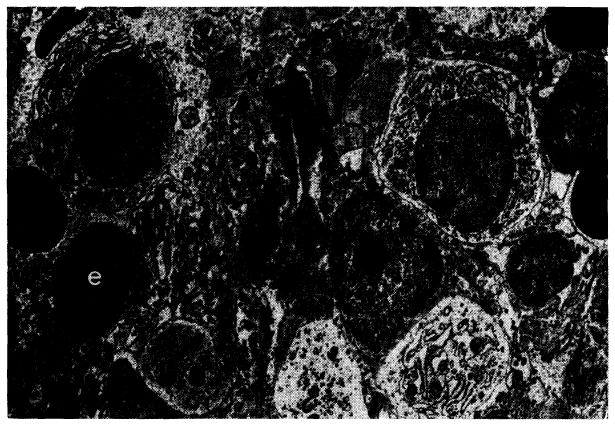
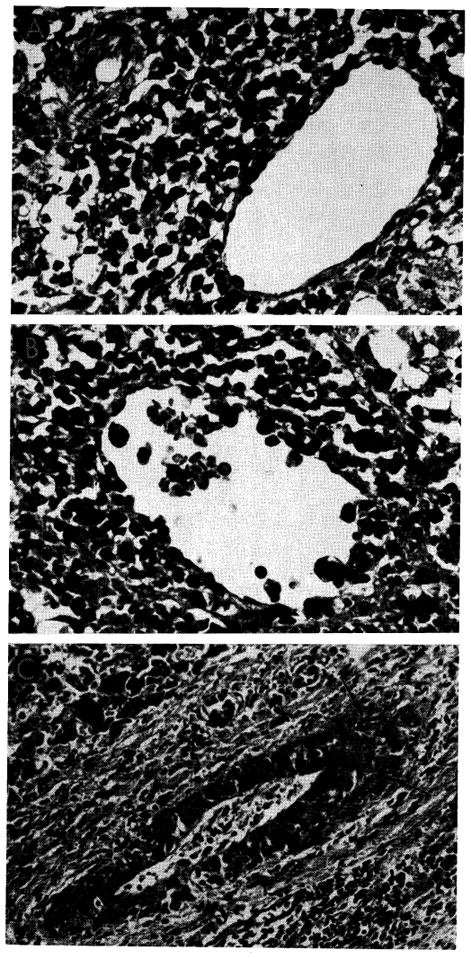
Treated canine hepatic homograft at 25 days. Plasma cells (p), small lymphocytes (ly) and erythrocytes (e) are present in portal tract. Primitive “large lymphoid” cells are not present. Electron micrograph; × 1,600.
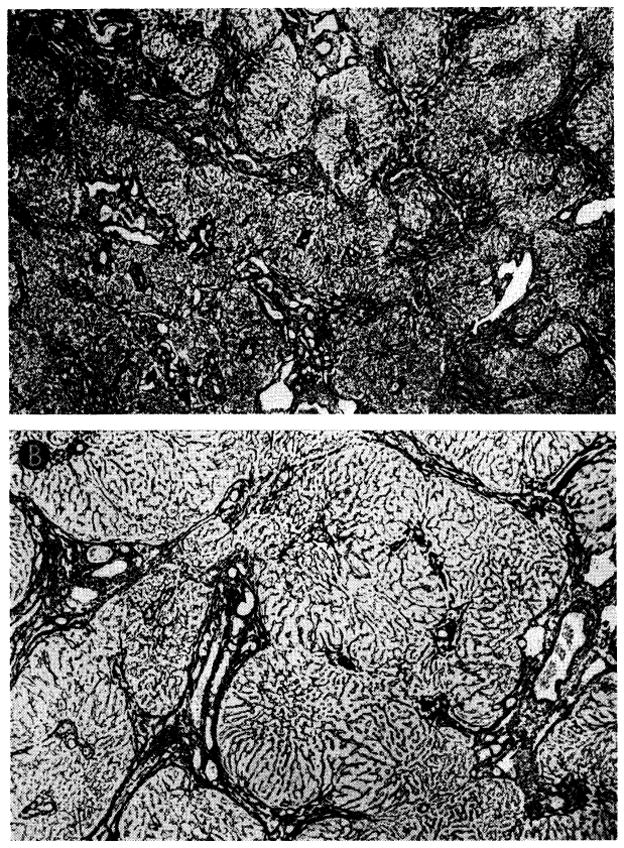
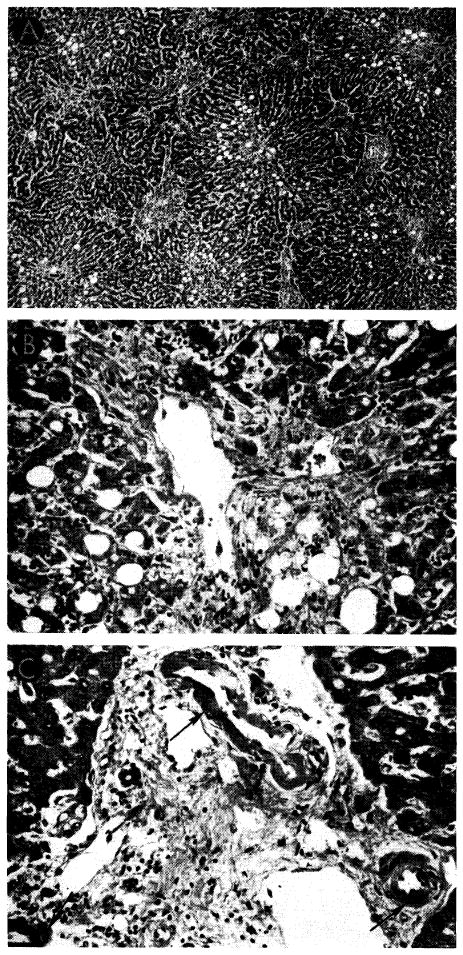
Tissues from the longest surviving orthotopic canine liver homograft. This animal had normal liver function almost 1 year after operation. A, biopsy at 120 days. There is evidence of regeneration of hepatocytes at the periphery of the lobule, but no other abnormality. Hematoxylin-eosin; ×40. B, biopsy 82 days after all immunosuppressive drugs had been stopped. The homograft appears normal. Electron micrograph; ×1,600. C, biopsy 182 days after all immunosuppressive drugs had been withdrawn and 302 days after transplantation. The lobular reticulin pattern appears normal. Reticulin stain; × 30.
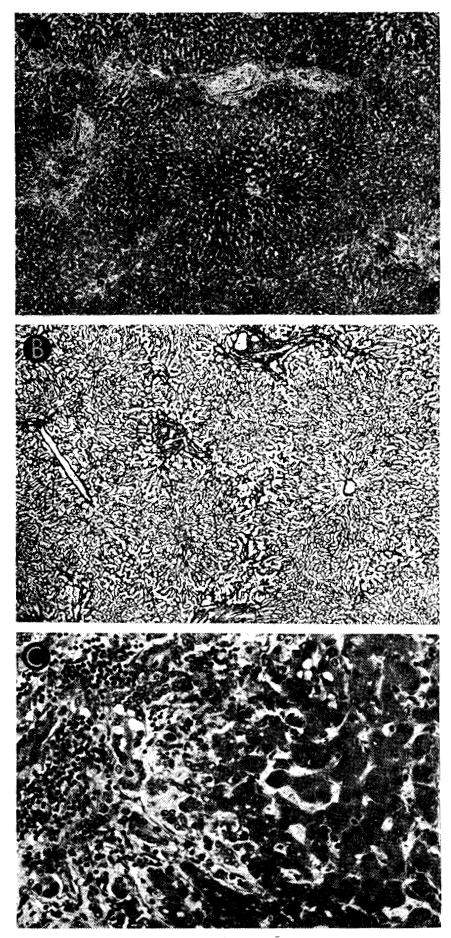
Improvement of histologic appearance of an orthotopic liver homograft after discontinuance of azathioprine therapy. The animal was in excellent health 238 days after operation. A, biopsy at 121 days. The lobular architecture is distorted by thick bands of connective tissue. Hepatocytes in pseudolobules of regenerating liver contain much lipid. B, all therapy was stopped after 121 days, and this specimen was obtained 77 days later. Fibrosis is less conspicuous and hepatocytes now appear normal. Hematoxylin-eosin; × 40.
Changes in reticulin network in biopsies shown in Figure 33. A, at 121 days, thick bands of reticulin link portal tracts to each other and to central veins, destroying normal lobular pattern. Reticulin stain; ×20. B, 77 days later, reticulin bands seem less coarse and not so frequent. Reticulin stain; × 30.
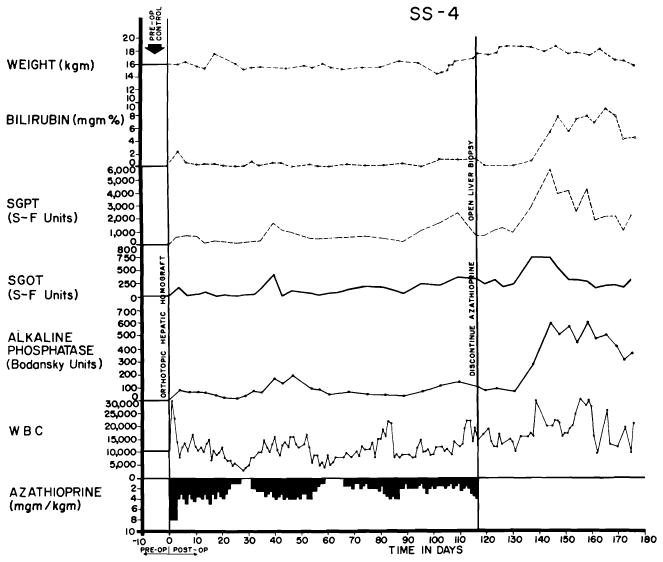
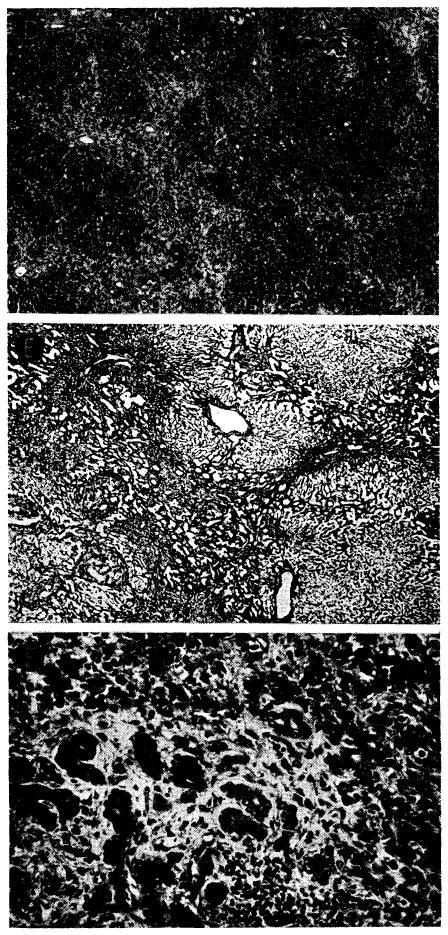
Course of dog in good health 248 days after orthotopic liver transplantation. Jaundice was never present, although there were chronic elevations of SGOT, SGPT and alkaline phosphatase values. Azathioprine was stopped at 123 days. Biopsies from this animal are shown in Figure 36.
Biopsies from animal whose clinical course is shown in Figure 35. A, at 123 days there are some increase of portal connective tissue, proliferation of small biliary ductules and slight cellular infiltration. B, 84 days after cessation of immunosuppressive treatment, there has been marked deterioration. Portal tract is heavily infiltrated by a mixture of mononuclears and neutrophils. Hematoxylin-eosin; ×300.
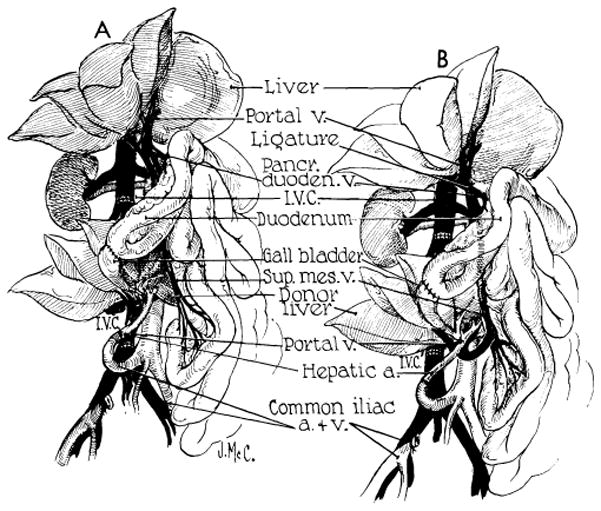
Auxiliary liver transplantation. A, method of Welch. Note that portal venous inflow is from the inferior vena cava. The homograft undergoes rapid atrophy. B, modification of Welch method in which nonhepatic splanchnic flow is diverted through the homograft. With this preparation, the homograft retains its size and the animal’s own liver shrinks. It is usually more convenient to bring the hepatic artery behind rather than in front of the portal vein as depicted. (Figs. 37, 39 and 40 from Marchioro et al. [58].)
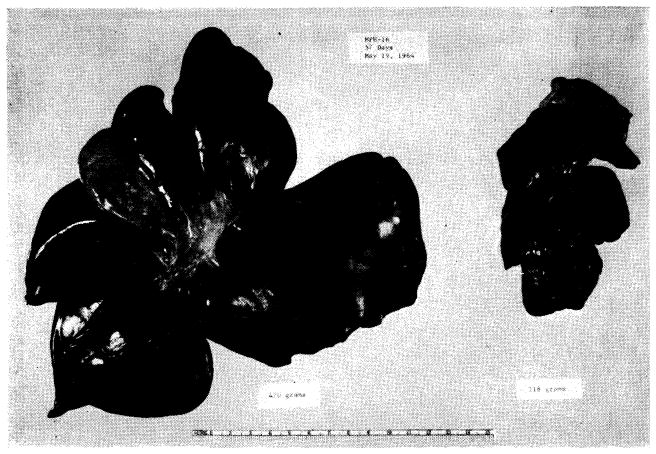
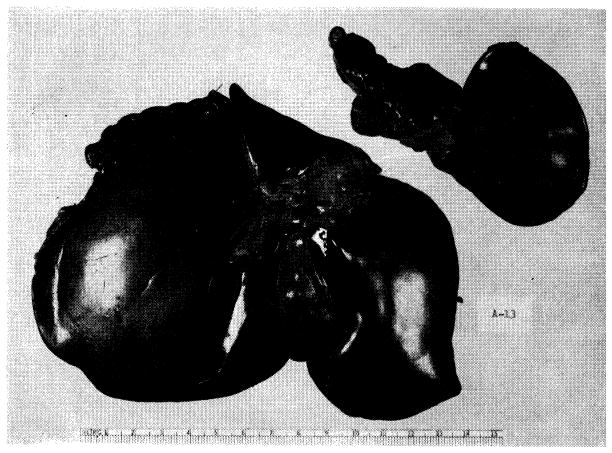
Results with auxiliary liver transplantation when revascularized by Welch method (Fig. 37, A). Note marked atrophy of the homograft (right) and no change in the animal’s own liver (left). General morphology of the homotransplant is quite recognizable. The two specimens were obtained 45 days after auxiliary transplantation.
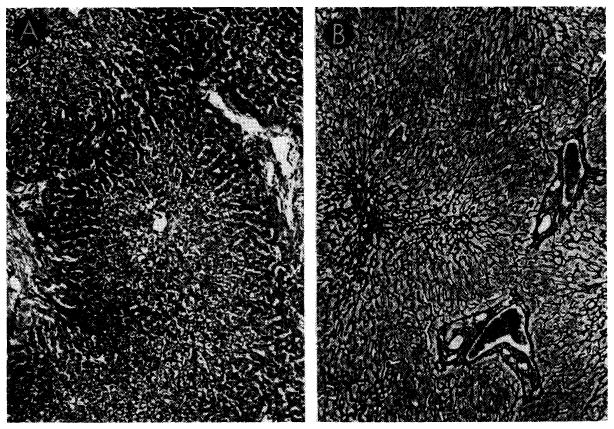
Biopsies of their own livers from two dogs revascularized as shown in Figure 37, B. A, 35 days after operation, there is centrizonal necrosis of the liver cells. Hematoxylin-eosin; orig mag. ×30. B, 51 days after operation, centrilobular reticulin has collapsed. Reticulin stain; orig. mag. ×45.
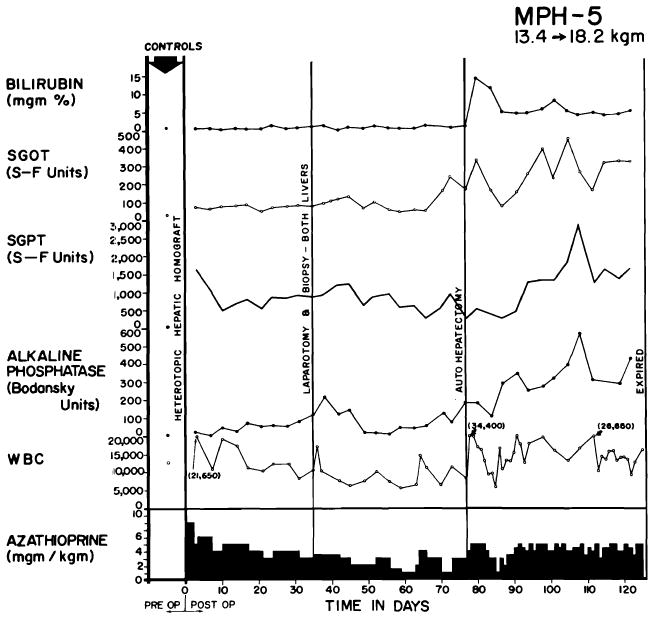
Clinical course of a dog whose homograft was vascularized by method shown in Figure 37, B. Note abrupt bilirubinemia which followed removal of the dog’s own liver (autohepatectomy). The dog lived for 49 days with sole dependence on the homograft, ultimately dying of wound dehiscence and evisceration which followed repeat biopsy.
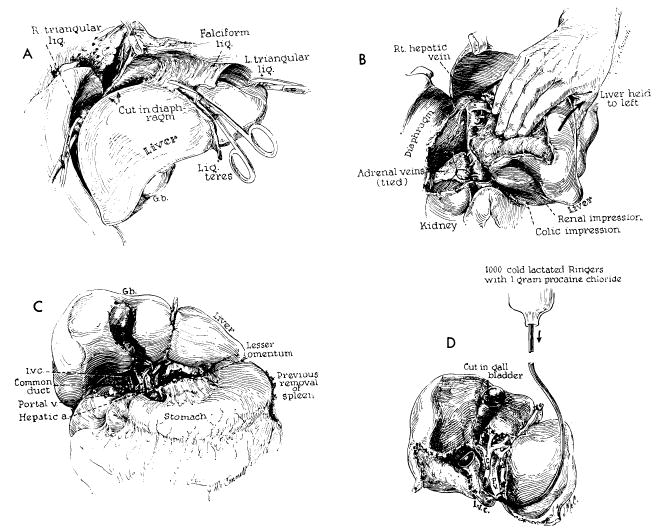
Technical steps in removal of cadaveric homograft. All maneuvers except D are also carried out in excising the recipient patient’s own diseased liver. A, incision of restraining ligaments of liver. B, dissection of raw area and ligation of adrenal veins. C, completed dissection of gastrohepatic ligament. D, cold perfusion of excised homograft. Note that gallbladder is opened. Failure to remove bile may result in autolysis of the extrahepatic biliary system during period of devascularization.
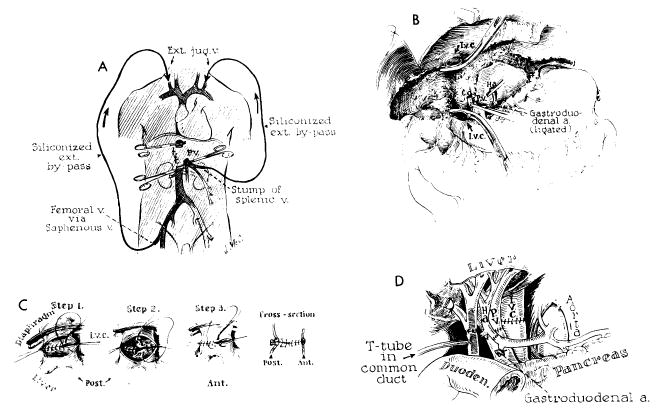
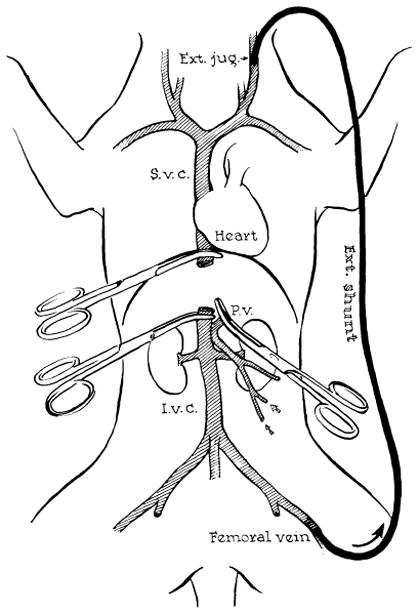
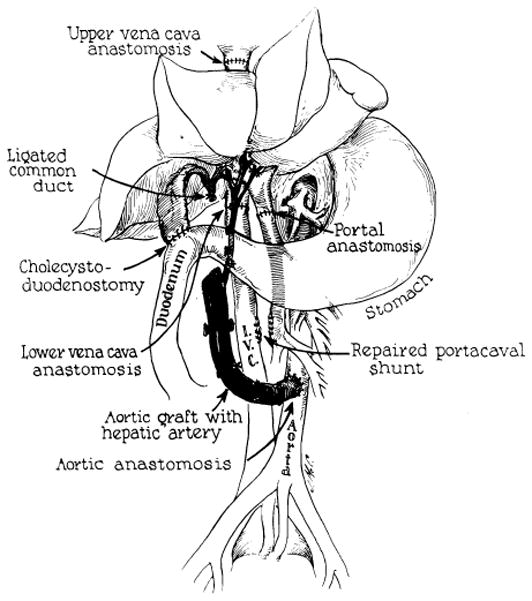
Technical steps in human homotransplantation. A, external bypass systems used for decompression of blocked venous pools. External shunt from the portal system was shown to be unnecessary and only vena caval bypass is required. B, operative field after removal of recipient’s diseased liver. C, anastomosis of suprahepatic vena cava. Great care must be exercised to prevent suture-line leakage, because exposure of this suture line is difficult after homograft is in place. D, completed anastomoses of portal structures. Note that T-tube is placed through a stab wound in recipient portion of reconstructed common duct. An alternative method of internal biliary drainage is with cholecystoenterostomy.
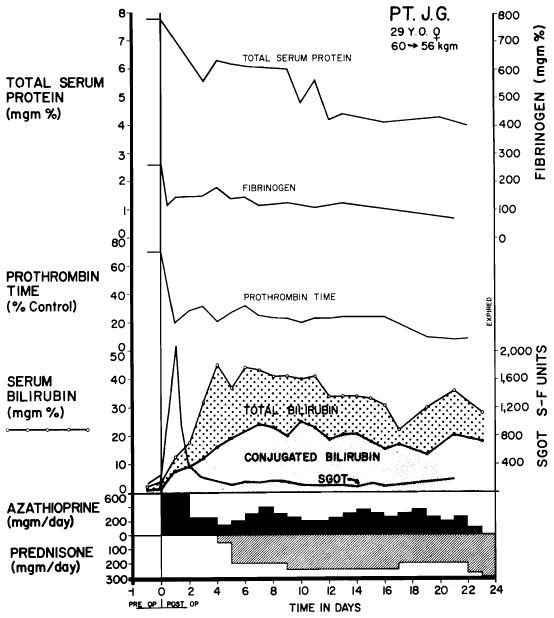
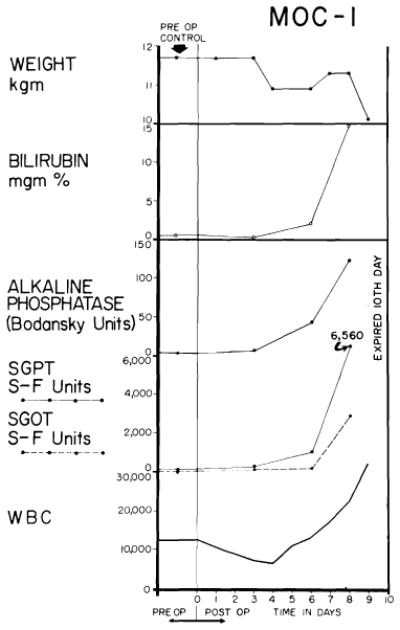
Serial chemical studies in Patient 5 of Colorado series. Note serious abnormalities of various measurements. SGOT increase immediately after operation was the highest observed in any case. Immunosuppressive therapy is depicted at the bottom. (Figs. 43, 44 and 49 from Starzl et al. [91].)
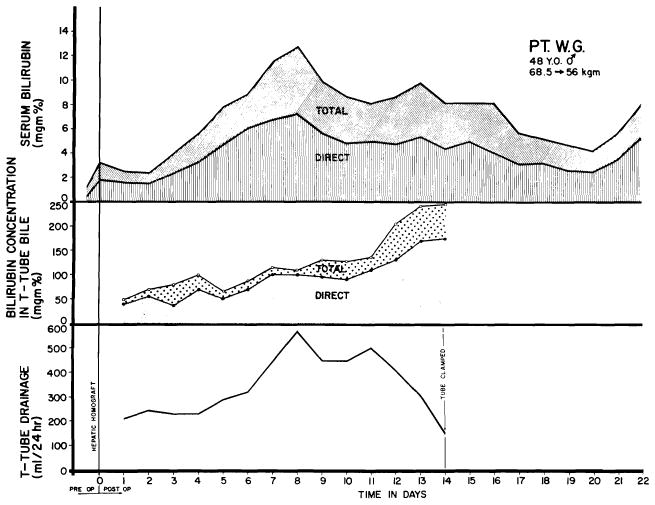
Course of Patient 2 of Colorado series, showing relationships of serum bilirubin, T-tube drainage volume and bilirubin content of T-tube bile. Note temporary worsening of jaundice after transplantation, probably due to ischemic injury rather than rejection.
Case 4 of Colorado series; treated human orthotopic hepatic homograft at 6½ days. A, lobular pattern is normal but hepatocytes contain fine fat droplets. Hematoxylin-eosin; ×15. B, portal tract is filtrated by a few cells, most of them lymphocytes. Many of the hepatocytes contain lipid droplets in their cytoplasm. Hematoxylin-eosin; ×150. C, small branch of the hepatic artery shows thickening of its intima. Weigert stain for elastic tissue counterstained with van Gieson’s; ×100. D, a small portal tract is heavily infiltrated by mononuclear cells and contains many proliferating bile ducts. Hematoxylin-eosin; ×150.
Case 3 of Colorado series: treated human orthotopic hepatic homograft at 7½ days. A, cytoplasm of centrizonal and midzonal hepatocytes contains large droplets of fat. Portal tracts are conspicuous because of some bile duct proliferation and cellular infiltration. Hematoxylin-eosin; ×20. B, hepatocytes immediately adjacent to the vein have disappeared and those just peripheral to this area are atrophic and contain fat droplets in their cytoplasm. Cellular infiltration around the hepatic vein is slight. Hematoxylin-eosin; ×250. C, three small branches of hepatic artery (arrows) show fibrinoid necrosis of their walls. Connective tissue contains a few infiltrating mononuclear cells. Hematoxylin-eosin; ×250.
Case 2 of Colorado series: treated human orthotopic hepatic homograft at 22 days. A, B and C show typical appearance of the tissue; D–F show most severely damaged porting, these necrotic areas being focal and uncommon. A, centers of lobules appear dark because the hepatocytes contain excess lipofuscin. Increase of portal connective tissue was probably present before homotransplantation. There is patchy cellular infiltration, particularly in smaller portal tracts. Hematoxylin-eosin; ×20. B, lobular architecture is essentially normal. Reticulin stain; ×20. C, portal tract is infiltrated by mononuclear cells. There is proliferation of small bile ducts. Hematoxylin-eosin; ×250. D, area in which whole lobules have undergone necrosis, being replaced by collagen and reticulin fibers, many small bile ducts and foci of infiltrating mononuclear cells. Hematoxylin-eosin; ×20. E, area of massive necrosis. Reticulin has collapsed, destroying normal lobular pattern. Reticulin stain; ×20. F, massive necrosis has occurred and hepatocytes are now replaced by collagen and reticulin fibers, proliferating bile ducts and foci of infiltrating mononuclear cells. Hematoxylin-eosin; ×250.
Case 2 of Colorado series: treated human orthotopic hepatic homograft at 22 days. A, B and C show typical appearance of the tissue; D–F show most severely damaged porting, these necrotic areas being focal and uncommon. A, centers of lobules appear dark because the hepatocytes contain excess lipofuscin. Increase of portal connective tissue was probably present before homotransplantation. There is patchy cellular infiltration, particularly in smaller portal tracts. Hematoxylin-eosin; ×20. B, lobular architecture is essentially normal. Reticulin stain; ×20. C, portal tract is infiltrated by mononuclear cells. There is proliferation of small bile ducts. Hematoxylin-eosin; ×250. D, area in which whole lobules have undergone necrosis, being replaced by collagen and reticulin fibers, many small bile ducts and foci of infiltrating mononuclear cells. Hematoxylin-eosin; ×20. E, area of massive necrosis. Reticulin has collapsed, destroying normal lobular pattern. Reticulin stain; ×20. F, massive necrosis has occurred and hepatocytes are now replaced by collagen and reticulin fibers, proliferating bile ducts and foci of infiltrating mononuclear cells. Hematoxylin-eosin; ×250.
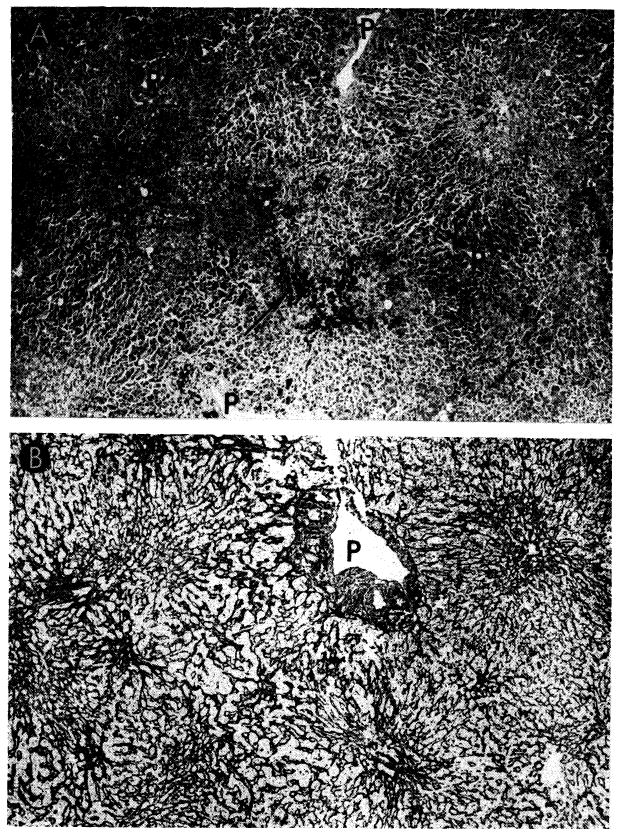
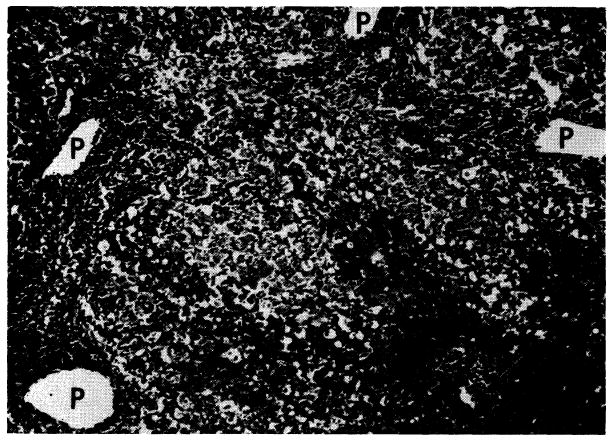
Case 5 of Colorado series; orthotopic homograft at 23 days. A, there is centrizonal and midzonal necrosis of liver cells. Only those near portal tracts (P) survive. Some hemorrhages are present in central zones (arrow). Hematoxylin-eosin; ×30. B, There is collapse of the supporting centrilobular reticulin where liver cells have undergone necrosis. P, portal tract. Reticulin stain; ×30.
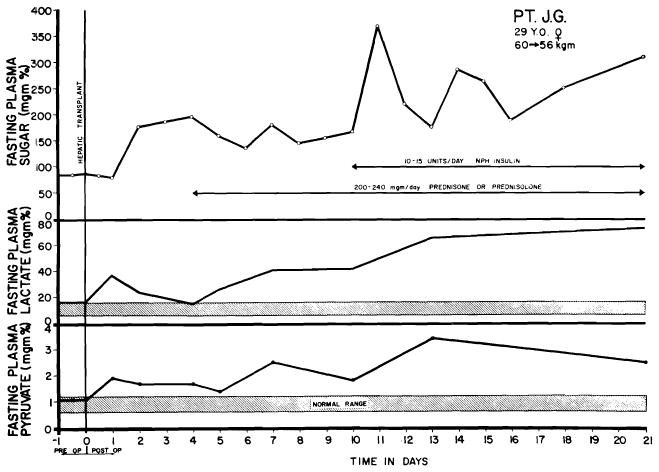
Changes in serum lactate and pyruvate in Case 5 of Denver orthotopic series. Transitory elevation immediately followed operation, with subsequent decline toward normal. The secondary rise beginning the 4th day was progressive. Note normal to increased levels of plasma sugar. Shaded bars indicate normal ranges for serum lactate and pyruvate. Severe acidosis, presumably of similar etiology, caused the early death of Hermann’s patient with auxiliary liver transplantation.
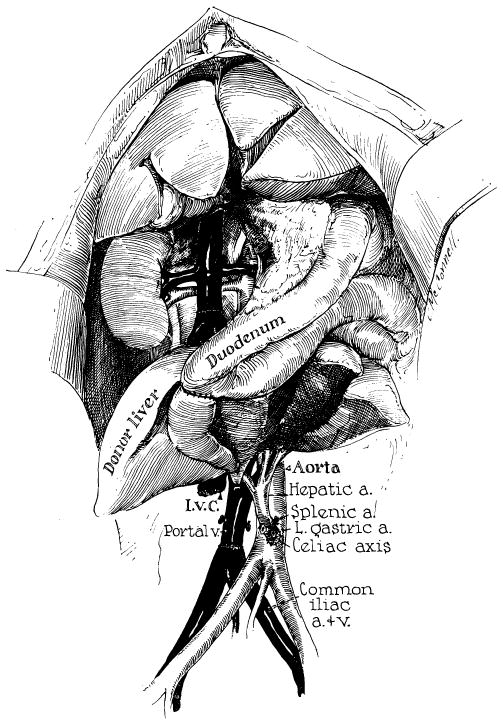
Technic of canine auxiliary liver transplantation similar to that used for a patient at the University of Colorado, except that an end-to-side portacaval shunt had already been placed in the patient and a Roux-en-Y cholecystojejunostomy was employed rather than the method of internal biliary drainage shown above. (From Starzl et al. [90].)
References
-
- Absolon KB. Personal communication. 1964.
-
- Anderson MC, Bergan JJ, Salan JR. Experimental production of hepatocellular damage with cortisone. S Forum. 1960;11:13. - PubMed
-
- Arey LB. Throttling veins in the livers of certain mammals. Anat Rec. 1941;81:21.
-
- Baker BL, et al. The effect on liver structure of treatment with adreno-corticotropin under varied dietary conditions. Am J Anat. 1948;82:79. - PubMed
Publication types
MeSH terms
Grants and funding
LinkOut - more resources
Full Text Sources