. 1984;13(1-2):137-51.
doi: 10.1016/0304-3991(84)90064-0.

Computer image modeling of pentamer packing in polyoma virus "hexamer" tubes

Computer image modeling of pentamer packing in polyoma virus "hexamer" tubes

T S Baker et al. Ultramicroscopy. 1984.

Abstract

Polymorphic assemblies of polyoma virus capsomeres that have been called "hexamer" tubes (because the morphological units are six-coordinated) are, in fact, built of pentamers, as is the icosahedrally symmetric T = 7d virus capsid. We have established the pentameric form of the capsomeres in the "hexamer" tubes by analysis of low-irradiation micrographs. Methods for generating computer image models with adjustable parameters have been developed to fit micrographs of negatively stained, flattened tubes. The image model has been refined to define the packing arrangement and substructure of the pentametric capsomeres in the superimposed top and bottom layers of the tube and to represent the differential flattening, lateral distortion and staining of the two sides. Information about the structure that is not directly accessible by conventional image filtering methods can be obtained by image modeling methods.


Figures
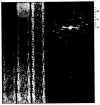
Fig 1
Fig 1
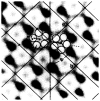
(A) Unfiltered, digitized image of a typical negatively stained polyoma “hexamer” tube. There are six axial repeats of the helical structure included in the boxed area. The prominent near-axial helical lines on the near (away from grid) and far sides of the tube, corresponding to the packing of capsomeres in rows close to the axial direction, are easier to see when the image is viewed at a glancing angle close to the axial direction. (B) “Locally” averaged tube image produced by Fourier-inverting the weighted diffraction pattern of (A), as described in the text. The procedure produces a result equivalent to that obtained by direct photographic translational superposition of (A), where shorter exposures are given for successive superpositions. (C) Long-range average image, produced as described in (B), but where all axial repeats in (A) are averaged with nearly identical weight. (D) Computed Fourier transform of (A). The positions of 13 layer lines in the top half are marked at the right. The strong peaks on the first non-equatorial layer line arise from the prominent near-axial helical lattice lines observed in the images (A)–(C). (E) Filtered diffraction pattern, produced by truncating Fourier transform data away from the calculated layer line positions with a Gaussian weighting function (with scale length ω = 0.5; see text), corresponding to the averaged image in (C). ω can be adjusted to control the extent of averaging (ω = 2.0 for (B) and 0.5 for (C)).
Fig. 2
Fig. 2
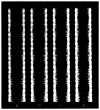
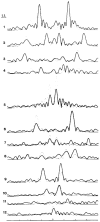
Determination of image orientation and layer line spacing. Left column: Projections of the diffraction pattern amplitudes (fig. 1D) onto lines within 3° of the vertical sampling direction in the computed Fourier transform. Right column: Fourier transforms of each line of projected amplitude data at the left. Maximum reinforcement of the layer lines occurs on the projected line between 0° and –1° from the vertical (negative sign corresponds to a counterclockwise rotation of the line away from the vertical sampling direction of the digitized image). The line at –1° rotation angle shows maximum reinforcement of the 12th layer line (marked by arrow). The Fourier transform of this projected data shows a single, prominent peak 64 units from the origin, arising from exact sampling of the layer lines every eighth (= 512/64) point of the projected data.
Fig. 3
Fig. 3
Surface lattice of the polyoma virus hexamer tube (shown in fig. 1A). This diagram corresponds to two axial repeats of the helix net cut along a line parallel to the axis (the vertical direction) opened out flat and viewed from the outside. The lattice with unit vectors a, b and included angle γ has plane group symmetry p2 and the origin is at one of the 2-fold axes. (The unit cell shown is the most nearly orthogonal but other, more oblique, cells could also be chosen to represent the lattice symmetry.) The equatorial vector E0, connecting nearest equivalent points in the equatorial plane, corresponds to a rotation of 180° about the helix axis since the tube has a parallel 2-fold symmetry axis. The particular relation observed between the axial repeat vector C0 and the equatorial vector E0 requires that |b| = 1.5 |a| and tan γ/2 = C0/E0. The basic helical symmetry, corresponding to the smallest axial translation plus rotation relating equivalent points, is represented by the dotted arrow at the lower right that is directed in the 1̅,1̅ direction of the plane lattice. The unit axial translation h = C0/12 and the screw symmetry σ = −12/5 = −2.4 corresponding to a left-handed rotation of π/σ = 75°. The line group symmetry for this helical lattice is designated D2S2.4¯.
Fig. 4
Fig. 4
Adjustable parameters of the paired pentamer model that were refined to fit the electron microscope image. The dimer of pentamers is constrained to have the line connecting their centers bisect the parallel pair of pentagon edges adjoining the 2-fold axis chosen as origin. The other classes of 2-fold axes, at the mid-point of the edges and at the center of the cell, are marked for one unit cell. The adjustable parameters are r3, the radius of a subunit; r2, the distance of the subunit center from the center of the pentagon; r1, the distance of the pentagon center from the 2-fold axis; and ψ, the angle between the vector r1, and the line parallel to the axis through the 2-fold axis. The unit vectors a and b are drawn with the dimensions of the tube surface lattice in contact with the grid (the far side), which appears to be the least distorted laterally. The radius of the tube corresponding to this surface is r0 = 13.75 nm. The parameters which best fit the experimental image are ψ = 80°, r1, = 4.25 nm, r2 = 2.72 nm and r3 = 1.75 nm. With these parameters, the edge-to-edge contacts in the nearly horizontal and vertical directions are quasi-equivalently related by the local 5-fold axes of the capsomeres. This quasi-symmetry relation was not imposed on the model, but is implied by the image data.
Fig. 5
Fig. 5
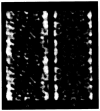
Views of a helically symmetric model computed with equal contrast on the near and far sides and without flattening. The model is rotated by 1.25° about its axis between successive images, starting with the orientation in (A) which best represents the orientation of the tube in fig. 1. The range within which views are unique is 3.75° (2π/96) for a helical structure with the surface lattice symmetry shown in fig. 3. (Other model parameters are the same as in fig. 4.)
Fig. 6
Fig. 6
Helically symmetric models with variation in the angular orientation of the motif. (ψ = 70°, 75°, 80°, 85° and 90° for (A)–(E); other parameters are the same as in fig. 4.)
Fig. 7
Fig. 7
Helically symmetric models with variation in the motif size. (r1, r2 and r3 are all scaled by 1.11, 1.06, 1.00, 0.94 and 0.89 relative to the values given in fig. 4 for models A-3.)
Fig. 8
Fig. 8
Symmetrically flattened models with variation in the extent of flattening on the two sides. The upper third of each view shows only the near half. End-on views along the axis are shown below each corresponding view normal to the flattened surface. The fraction of each model which is flattened is 0.00, 0.50, 0.67, 0.83 and 1.00 for (A)–(E). The widths of the models (relative to an unflattened model) are 1.00, 1.08, 1.18, 1.34 and 1.57 (= π/2) for (A)–(E). (Other model parameters are the same as for fig. 4.)
Fig. 9
Fig. 9
Asymmetrically flattened models with variable flattening and lateral distortion of the surface lattice on the near side. In all models the far half is flattened to the same extent (0.72), thus fixing the width at 1.23 times that of an flattened model. Motifs in the near half are expanded (A, B) or compressed (C, D, E) in a direction normal to the tube axis in the plane of flattening, to maintain the particle width and accommodate flattening which differs from that on the far side. The flattened portion of the near side is laterally distorted relative to the flattened portion of the far side by 1.14, 1.04, 0.96, 0.87 and 0.78 for (A)–(E). The upper third of each side view shows the near side only. The far side (same for all models) is shown in the lower third of the model A. Cross-sectional views of the five models appear below each corresponding projected view normal to the surface. (Other parameters are the same as for fig. 4.)
Fig. 10
Fig. 10
Models computed with differential contrast on the near and far halves. The relative contrasts between near and far sides for (A)–(E) are 4.0, 2.0, 1.0, 0.5 and 0.25. (Other model parameters are the same as for fig. 9D.)
Fig. 11
Fig. 11
Comparison of the averaged experimental image (A) with a model simulation (B). Parameters in the model are the same as those in fig. 9D except that the relative contrast between near and far halves is 1.25.
Fig. 12
Fig. 12
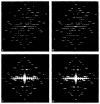
Comparison of the computed diffraction patterns from the filtered experimental image (A, B; same as fig. 1E) and from the model shown in fig. 11B (C, D). (A) and (C) show the indexed reciprocal lattices from the near sides of the experimental and model images, and (B) and (D) show the far-side indexing. The near and far lattices are not mirror-symmetric due to the unequal distortions in the two halves of the tube specimen; this differential shrinkage is actually simulated in the diffraction patterns of the model. In the example shown, the flattening on the two halves fortuitously leads to overlaps of some reciprocal lattice points from the two sides on the 6th and 7th layer lines (the two lattices necessarily overlap at the meridional position on the 12th layer line for a helical structure with σ =12/5 screw symmetry).
Fig. 13
Fig. 13
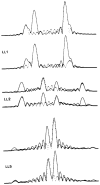
Comparison of the amplitudes along non-equatorial layer lines for the experimental (solid) and model (dotted) data. The scale factor between data sets is constant for all layer lines shown. The two sets of data differ most on the equator (not shown) and layer line 5 due to the large contrast difference between the edges of the model and its background compared with the stained specimen supported on a carbon substrate. Large differences near the ends of the layer lines (i.e. at higher resolution) reflect the higher noise in the experimental data. The close correspondence of the strong peaks comparing the experimental and model transforms provides an objective measure of how well the model built with dimers of pentamers represents the structure of this “hexamer” tube.
Fig. 14
Fig. 14
Examples of interference in the diffraction from the two sides of the model. The solid curves plot the diffraction from the two-sided model for layer lines 1, 2 and 5. (These curves are identical to the corresponding dotted curves in fig. 13.) In each pair of layer line plots, the contribution of the near and far sides alone is shown by the upper and lower dotted curve respectively. The measured amplitude is not simply the sum of the near and far sides calculated separately. The interference effects, for example, lead to cancellation of subsidiary fringes at the center of layer line 1 and to enhancement of the outer fringes on layer line 5. Furthermore, peaks corresponding to lattice points overlap on layer line 1 and are shifted and modulated by overlapping subsidiary fringes on layer lines 2 and 5. These examples illustrate that interference effects make it difficult to separate the diffraction from the two sides by straightforward filtering procedures. More elaborate deconvolution procedures could be used to recover the undistorted diffraction from each side.

Similar articles

Cited by

References

    1. Klug A, Finch JT. J Mol Biol. 1965;11:403. - PubMed
    1. Finch JT, Klug A. J Mol Biol. 1965;13:1. - PubMed
    1. Williams MG, Howatson AF, Almeida JD. Nature. 1961;189:895. - PubMed
    1. Wildy P, Stoker MGP, Macpherson IA, Horne RW. Virology. 1960;11:444.
    1. Howatson AF, Crawford LV. Virology. 1963;21:1. - PubMed

Publication types