. 1984 Sep;28(2):233-53.
doi: 10.1016/0026-2862(84)90020-7.

Diffusional arteriovenous shunting in the heart

Diffusional arteriovenous shunting in the heart

J B Bassingthwaighte et al. Microvasc Res. 1984 Sep.

Abstract

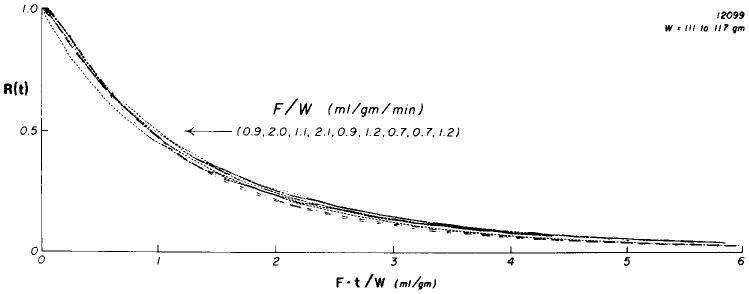
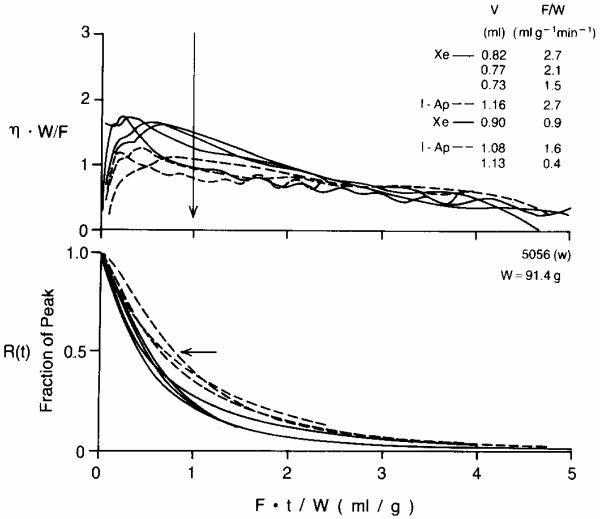
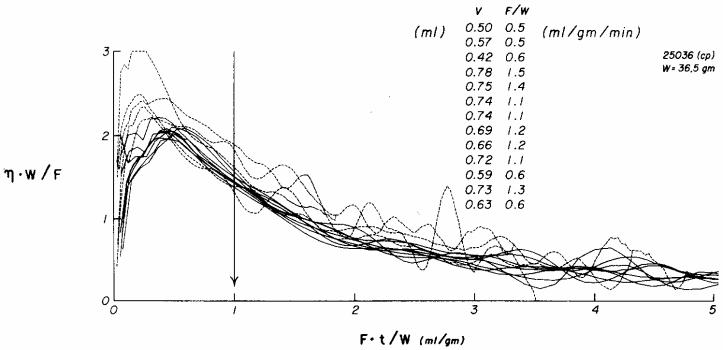
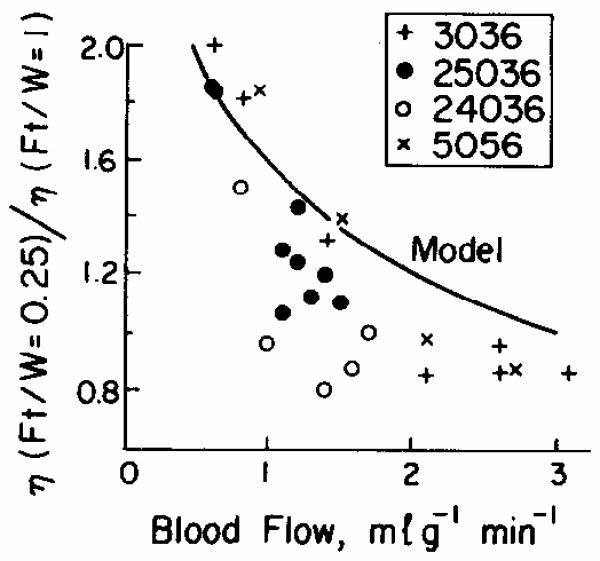
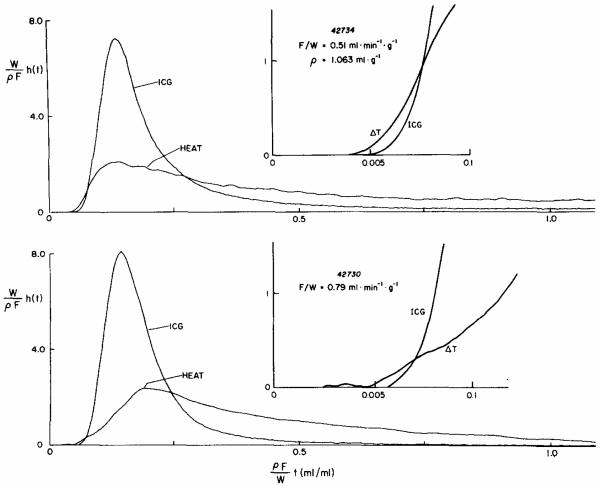
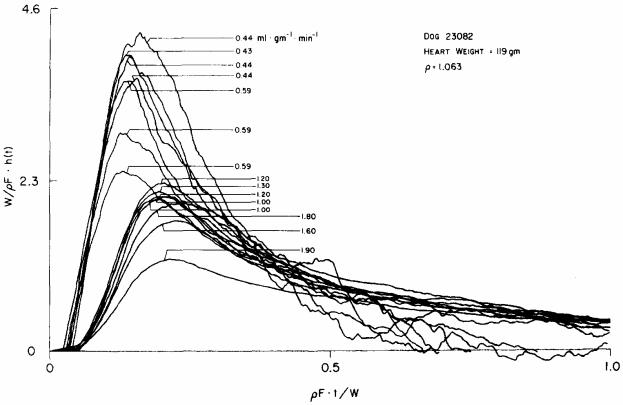
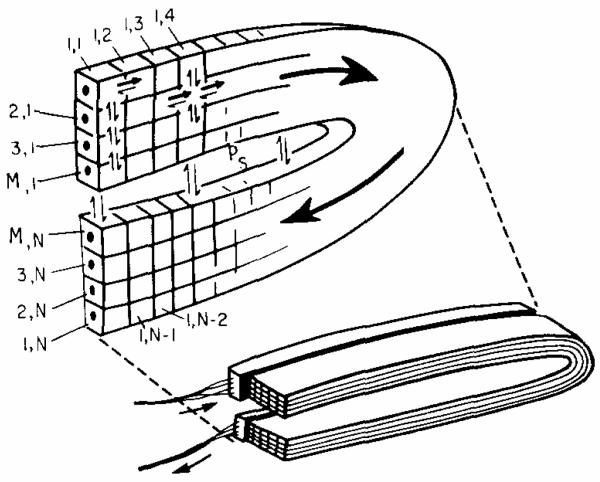
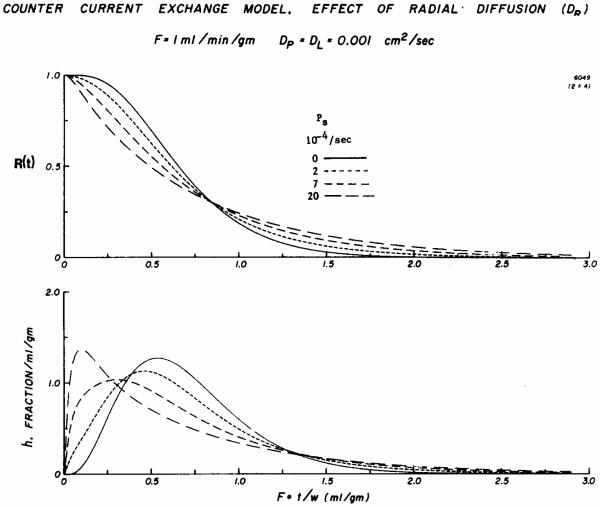
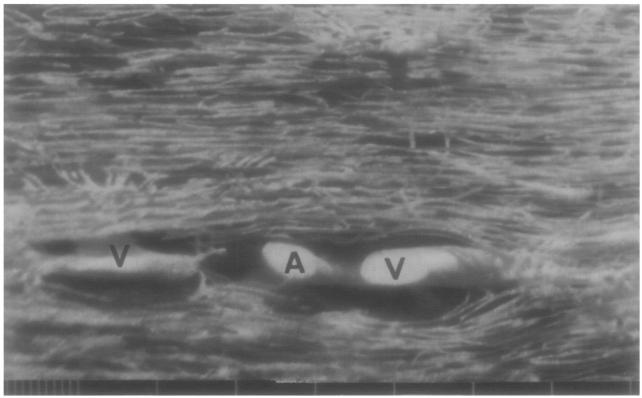
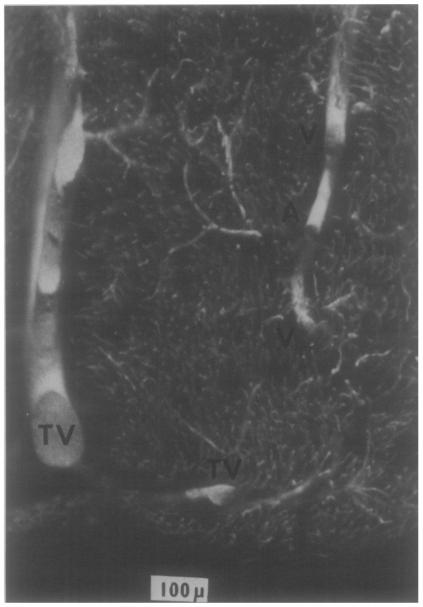
Previous indicator dilution experiments in isolated blood-perfused dog hearts suggested that there was intramyocardial diffusional shunting of water relative to a flow-limited solute, antipyrine. Two sets of studies have been done to assess the importance of this shunting, since it implies the possibility of a diffusional bypass for oxygen and other substances, which may be important in ischemia. Nonconsumed tracers were used to show the phenomenon. In the first set, bolus injections of 133Xe dissolved in saline were made into the coronary inflow and the tracer content of the organ recorded by an external gamma detector. The initial Xe washout was disproportionately rapid at low flows, and the late phase was also relatively retarded. In the second set, boluses of cool saline containing indocyanine green were injected into the coronary arterial inflow while coronary sinus outflow dilution curves were recorded via a thermistor and a dye densitometer over a wide range of flows. The thermal curves showed emergence of heat preceding the dye; the degree of precession was much greater at low flows, and, unlike the dye curves, the thermal dilution curves showed dramatic differences in shape at different flows. A model for diffusional countercurrent exchange shows similar changes in residue curves and outflow dilution curves. The conclusion is that there is diffusional shunting of small lipid-soluble molecules whose diffusion coefficients in tissue are high. While the shunting of heat is great, the shunting of soluble gases will not be large and that of normal substrates will be negligible.


Figures

Fig. 1
Fig. 1
Residue function curves, R(t), for 125I-antipyrine in an isolated blood-perfused dog heart. The blood flows ranged from 0.7 to 2.1 ml g−1 min−1; these flows are indicated with respect to each of the curves at the position from left to right as they cross the 50% washout point indicated by the arrow. The curves are very similar in shape; there is no systematic influence of flow on the position at which an individual curve reaches 50, 30, or 10% retained tracer. These curves therefore show “similarity” in their residue functions.
Fig. 2
Fig. 2
Xenon and antipyrine emergence and clearance in an isolated blood-perfused dog heart (weight = 91.4 g). The time scale is normalized by multiplying by F/W so the scale is the volume which has emerged divided by heart weight; e.g., at Ft/W = 2 the volume of flow which has emerged is the volume in ml of twice the heart weight in grams. Continuous lines are Xe; dashed lines are I-Ap. Upper panel: The emergence function η(t) is scaled by W/F as required for a self-consistent transformation. At the time of the vertical arrow, Ft/W = 1, the volumes V which had emerged and the flows F/W are listed in the same order as the curves cross the arrow. Note that the xenon escape is consistently higher for all times up to Ft/W = 1, and at late times the xenon washout is slower than antipyrine washout. Lower panel: Residue functions for xenon are consistently lower than those for antipyrine up until Ft/W is 3 or greater.
Fig. 3
Fig. 3
Myocardial emergence functions for xenon over a threefold range of flows in a blood-perfused dog heart. The time axis is normalized by multiplying by F/W, flow divided by heart weight, and the ordinate η(t) is appropriately scaled reciprocally. The flows for each of the curves are indicated by the listing from above downward at the arrow. Those recorded at the lowest flows (dotted lines = F/W < 1.0 ml g−1 min−1) gave the high emergence rates at early times, suggesting shunting, while those at higher flows (continuous lines = F/W > 1.0) had later but lower peaks and were grouped more closely together indicating a more precise dependence on flow alone, that is, less diffusional shunting.
Fig. 4
Fig. 4
Ratios of initial escape rate for xenon to that at one mean transit time, η(Ft/W = 0.25)/ η(Ft/W = 1.0). Data are taken from 25 curves from four dog hearts. The comparable data from 20 IAp curves were ratios less than 1.2 (with one exception) and no statistical relationship to flow. The one exceptional IAp point was a ratio of 1.5 at FB = 0.4, from the bottom curve of Fig. 2, upper panel. The model curve is taken from solutions such as Fig. 8.
Fig. 5
Fig. 5
Transcoronary transport of heat and indocyanine green. The curves in both panels are the normalized impulse response, h(t), sampled from the coronary outflow from an isolated blood-perfused dog heart. The h(t)'s are normalized by the factor W/ρF, the weight divided by the density times flow, and the abscissa by the reciprocal factor; the abscissa is the volume having come out of the heart by time t as a fraction of the volume of the heart itself, so that 1.O means that the total volume of effluent from the time of injection = the heart volume. Upper panel: At a low flow, F/ W = 0.51 ml g−1 min−1, there is a significant precession of the thermal dilution curve so that in the early few seconds the heat dilution curve is above the indocyanine green dilution curve. Lower panel: At a higher flow, F/W = 0.79 ml g−1 min−1, the degree of precession is less (arrow) and the shape of the curve is different in that the peak is more delayed and rounded than at the lower flow.
Fig. 6
Fig. 6
Transcoronary transport functions for thermal indicator at various flows. Thermal indicator was injected into the aortic root in an isolated blood-perfused dog heart and the resultant temperature change in the coronary sinus outflow was recorded from a thermistor. Normalization of the axes is the same as in Fig. 5. The flows are indicated for each of the curves. At low flows there is much higher earlier appearance of indicator in the outflow. The curves tended to become more similar at higher flows.
Fig. 7
Fig. 7
Model for diffusional shunting between inflow and outflow in a spatially distributed system. The space in the fold, with exchange rate constant Ps, in the region across which diffusional shunting occurs; this shunting produces concentration gradients throughout the tissue at all times, preventing equilibration. A numerical scheme for computing solutions is indicated above: positions along the capillary axis from x = 0 to x = L are represented by segments 1 to N. There are M capillaries in the folded slab. While the exchange is greatest between the upstream and downstream halves of the Mth capillary, there is also diffusion in all directions which means that the first segment of the first segment of the first capillary (segment 1.1) also changes with its last segment (1, N), but indirectly.
Fig. 8
Fig. 8
Solutions to a countercurrent exchange model showing the responses to an impulse injection at the input to the system in four situations ranging from no countercurrent exchange, a continuous line, to substantial countercurrent exchange, the long dashes. Upper panel: The residue function R(t) shows a much more rapid early diminution in the presence of countercurrent exchange, with accordingly much slowed washout of the tracer retained at longer times. The nodal point at Ft/W = 0.8 ml g−1 is a normal feature of such models, but the position of the node depends on the exact configuration of the model. Lower panel: The impulse responses for the three cases with diffusional shunting show precession and earlier appearance in the outflow. Although the values for h(t) with diffusional shunting are higher than those without, after Ft/W = 1.3 the curves become difficult to distinguish from each other during the late phase of washout.
Fig. 9
Fig. 9
Microvasculature of the left ventricular myocardium showing an arteriole, A (about 35 to 40 μm diameter), and two venae comitantes, V. The scale below gives 10- and 100-μm intervals. The venule on the right is about 40 × 80 μm. This arrangement is the usual one for arterioles from l-mm diameter down to those of 15-μm diameter.
Fig.10
Fig.10
Arteriole and venules in the subendocardium of an adult dog. The microvasculature is filled with silicon elastomer and the tissue cleared by immersion in methylsalicylate. The ventricular cavity is below. In the right upper region is a 25μm arteriole, A, separated by 30 to 50 μm from venae comitantes, V, one about 4.5 μm and the other about 25 μm in diameter. Along the left side and below are a Thebesian vein and its branch, TV.

References

    1. Armour JA, Klassen GA. Epicardial coronary venous pressure. Canad. J. Physiol. Pharmacol. 1981;59:1250–1259. - PubMed
    1. Aukland K. Renal medullary heat clearance in the dog. Circ. Res. 1967;20:194–203. - PubMed
    1. Aukland K, Berliner RW. Renal medullary countercurrent system studied with hydrogen gas. Circ. Res. 1964;15:430–442. - PubMed
    1. Aukland K, Bower BF, Berliner RW. Measurement of local blood flow with hydrogen gas. Circ. Res. 1964;14:164–187. - PubMed
    1. Barlow CH, Chance B. Ischemic areas in perfused rat hearts: measurement by NADH fluorescence photography. Science. 1976;3:909–910. - PubMed

Publication types