. 1984 Feb;43(2):181-4.

Sensitivity functions in the estimation of parameters of cellular exchange

Sensitivity functions in the estimation of parameters of cellular exchange

J B Bassingthwaighte et al. Fed Proc. 1984 Feb.

Abstract

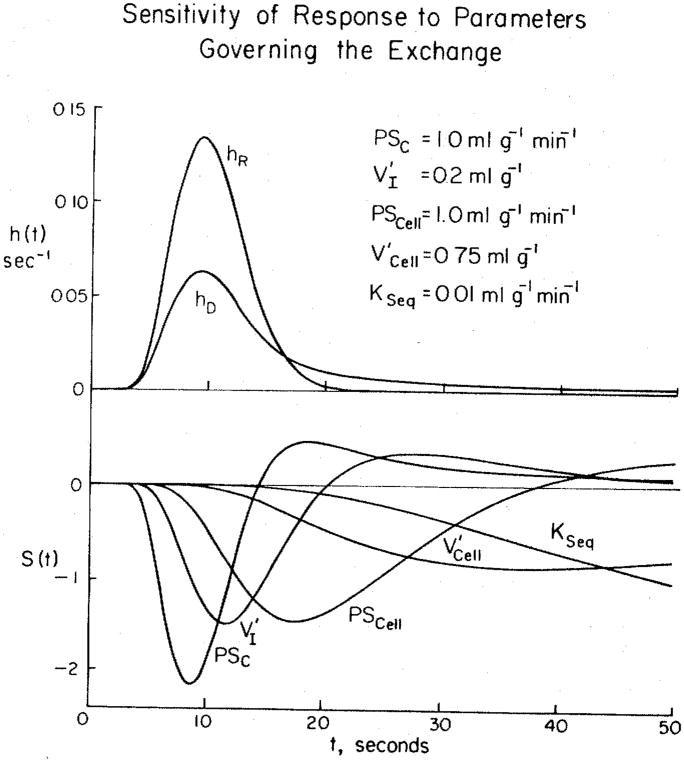
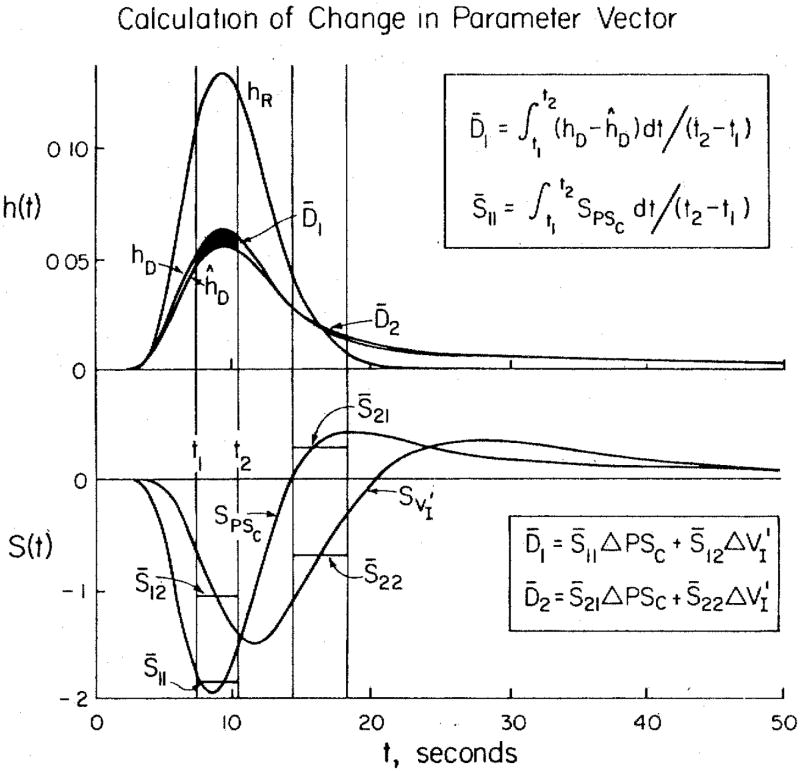
The analysis of multiple-indicator dilution curves to estimate the rates of transport of ions and substrates across the sarcolemma of myocardial cells requires the formulation of models for the blood-interstitial fluid-cell exchanges. The fitting of models to the sets of experimental data is dependent on acquiring a large enough data set, in one physiological state, that there is at least as much information in the data as there are unknown model parameters to be determined. Inasmuch as data are necessarily noisy, redundancy of data and overdetermination of the unknowns are highly desirable. Sensitivity functions are useful in demonstrating which portions of the data relate to which unknown parameters. They are also useful in adjusting model parameters to fit the model to the data, and therefore in parameter evaluation.


Figures

Figure 1
Figure 1
Solutions and sensitivity functions for a model of blood-tissue exchange in the heart. Upper panel) Impulse responses for a system consisting of arteries and veins and a set of capillary-tissue units in parallel. The large-vessel transport functions are described by a unimodal density function with mean transit time 7.9 s, relative dispersion 0.34, and skewness 0.75 (3a). The curve for the intravascular reference hR(t) is the large-vessel transport function convoluted with the weighted sum of 2, fifth-order Poisson operators representing the intracapillary transport and dispersion. The mean capillary transit time was 3.0 s. The curve hD(t) for the permeating tracer has parameters suitable for D-glucose in the heart. The flow Fs was 1 ml · g−1 · min−1; the parameters governing the exchange and the intracellular sequestration KSeq are listed. Lower panel) Sensitivity functions for each of the governing transport parameters. Note that all are different from the others, and that they are ordered in time in accordance with the sequence of solute transport from blood into the cells. The functions S(t) are for 1 % changes in parameter values and multiplied by scalars for display purposes: the scalars are 1 for PSc, 160 for VI, 5 for PSCell, 500 for VCell, and 1500 for KSeq.
Figure 2
Figure 2
Calculation of adjustment in parameter vector for fitting a model to data. There are two unknowns, PSC and V1. The intravascular reference data curve is hR(t). The model curve ĥD(t) differs from the data curve hD(t): the differences in each of the two time windows are given by the average differences 1 and 2, the area divided by the window width. The average values of the sensitivity functions in the two time windows are given by the ’s. These give the coefficients defining the influences of the two parameters in each of the two regions along hD(t).

Similar articles

Cited by

References

    1. Bassingthwaighte JB. Plasma indicator dispersion in arteries of the human leg. Circ Res. 1966;19:332–346. - PMC - PubMed
    1. Bassingthwaighte JB. Physiology and theory of tracer washout techniques for the estimation of myocardial blood flow, flow estimation from tracer washout. Prog Cardiovasc Dis. 1977;20:165–189. - PMC - PubMed
    1. Bassingthwaighte JB. Cellular influx and efflux in the heart. Fed Proc. 1982;41(14):3040–3044. - PMC - PubMed
    1. Bassingthwaighte JB, Ackerman FH. Mathematical linearity of circulatory transport. J Appl Physiol. 1967;22:879–888. - PMC - PubMed
    1. Bassingthwaighte JB, Ackerman FH, Wood EH. Applications of the lagged normal density curve as a model for arterial dilution curves. Circ Res. 1966;18:398–415. - PMC - PubMed

Publication types

LinkOut - more resources