

Analysis of excited-state processes by phase-modulation fluorescence spectroscopy
- PMID: 7139044
- PMCID: PMC6918069
- DOI: 10.1016/0301-4622(82)85013-8
Analysis of excited-state processes by phase-modulation fluorescence spectroscopy
Abstract
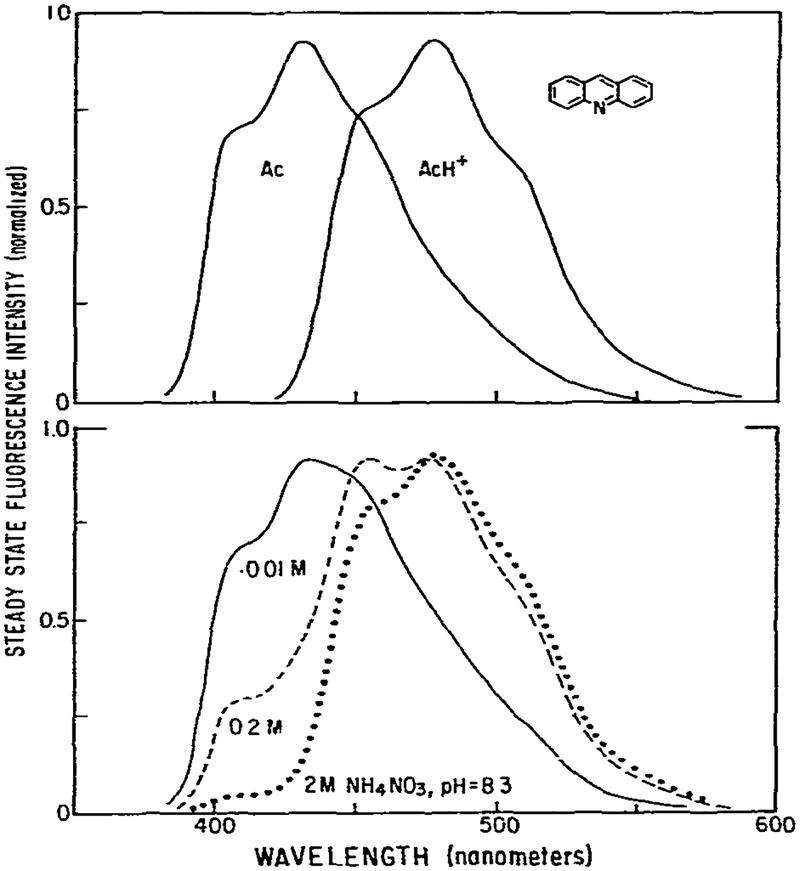
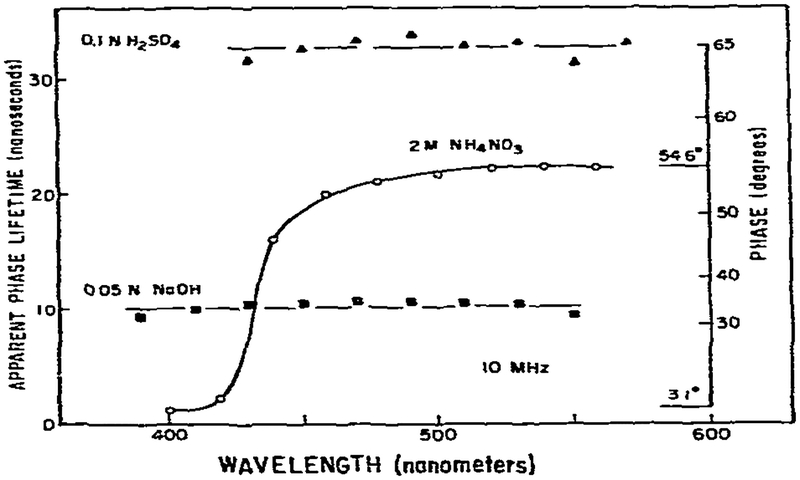
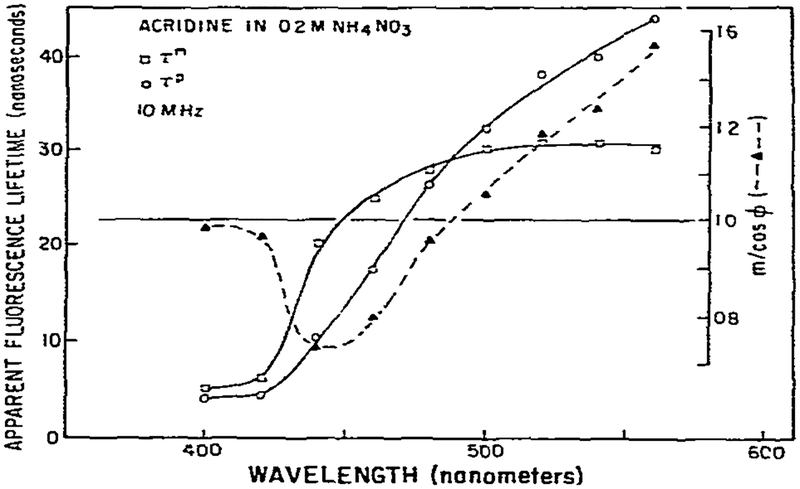
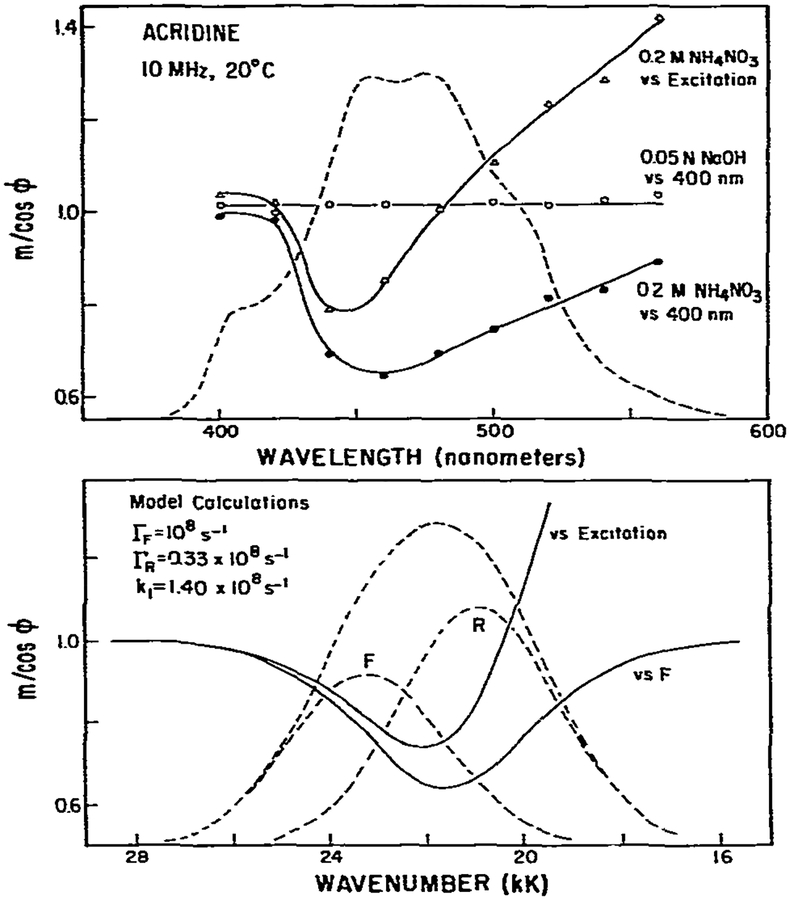
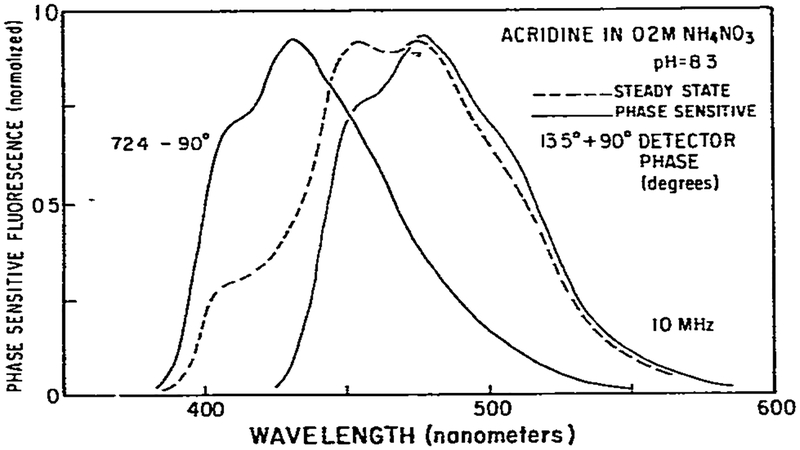
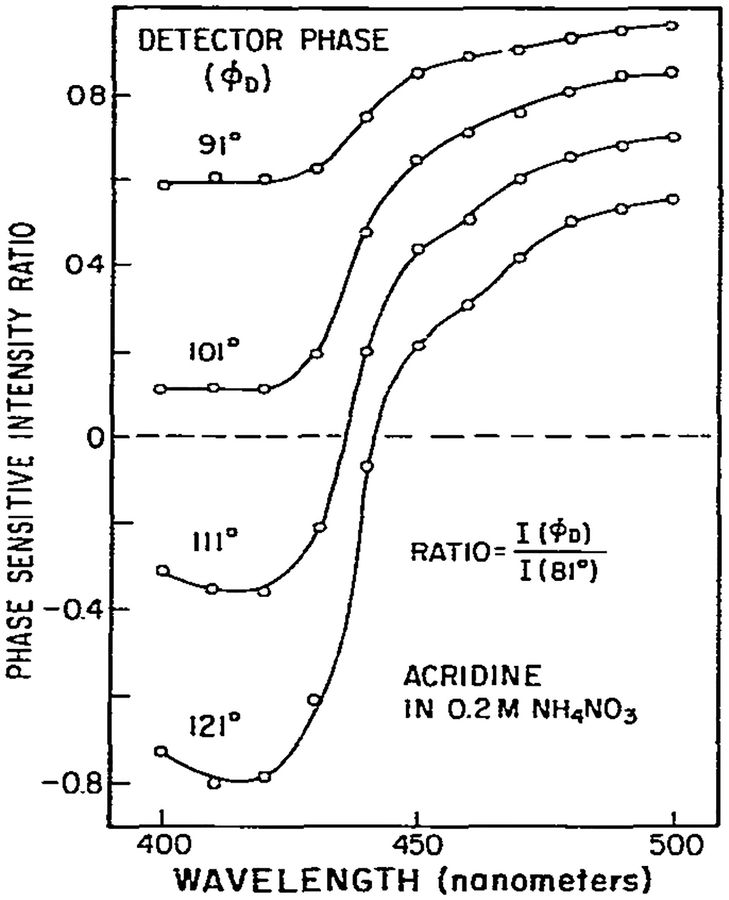
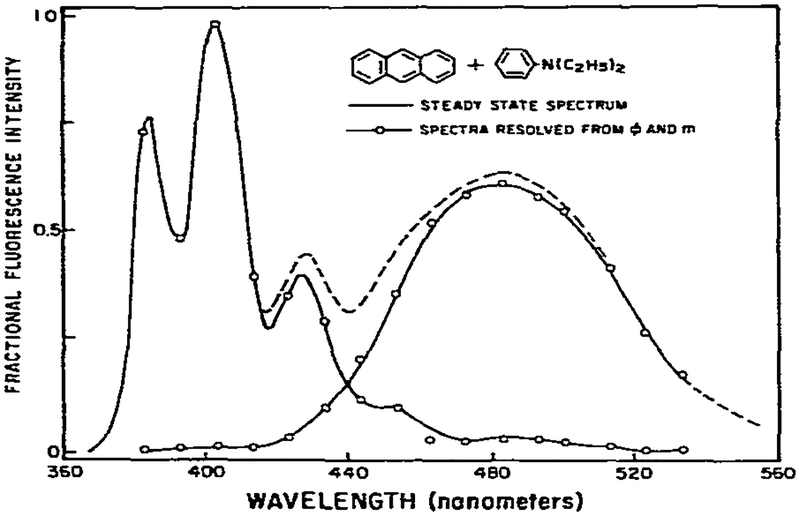
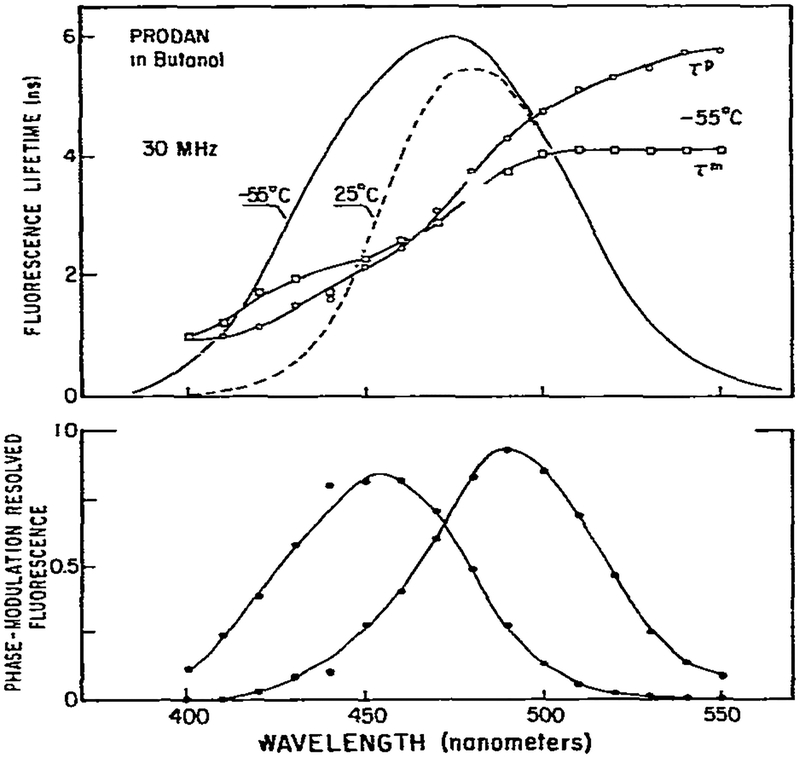
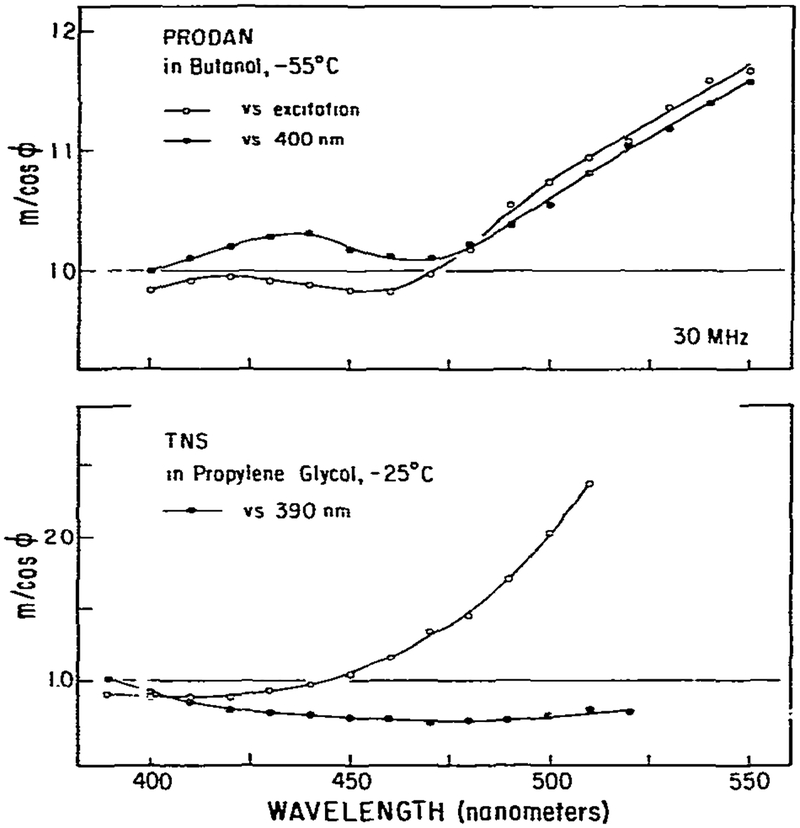
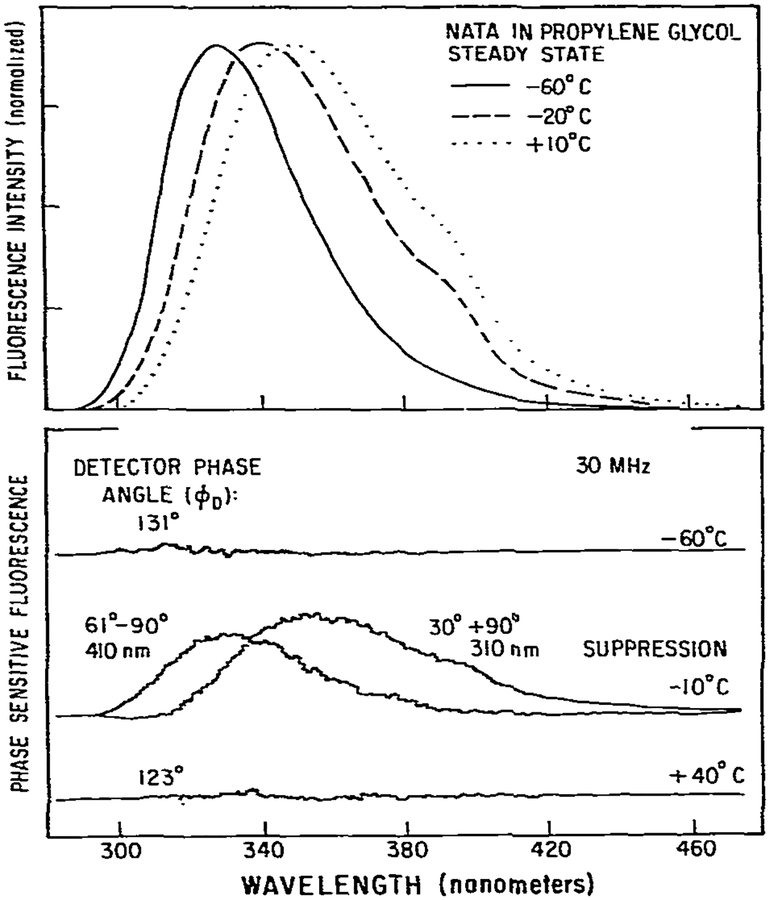
Fluorescence phase shift and demodulation methods were used in the analysis of excited-state reactions and to investigate solvent relaxation around fluorophores in viscous solvents. The chosen samples illustrate the results expected for fluorophores bound to biological macromolecules. These moderately simple samples served to test the theoretical predictions described in the preceding paper (J.R. Lakowicz and A.B. Balter, Biophys. Chem. 16 (1982) 99.) and to illustrate the characteristic features of phase-modulation data expected from samples which display time-dependent spectral shifts. The excited-state protonation of acridine and exciplex formation between anthracene and diethylaniline provided examples of one-step reactions in which the lifetimes of the initially excited and the reacted species were independent of emission wavelength. Using these samples we demonstrated the following: (1) Wavelength-dependent phase shift and demodulation values can be used to prove the occurrence of an excited-state process. Proof is obtained by observation of phase angles (ø) larger than 90 degrees or by measurement of ratios of m/cos ø greater than 1, where m is the modulation of the emission relative to that of the excitation. (2) For a two-state process the individual emission spectra of each state can be calculated from the wavelength-dependent phase and modulation data. (3) The phase difference or demodulation factor between the initially excited and the reacted states reveals directly the fluorescence lifetime of the product of the reaction. (4) Phase-sensitive detection of fluorescence can be used to prove that the lifetimes of both the initially excited and the reacted states are independent of emission wavelength. (5) If steady-state spectra of the individual species are known, then phase-sensitive emission spectra can be used to measure the lifetimes of the individual components irrespective of the extent of spectral overlap. (6) Spectral regions of constant lifetime can be identified by the ratios of phase-sensitive emission spectra. In addition, we examined 6-propionyl-2-dimethylaminonaphthalene (PRODAN) and N-acetyl-L-tryptophanamide (NATA) in viscous solvents where the solvent relaxation times were comparable to the fluorescence lifetimes. Using PRODAN in n-butanol we used m/cos ø measurements, relative to the blue edge of the emission, to demonstrate that solvent relaxation requires more than a single step. For NATA in propylene glycol we used phase-sensitive detection of fluorescence to directly record the emission spectra of the initially excited and the solvent relaxed states. These measurements can be easily extended to fluorophores which are bound to proteins and membranes and are likely to be useful in studies of the dynamic properties of biopolymers.
Figures


Similar articles
-
Phase-sensitive fluorescence spectroscopy: a new method to resolve fluorescence lifetimes or emission spectra of components in a mixture of fluorophores.J Biochem Biophys Methods. 1981 Jul;5(1):19-35. doi: 10.1016/0165-022x(81)90030-0. J Biochem Biophys Methods. 1981. PMID: 7276422
-
Theory of phase-modulation fluorescence spectroscopy for excited-state processes.Biophys Chem. 1982 Oct;16(2):99-115. doi: 10.1016/0301-4622(82)85012-6. Biophys Chem. 1982. PMID: 7139052 Free PMC article.
-
Laurdan solvatochromism: solvent dielectric relaxation and intramolecular excited-state reaction.Biophys J. 1997 Oct;73(4):2221-34. doi: 10.1016/S0006-3495(97)78253-5. Biophys J. 1997. PMID: 9336218 Free PMC article.
-
Exploring membrane organization and dynamics by the wavelength-selective fluorescence approach.Chem Phys Lipids. 2003 Jan;122(1-2):3-17. doi: 10.1016/s0009-3084(02)00174-3. Chem Phys Lipids. 2003. PMID: 12598034 Review.
-
Enhancing the sensitivity of fluorescence correlation spectroscopy by using time-correlated single photon counting.Curr Pharm Biotechnol. 2005 Oct;6(5):405-14. doi: 10.2174/138920105774370625. Curr Pharm Biotechnol. 2005. PMID: 16248814 Review.
Cited by
-
Analysis of fluorescence decay kinetics measured in the frequency domain using distributions of decay times.Biophys Chem. 1987 Oct;28(1):35-50. doi: 10.1016/0301-4622(87)80073-x. Biophys Chem. 1987. PMID: 3689869 Free PMC article.
-
Long-wavelength long-lifetime luminophores.Anal Chem. 2001 Sep 1;73(17):4277-85. doi: 10.1021/ac0101050. Anal Chem. 2001. PMID: 11569820 Free PMC article.
-
Spectral Relaxation Imaging Microscopy II: Complex Dynamics.Int J Mol Sci. 2023 Jul 31;24(15):12271. doi: 10.3390/ijms241512271. Int J Mol Sci. 2023. PMID: 37569641 Free PMC article.
-
Red-edge excitation of fluorescence and dynamic properties of proteins and membranes.Biochemistry. 1984 Jun 19;23(13):3013-21. doi: 10.1021/bi00308a026. Biochemistry. 1984. PMID: 6466628 Free PMC article.
-
Quantitative multi-color FRET measurements by Fourier lifetime excitation-emission matrix spectroscopy.Opt Express. 2012 Nov 19;20(24):26806-27. doi: 10.1364/OE.20.026806. Opt Express. 2012. PMID: 23187535 Free PMC article.
References
-
- Bakhshiev NG, Mazurenko Yu.T. and Pirerskaya IV, Optics Spectrosc. 21 (1966) 307.
-
- Veselova TV, Obyknovennaya IE, Cherkasov AS and Shirokov VI, Optics Spectrosc. 33 (1972) 488.
-
- Bauer RK, Kowalczyk A and Baiter A, Z. Naturforsch 32a (1977) 560.
-
- Lakowicz JR Cherek H and Bevan DR, J. Biol. Chem 255 (1980) 4403. - PubMed
Publication types
MeSH terms
Substances
Grants and funding
LinkOut - more resources
Full Text Sources
Other Literature Sources
