

Dynamic properties of the lipid-water interface of model membranes as revealed by lifetime-resolved fluorescence emission spectra
- PMID: 7225333
- PMCID: PMC6907075
- DOI: 10.1021/bi00508a051
Dynamic properties of the lipid-water interface of model membranes as revealed by lifetime-resolved fluorescence emission spectra
Abstract
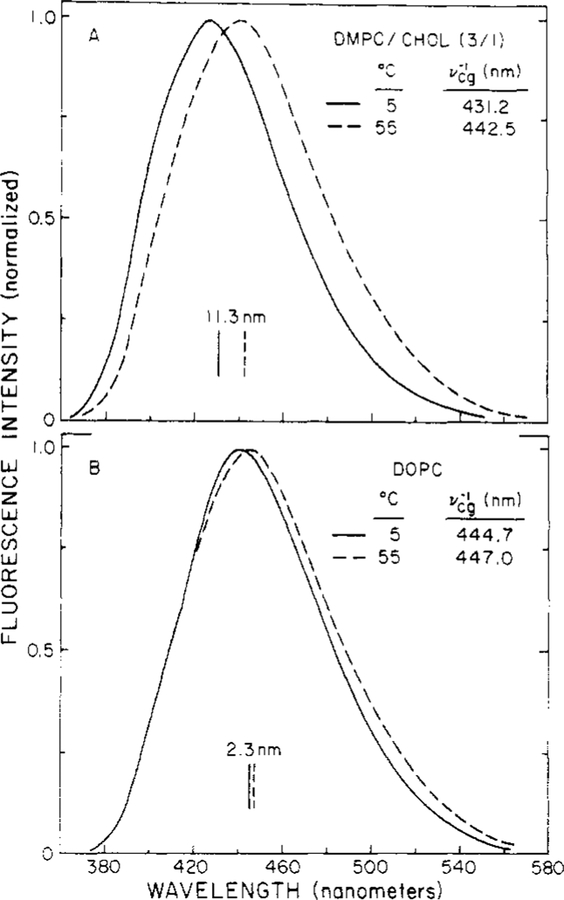
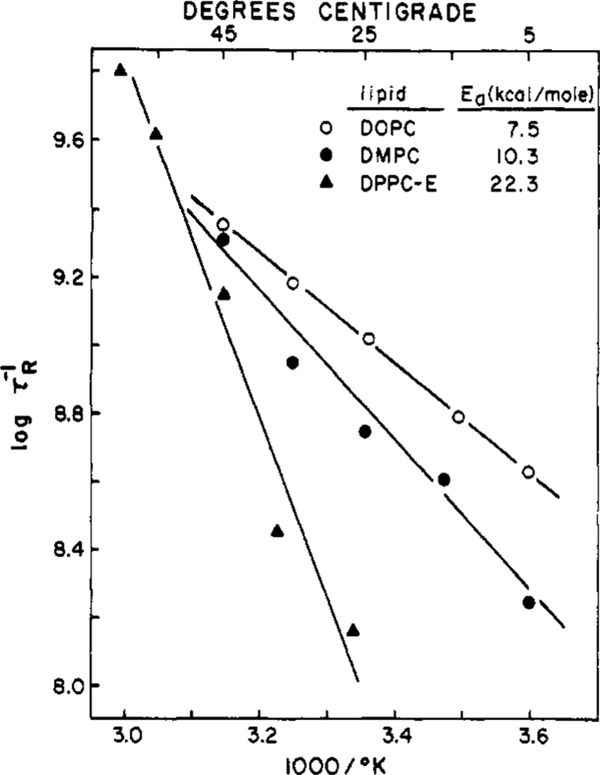
We examined the dynamic properties of the lipid-water interface region of model membranes, on the nanosecond time scale, by using the fluorescent probe 2-p-toluidinylnaphthalene-6-sulfonic acid (TNS). In particular, we examined the steady-state emission spectra of TNS as its average lifetime was decreased by oxygen quenching. Under these quenching conditions the centers of gravity (Vcg) of the emission spectra shift ot shorter wavelengths. The lifetime dependence of these shifts reveals the time dependence of membrane relaxation around the excited-state dipole moment of TNS. The lipids investigated include dioleoyl-, dimyristoyl-, and dipalmitoyl-L-alpha-phosphatidylcholines, bilayers containing cholesterol, and an ether analogue of dipalmitoyl-L-alpha-phosphatidylcholine. For these lipids, the spectral relaxation times and the temperature dependence of the relaxations are similar in magnitude. Most relaxation times fall in the range of 0.6-6 ns, and except for the ether analogue, the inactivation energies for spectral relaxation are 10 plus or minus 2 kcal/mol. The average energy loss during spectral relaxation was 1000 cm(-1). However, for the saturated phosphatidylcholines at temperatures below their transition temperatures, smaller relaxation losses were observed (approximately 600 cm(-1)). We attribute these smaller losses to ordering of the polar head groups around the ground-state dipole moment of TNS. Overall, these results indicate that the dynamic properties of the lipid-water interface region are similar among the phosphatidylcholines and depend only slightly on the chemical composition and phase state of the acyl side chains.
Figures


References
-
- Bakhshiev NK (1964) Opt. Spectrosc. (Engl. Transl.) 16, 446–451.
-
- Bakhshiev NG, & Piterskaya IV (1966) Opt. Spectrosc. (Engl. Transl.) 20, 437–441.
-
- Bakhshiev NG, Mazurenko Yu T., & Piterskaya IV (1969) Akad. Nauk SSSR, Bull. Phys. Ser 32,1262–1266.
-
- Birks JB (1970) Photophysics of Aromatic Molecules, pp 113–116, Wiley-Interscience, New York.
Publication types
MeSH terms
Substances
Grants and funding
LinkOut - more resources
Full Text Sources
Miscellaneous