. 1995 Aug;34(2):276-82.
doi: 10.1002/mrm.1910340220.

A magnetization-driven gradient echo pulse sequence for the study of myocardial perfusion

Affiliations

A magnetization-driven gradient echo pulse sequence for the study of myocardial perfusion

R M Judd et al. Magn Reson Med. 1995 Aug.

Abstract

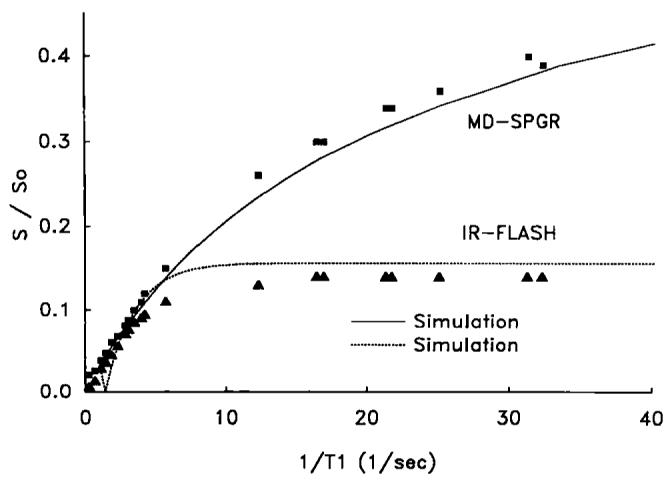
A T1-weighted imaging pulse sequence for contrast-based studies of myocardial perfusion is presented and evaluated in phantoms and in vivo. The sequence is similar to spoiled gradient-recalled echo sequences except that nonselective preparatory RF pulses drive magnetization to steady state prior to image acquisition. Steady state is thus obtained in both tissue and blood resulting in a stable, homogeneous, and dark pre-contrast baseline. Tip angles and timings are chosen so that pixel intensity approximates a linear relation to 1/T1. The dynamic range of signal response to contrast agent concentration is greater than that of an inversion-recovery fast low angle shot sequence. The sequence proposed should be useful for myocardial perfusion studies.


Figures

FIG. 1
FIG. 1
MD-SPGR pulse sequence used for in vivo imaging. Within each cardiac cycle, a series of 60 preparatory RF pulses are used to drive magnetization to steady state, immediately followed by 32 phase encodes for image data acquisition. Each image is acquired over three cardiac cycles (total of 96 phase encodes). To minimize stimulated echoes, a 1-ms spoiler gradient is applied along Gz after the 60th preparatory RF pulse but before the imaging pulses (labeled “1 ms spoiler”). The spoiler gradient is also applied after every sixth preparatory RF pulse (i.e., after RF pulse #6 as shown in Figure, and after RF pulse 12, 18, 24, etc.) for technical reasons relating to memory size limitations on the RF wave form board.
FIG. 2
FIG. 2
Number of RF pulses required to drive magnetization to steady state. (a) flip angles of 10 and 45°; (b) flip angle of 90°. Although the number of pulses required was dependent on flip angle, for any given flip angle at least 32 pulses were required to drive magnetization to within 5% of its steady state value.
FIG. 3
FIG. 3
Experimental and simulated relationships between image intensity normalized to fully relaxed image intensity (S/S0) and 1/T1 for both the MD-SPGR and IR-FLASH pulse sequences. The relationships were similar in the range of 1/T1's expected in myocardial tissue (<5 s−1), but image intensity was much higher for MD-SPGR compared to IR-FLASH in the range of 1/T1's expected in blood (>5 s−1).
FIG. 4
FIG. 4
In vivo time sequential short-axis images of a human heart acquired using the MD-SPGR sequence before, during, and after bolus administration of an MR contrast agent. Time increases from left to right, then top to bottom. Each image was acquired in three cardiac cycles. These images were acquired approximately 30 s apart (allowing approximately 15 s between breath-holds for the person to breathe). The pre-contrast image (upper left) exhibited homogeneous and dark pixel intensities in both blood and myocardium. The homogeneity of pixel intensities in pre-contrast images was highly reproducible among patients, facilitating visualization of regional contrast delivery.
FIG. 5
FIG. 5
Time-intensity curves from images acquired in a patient from regions of interest within cavity blood, normal myocardium, and infarcted myocardium. In all volunteers and in regions of normal myocardium in patients, the myocardial time-intensity curves (squares) were similar to those of blood (open circles) but smaller in magnitude. In regions of infarcted myocardium (triangles), time intensity curves showed hyper enhancement in images acquired more than 2 min post-contrast.

References

    1. Rosen BR, Belliveau JW, Vevea JM, Brady TJ. Perfusion imaging with NMR contrast agents. Magn. Reson. Med. 1990;14:249–265. - PubMed
    1. Atkinson DJ, Burstein D, Edelman RR. First-pass cardiac perfusion evaluation with ultrafast MR imaging. Radiology. 1990;174:757–762. - PubMed
    1. Wendland MF, Saeed M, Takayuki M, Derugin N, Moseley ME, Higgins CB. Echo-planar MR imaging of normal and ischemic myocardium with gadodiamide injection. Radiology. 1993;186:535–542. - PubMed
    1. Wilke N, Simm C, Zhang J, Ellerman J, Ya X, Merkle H, Path G, Ludemann H, Bache RJ, Ururbil K. Contrast-enhanced first pass myocardial perfusion imaging—correlation between myocardial blood flow in dogs at rest and during hyperemia. Magn. Reson. Med. 1993;29:485–497. - PubMed
    1. Lima JAC, Judd RM, Zerhouni EA, Schulman SP, Bazille A, Veigh McE. R., Shapiro EP, Weiss JL. Contrast enhanced ultrafast MRI demonstrates perfusion in infarcted myocardium supplied by patent coronary artery despite thallium defect. Circ. Suppl. 1993;88:1275.

MeSH terms