. 1995 Sep;34(3):368-77.
doi: 10.1002/mrm.1910340314.

Correlation of early reduction in the apparent diffusion coefficient of water with blood flow reduction during middle cerebral artery occlusion in rats

Affiliations

Correlation of early reduction in the apparent diffusion coefficient of water with blood flow reduction during middle cerebral artery occlusion in rats

A Mancuso et al. Magn Reson Med. 1995 Sep.

Abstract

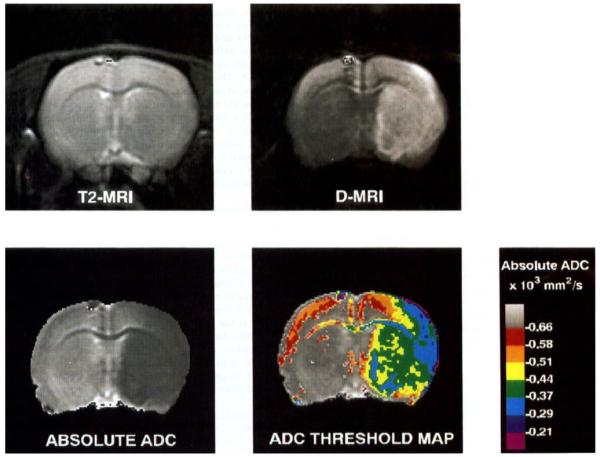
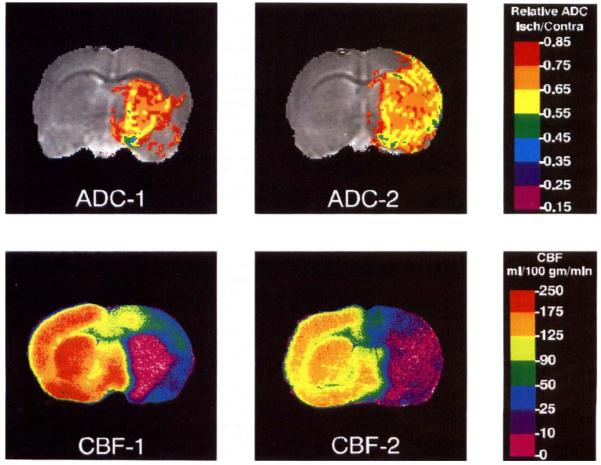
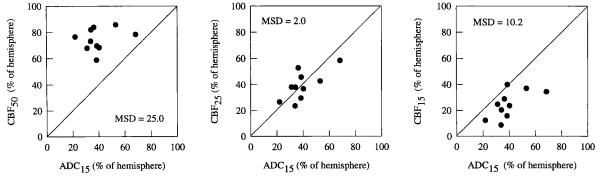
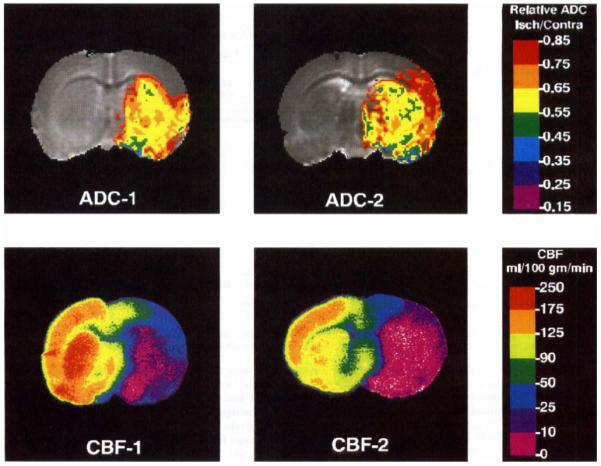
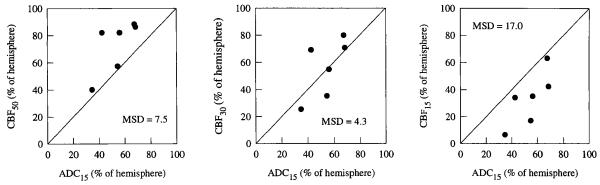
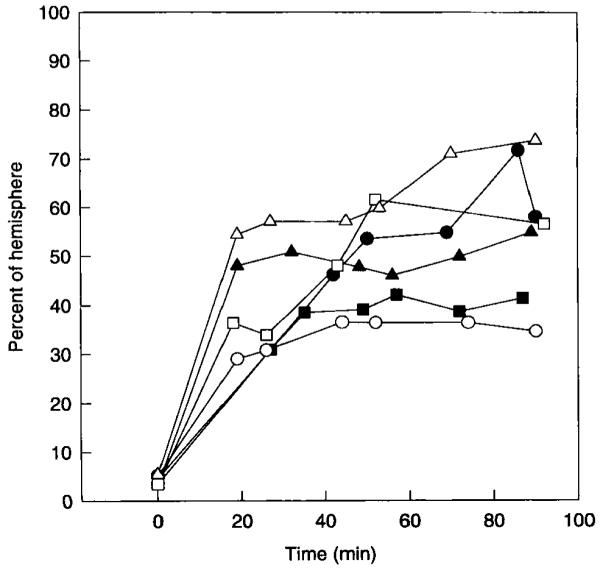
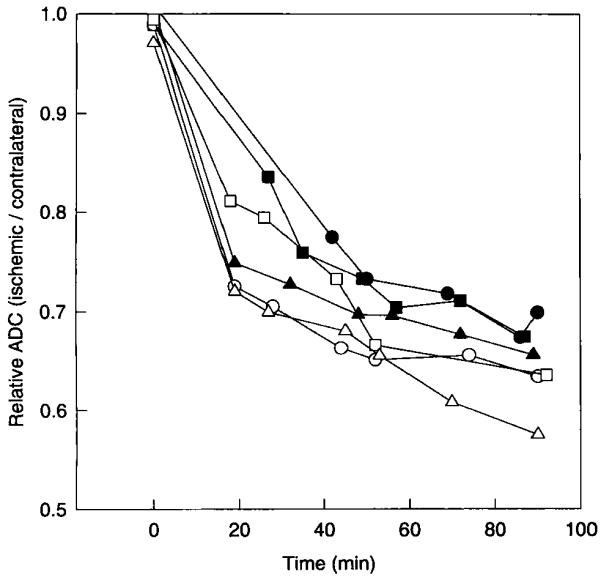
To determine the relationship between reductions in the apparent diffusion coefficient of water (ADC) and in cerebral blood flow (CBF) during focal ischemia, we used diffusion-weighted magnetic resonance (D-MR) imaging and autoradiographic CBF analysis to examine rats subjected to 30 or 90 min of permanent middle cerebral artery (MCA) occlusion. In the 30-min occlusion group (n = 10), the area with substantially reduced ADC (15% or more below the contralateral level [ADC15]) corresponded best to the area with CBF below 25 ml/100 g/min and was significantly smaller than the area with CBF below 50 ml/100 g/min (CBF50), a level associated with reduced protein synthesis and delayed necrosis (40 +/- 13% versus 74 +/- 8% of the ischemic hemisphere; P < 0.0001). In the 90-min occlusion group (n = 6), the ADC15 area corresponded best to the CBF30 to CBF35 area and was again significantly smaller than the CBF50 area (54 +/- 13% versus 73 +/- 20%, P < 0.05). Thus, the area of substantially reduced ADC at 30 and 90 min represents only 53% and 74%, respectively, of the tissue at risk for infarction. These findings indicate a potential limitation in using early D-MR imaging to predict stroke outcome.


Figures

FIG 1
FIG 1
T2-MR, D-MR, and absolute ADC images and ADC threshold map from a rat subjected to 90 min of MCA occlusion. The D-MR image was acquired with b = 2020 s/mm2. The ADC image was calculated from the T2 mage and three diffusion images acquired with b = 644, 1314, and 2020 s/mm2. The small artifact in the superior cortex of the left hemisphere in each image was produced by chemical-shift displacement of lipid signals from outside the brain. Similar artifacts were observed in all rats in this study. In the threshold map, gray pixels have ADC values within 10% of the average ADC of the non-ischemic hemisphere. The red region corresponds to areas with ADC values between 10 and 20% lower than this average. Each subsequent color represents a further 10% reduction.
FIG 2
FIG 2
ADC and CBF threshold maps from two rats subjected to 30 min of MCA occlusion. In the ADC map, the entire colored (non-gray) region represents the ADC15 area. For most of the rats subjected to 30 min of occlusion, the ischemic region was limited to the basal ganglia, as in the image on the left.
FIG 3
FIG 3
Correspondence between the ADC15 area and the CBF50, CBF25, and CBF15 areas in rats subjected to 30 min of MCA occlusion. The diagonal line represents the locus of points for perfect correspondence between the two measures of ischemic area.
FIG 4
FIG 4
ADC and CBF threshold maps for two rats subjected to 90 min of MCA occlusion. In the ADC map, the entire colored (non-gray) region represents the ADC15 area. In all of the rats subjected to 90 min of occlusion, the ischemic region extended into at least part of the cortex.
FIG 5
FIG 5
Correspondence between the ADC15 area and the CBF50, CBF30, and CBF15 area in rats subjected to 90 min of MCA occlusion. The diagonal line represents the locus of points for perfect correspondence between the two measures of ischemic area.
FIG 6
FIG 6
Expansion of the ADC15 area over time in rats subjected to 90 min of MCA occlusion. Each point in the graph was calculated from a T2 image and a single diffusion-weighted image. Each curve represents data from one rat.
FIG 7
FIG 7
Reduction in the average ADC in the ischemic region for all rats subjected to 90 min of MCA occlusion. The ischemic region was defined as the region exhibiting at least a 15% relative reduction in ADC by 90 min. Each point in the graph was calculated from a T2-weighted image and a single diffusion-weighted image. Each curve represents data from one rat.

Similar articles

Cited by

References

    1. Moseley ME, Kucharczyk J, Mintorovitch J, Cohen Y, Kurhanewicz J, Derugin N, Asgari H, Norman D. Diffusion-weighted MR imaging of acute stroke: correlation with T2-weighted and magnetic susceptibility-enhanced MR imaging in cats. AJNR. Am. 1. Neuroradiol. 1990;11:423–429. - PMC - PubMed
    1. Moseley ME, Cohen Y, Mintorovitch J, Chileuitt L, Shimizu H, Kucharczyk J, Wendland MF, Weinstein PR. Early detection of regional cerebral ischemia in cats: comparison of diffusion- and T2-weighted MRI and spectroscopy. Magn. Reson. Med. 1990;14:330–346. - PubMed
    1. Roussel SA, van Bruggen N, King MD, Houseman J, Williams SR, Gadian DG. Monitoring the initial expansion of focal ischaemic changes by diffusion-weighted MRI using a remote controlled method of occlusion. NMR Biomed. 1994;7:21–28. - PubMed
    1. Warach S, Chien D, Li W, Ronthal M, Edelman RR. Fast magnetic resonance diffusion-weighted imaging of acute human stroke. Neurology. 1992;42:1717–1723. Published erratum appears in Neurology 1992 Nov; 42(11), 2192. - PubMed
    1. Zhong J, Petroff 0A, Prichard JW, Gore JC. Changes in water diffusion and relaxation properties of rat cerebrum during status epilepticus. Magn. Reson. Med. 1993;30:241–246. - PubMed

Publication types