. 1995;4(3):125-41.

Identification of a stable RNA encoded by the H-strand of the mouse mitochondrial D-loop region and a conserved sequence motif immediately upstream of its polyadenylation site

Affiliations

Identification of a stable RNA encoded by the H-strand of the mouse mitochondrial D-loop region and a conserved sequence motif immediately upstream of its polyadenylation site

C Vijayasarathy et al. Gene Expr. 1995.

Abstract

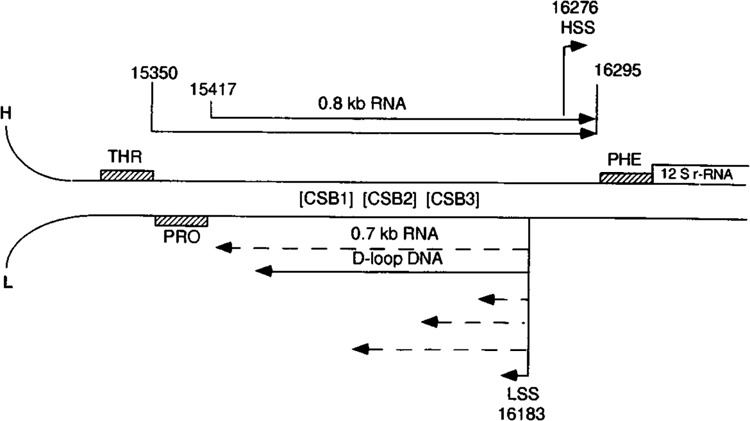
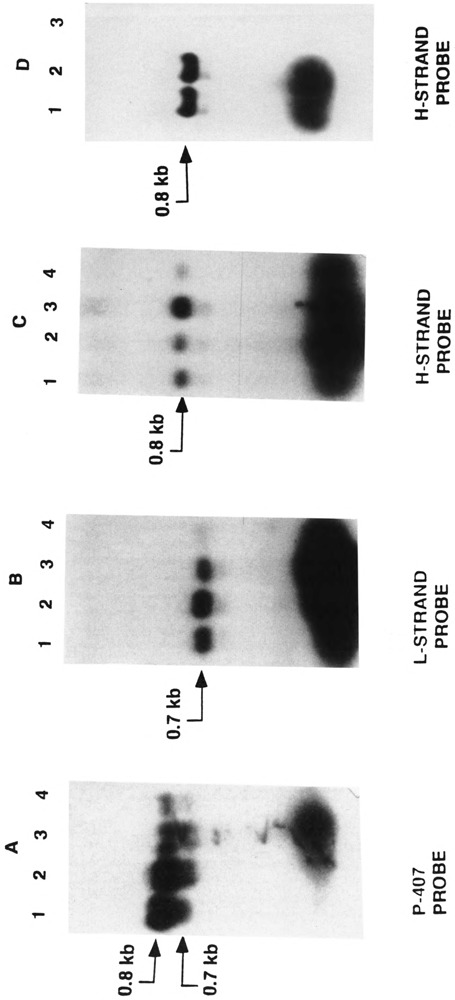
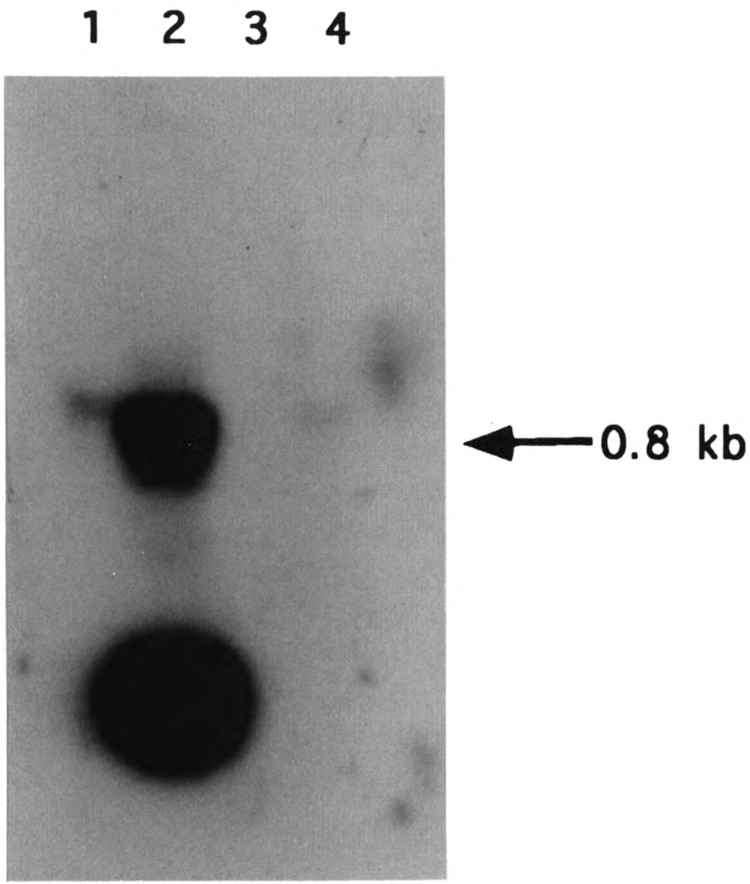
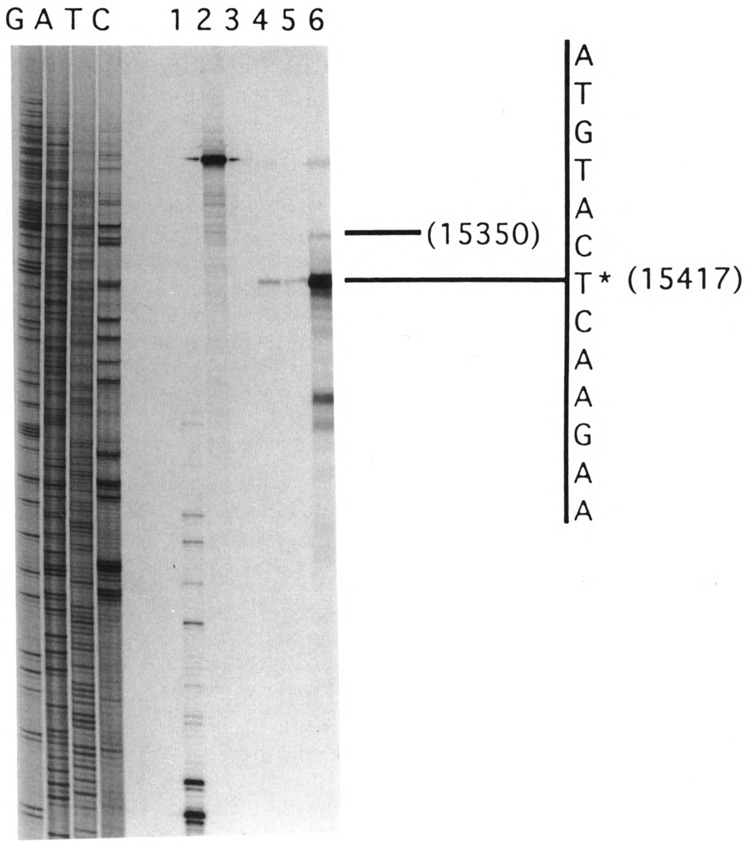
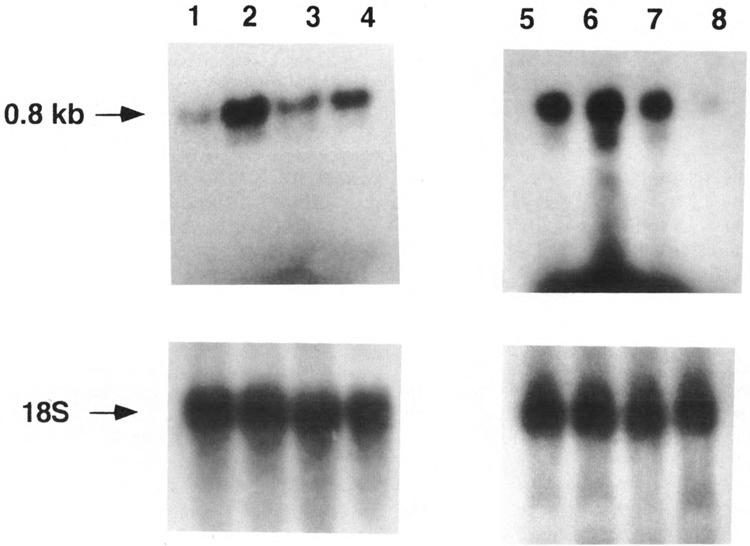
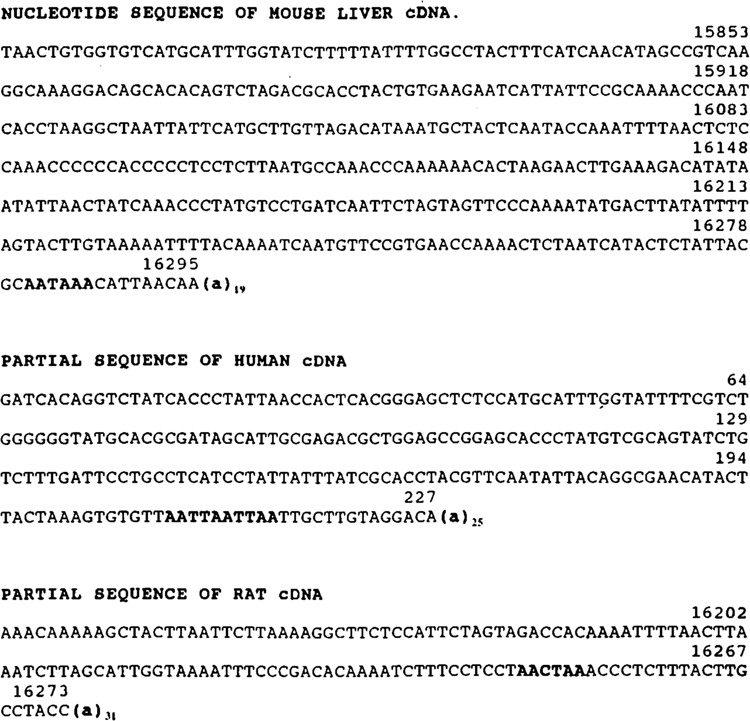
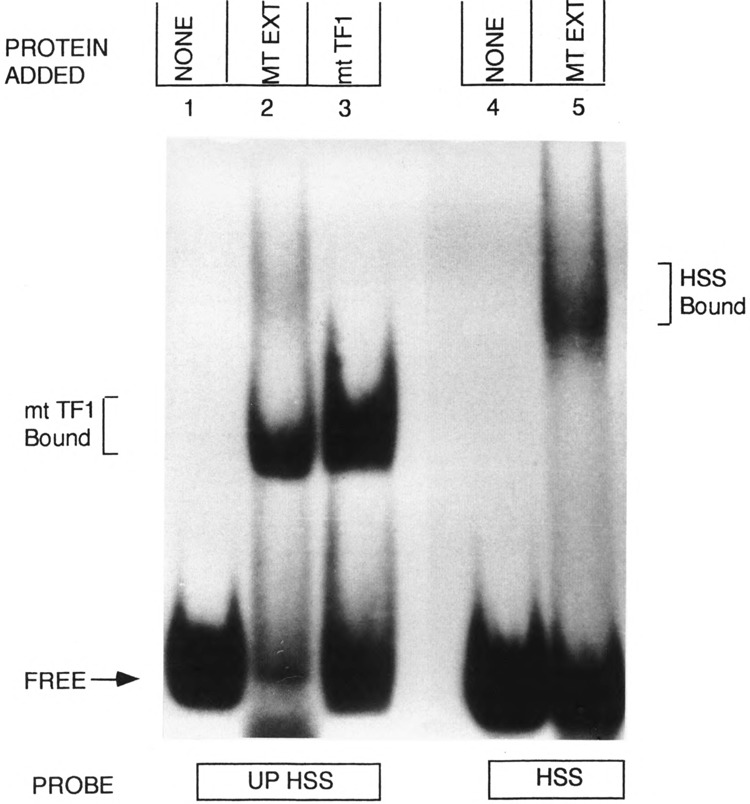
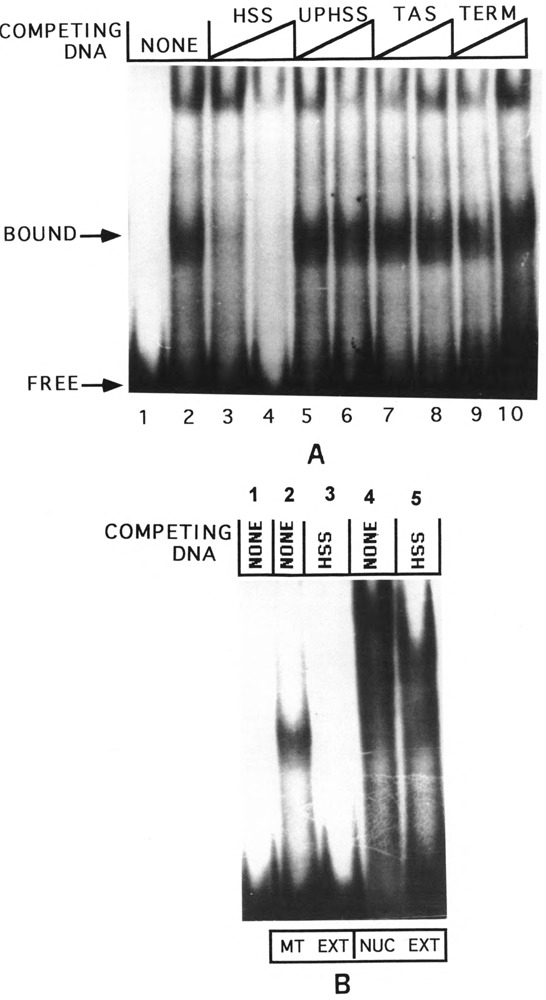
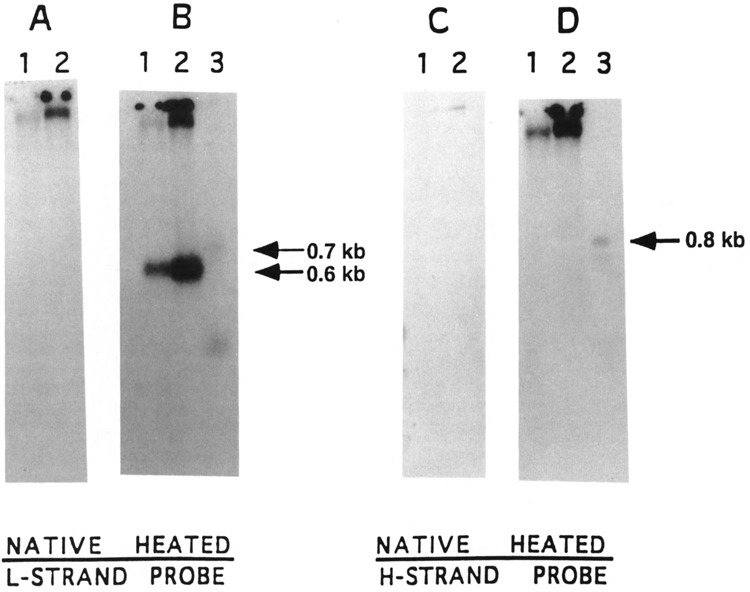
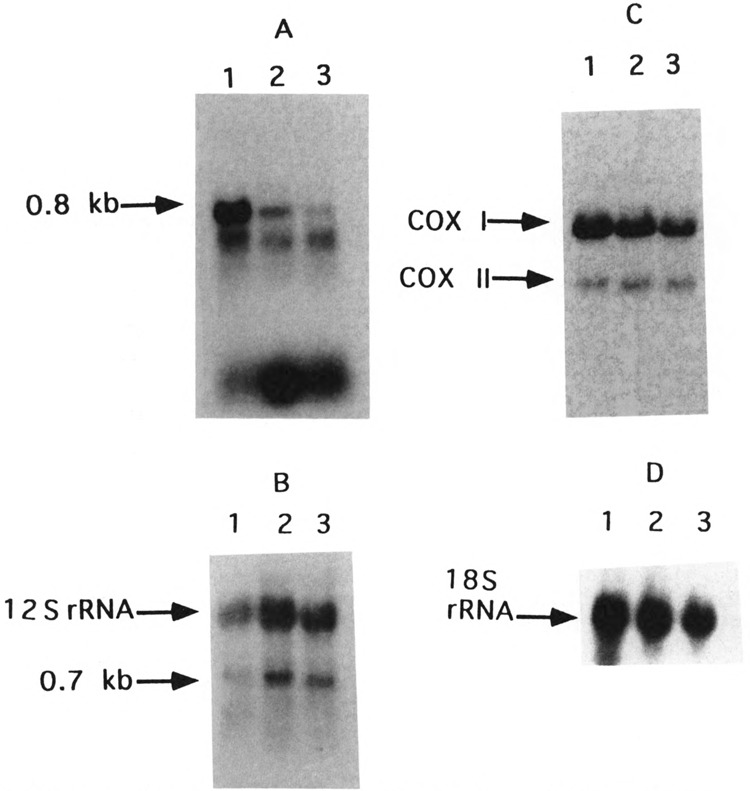
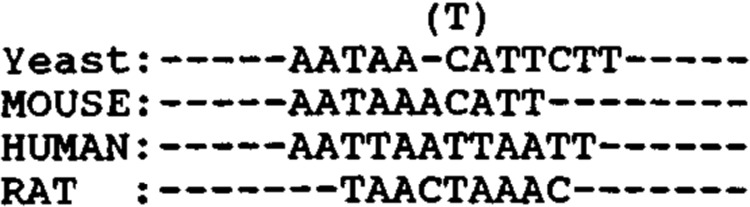
By using a combination of Northern blot hybridization with strand-specific DNA probes, S1 nuclease protection, and sequencing of oligo-dT-primed cDNA clones, we have identified a 0.8 kb poly(A)-containing RNA encoded by the H-strand of the mouse mitochondrial D-loop region. The 5' end of the RNA maps to nucleotide 15417, a region complementary to the start of tRNA(Pro) gene and the 3' polyadenylated end maps to nucleotide 16295 of the genome, immediately upstream of tRNA(Phe) gene. The H-strand D-loop region encoded transcripts of similar size are also detected in other vertebrate systems. In the mouse, rat, and human systems, the 3' ends of the D-loop encoded RNA are preceded by conserved sequences AAUAAA, AAUUAA, or AACUAA, that resemble the polyadenylation signal. The steady-state level of the RNA is generally low in dividing or in vitro cultured cells, and markedly higher in differentiated tissues like liver, kidney, heart, and brain. Furthermore, an over 10-fold increase in the level of this RNA is observed during the induced differentiation of C2C12 mouse myoblast cells into myotubes. These results suggest that the D-loop H-strand encoded RNA may have yet unknown biological functions. A 20 base pair DNA sequence from the 3' terminal region containing the conserved sequence motif binds to a protein from the mitochondrial extracts in a sequence-specific manner. The binding specificity of this protein is distinctly different from the previously characterized H-strand DNA termination sequence in the D-loop or the H-strand transcription terminator immediately downstream of the 16S rRNA gene. Thus, we have characterized a novel poly(A)-containing RNA encoded by the H-strand of the mitochondrial D-loop region and also identified the putative ultimate termination site for the H-strand transcription.


Figures

FIG. 1
FIG. 1
The genetic and transcriptional map of the mouse mitochondrial D-loop region. The precise map positions of the 0.8 kb H-strand coded RNA, heterogeneous size class of the L-strand coded RNAs, including the 0.7 kb RNAs (discontinuous lines) and the D-loop H-strand DNA of the mouse mitochondrial genome are presented. The map positions of the tRNAs and rRNAs are according to Bibb et al. (1981).
FIG. 2
FIG. 2
Northern blot hybridization of RNA with mouse mitochondrial D-loop DNA probes. The p-407 double-stranded DNA from the mouse mitochondrial D-loop region, and the strand-specific MIS DNA probes were labeled with 32P and used for hybridization with RNA from mouse Ehrlich ascites cells and different mouse tissues as described under Experimental Procedures. (A) Lane 1: RNA from mouse heart lane 2: mouse kidney, lane 3: mouse liver, and lane 4: Ehrlich ascites cells. (B,C) Lane 1: liver RNA, lane 2: kidney RNA, lane 3: heart RNA, and lane 4: Ehrlich ascites cell RNA. (D) The effects of DNAse and RNAse on the hybridization pattern were determined. Lane 1: untreated mouse liver RNA, lane 2: mouse liver RNA treated with two units of RQ1 DNAse, and lane 3: mouse liver RNA treated with one unit of pancreatic RNAse. Both DNAse and RNAse treatments were carried out on ice for 15 min prior to loading on the gel. RNA (30 μg) was loaded in each case. The amount of RNA in individual lanes did not vary more than 15% as judged by the ethidium bromide staining of the 18S and 28S rRNA bands. The RNA size was determined based on therelative migration of known molecular weight markers and was viewed by ethidium bromide staining. Lanes in (A) were hybridized with 32P-labeled p-407, double-stranded DNA probe, lanes in (B) were hybridized with the L-strand-specific M13 single-stranded DNA probe, and lanes in (C) and (D) were hybridized with the H-strand-specific M13 single-stranded DNA probe.
FIG. 3
FIG. 3
Subcellular location of the RNA hybridizing with the D-loop region H-strand probe. Total mouse liver RNA (25 μg) (lane 1) and RNA (25 μg) from mouse liver mitochondria (lane 2), cytosol (lane 3), and RNA (10 μg) from mouse liver nuclei (lane 4) were hybridized with the H-strand-specific M13 DNA probe as described in Fig. 2. Mitochondria were prepared by sucrose density banding as described under Experimental Procedures. The 100,000 × g supernatant fraction of the liver homogenate was used as the cytosolic fraction, and nuclei were prepared by sedimentation through 2.2 M sucrose in 20 mM Tris-Cl (pH 8.0), 0.5 mM CaCl2, and were used for RNA isolation.
FIG. 4
FIG. 4
The 5′ terminus of the D-loop region H-strand coded RNA. The 5′ terminus was mapped by S1 nuclease protection. The 301-nucleotide-long probe was prepared by the Klenow extension of the 5′ end-labeled S1 primer using p-644 template DNA as described under Experimental Procedures. About 60 μg of total cell RNA or 5 μg of poly(A) RNA was used for the S1 analysis. Lane 1: 105 cpm probe with no RNA and 50 units of S1, lane 2: 104 cpm of the probe and no S1, lanes 3–6: 2 × 105 cpm of the probe and 150 units of S1 and 60 μg yeast tRNA (lane 3), 60 μg mouse liver RNA (lane 4), 60 μg mouse kidney RNA (lane 5), and 5 μg of mouse liver poly(A) RNA (lane 6). The sequence ladder marked GATC was created using the S1 primer and p-644 template DNA.
FIG. 5
FIG. 5
Steady-state levels of the D-loop H-strand coded RNA in different species and different tissues. Preparation of the H-strand-specific M13 probe and details of Northern blot hybridization were as described in Fig. 2. Lane 1: Hela cell RNA, lane 2: rat liver RNA, lane 3: rat hepatoma RNA, lane 4: bovine liver RNA, lane 5: mouse liver RNA, lane 6: mouse heart RNA, lane 7: mouse brain RNA, and lane 8: RNA from mouse neuroblastoma cells. About 25 μg of RNA was loaded in each case and the loading level was verified by stripping the probes off the blots and rehybridizing with 32P-labeled 18S rRNA probe.
FIG. 6
FIG. 6
Identification of the 3′ end and polyadenylation sites of the H-strand encoded RNA by cDNA sequencing. cDNA libraries for the mouse, rat, and human liver RNA were screened using D-loop DNA probes and sequenced as described under Experimental Procedures. Partial sequence of all the three cDNAs are shown. The consensus polyadenylation sites and also the 3′ poly(A) tails are shown in bold letters.
FIG. 7
FIG. 7
Protein binding to the H-strand transcription termination region DNA. DNA-protein binding by gel mobility shift analysis was carried out using 32P-labeled UPHSS (lanes 1–3) and HSS DNA (lanes 4 and 5) as described under Experimental Procedures. Lanes 1 and 4 represent controls with no added protein. In lanes 2 and 5: μg of mouse liver mitochondrial protein, and in lane 3: 20 ng of bacterially expressed, purified human mtTF1 were used. Both the protein binding and the electrophoresis were carried out at 4°C.
FIG. 8
FIG. 8
Specificity of protein binding to the termination region DNA probe HSS. Details of gel mobility shift analysis using 32P-labeled HSS DNA probe were as described in Fig. 7. (A) Abilities of known protein binding motifs, UPHSS, TAS, and TERM, to compete for protein binding to HSS were compared. Lane 1 represents a control with no protein, and in lanes 2–10, 25 μg of liver mitochondrial protein were added. In lanes 3–10, 25- or 50-fold molar excess of unlabeled DNAs was added as follows: lanes 3 and 4: HSS DNA, lanes 5 and 6: UPHSS DNA, lanes 7 and 8: TAS DNA, and lanes 9 and 10: TERM DNA. (B) Protein binding patterns of HSS DNA probe with 25 μg of liver mitochondrial and nuclear protein extracts were compared. Lane 1: no protein added, lanes 2 and 3: mitochondrial extract, and lanes 4 and 5: nuclear extract. In lanes 3 and 5: 100 molar excess of unlabeled HSS DNA was added.
FIG. 9
FIG. 9
Mouse liver and kidney mitochondrial D-loop DNA analysis. DNA isolated from purified mouse liver (lane 1) and kidney (lane 2) mitochondria was analyzed for D-loop DNA and possible H-strand RNA by hybridization with the L- and H-strand-specific probes, respectively. (A,C) Native DNA samples (500 ng) and (B,D) heat-denatured DNA samples were used for electrophoresis on a 1.2% agarose gel. In both (B) and (D), lane 3 contained 30 μg of mouse liver RNA. Lanes in (A) and (B) were hybridized with the L-strand probe and those in (C) and (D) were hybridized with the H-strand-specific probe. The positions of D-loop DNA and the 0.7 kb RNA bands in (B) and the 0.8 kb RNA band in (D) are indicated by arrows.
FIG. 10
FIG. 10
Accumulation of the D-loop H-strand encoded RNA during myogenesis. C2C12 myoblasts were grown to confluency in DMEM high glucose medium containing 10% fetal calf serum and induced to form myotubes by supplementing the medium with 10% heat-inactivated horse serum according to the ATCC manual. RNA (30 μg each) from subconfluent (lane 3) and confluent (lane 2) myoblasts and induced myotubes (lane 1) was electrophoretically resolved in duplicates and blotted as described under Experimental Procedures. The blot in (A) was hybridized with 32P-labeled H-strand-specific probe. (B) The blot from (A) was stripped off the probe and rehybridized with a mixture of L-strand-specific probe and the mitochondrial 12S rRNA probe. (C) A representative blot as in (A) was hybridized with a mitochondrial DNA clone containing the COX I and COX II genes. (D) The blot from (C) was stripped off the probe and rehybridized with the cytoplasmic 18S rRNA probe. RNA contents between individual lanes and replicates varied by less than 10% as judged by ethidium bromide staining of the 18S and 28S rRNAs.
FIG. 11
FIG. 11
Nucleotide sequence similarities between the 3′ ends of the Yeast mitochondrial mRNA (Min and Zassenhaus, 1993) and the D-loop H-strand coded RNAs from different vertebrates.

Similar articles

Cited by

References

    1. Aloni Y. and Attardi G. (1971), J Mol Biol 28, 251–267. - PubMed
    1. Anderson S., Bankier A. T., Barrell B. G., de-Bruijn M. H., Coulson A. R., Drouin J., Eperon I. C., Nierlich D. P., Roe B. A., Sanger F., Schreier P. H., Smith A. J., Staden R., and Young I. G. (1981), Nature 290, 457–465. - PubMed
    1. Anderson S., de-Bruijn M. H., Coulson A. R., Eperon I. C., Sanger F., and Young I. G. (1982), J Mol Biol 156, 683–717. - PubMed
    1. Annex H. B. and Williams R. S. (1990), Mol Cell Biol 10, 5671–5678. - PMC - PubMed
    1. Attardi G. and Schatz G. (1988), Annu Rev Cell Biol 4, 289–333. - PubMed

Publication types

MeSH terms

LinkOut - more resources