Review
. 1976 Apr;6(2):141-61.
doi: 10.1016/s0001-2998(76)80002-5.

Estimation of blood flow with radioactive tracers

Review

Estimation of blood flow with radioactive tracers

J B Bassingthwaighte et al. Semin Nucl Med. 1976 Apr.

Abstract

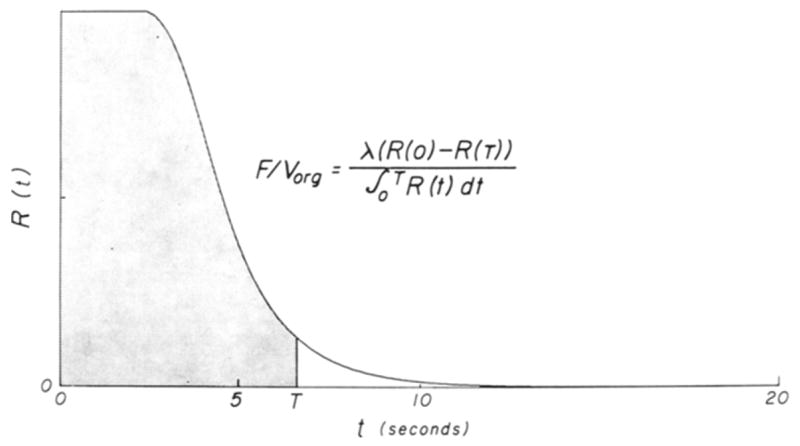
The techniques of tracer dilution in the circulation, and of tracer uptake by and washout from an orgen, may be described using expressions that are general and are not dependent on specific models such as exponentials. The expressions have been applied to the measurement of cardiac output using impulse and constant rate injection techniques. Further expressions have been given for estimating organ blood flow from inflow/outflow concentration-time curves, and from the distribution of deposited tracer. Some problems with respect to the use of deposition techniques as they are ordinarily applied to the estimation of regional blood flow must be considered, particularly when there are capillary beds in series or where there is countercurrent diffusional shunting of diffusible tracers between inflow and outflow. This review deals with these various aspects of tracer theory as they relate to the measurement of blood flow.


Figures

Fig. 1
Fig. 1
Diagram of experimental approach to measuring the response of a system to a slug or impulse injection of tracer of dose q0 The striped cylinders represent isotope detectors: The signal provided by the left-most detector is proportional to the amount of indicator q(t) contained in the volume V and is proportional to the residue function R(t). The upper detector, on the outflow, provides the impulse response h(t). In the idealized nonrecirculating system diagrammed here, the accumulated outflow is estimated via the right-most detector, and gives a signal proportional to H(t), the cumulative residence time distribution function.
Fig. 2
Fig. 2
Relationships between h(t), H(t), R(t), and η(t). These curves have shapes representative of those obtained across organ beds or through particular segments of the arterial or venous circulation. Note that h(t) and R(t) are not monoexpenential. The abscissa is the time relative to the mean transit time through the system. The ordinate of the left-lower panel for η(t) is scaled up by the mean transit time so that it has become dimensionless on this plot. During the level portion of the curve of η(t), the value for t̄ · η(t) is 0.34, showing that approximately one-third of the tracer will leave per mean transit time.
Fig. 3
Fig. 3
Tracer-dilution curve with monoexponential extrapolation. The curve of tracer passing the sampling site for the first time (not recirculating) is termed the primary curve, the tail of which is approximated by a monoexponential extrapolation of the downslope, as was used by Hamilton et al. in 1931. The equation for flow uses the area under the primary curve.
Fig. 4
Fig. 4
The area under the residue function is the mean transit time. Curves A, B, and C have the same area and same t̄. Curve C represents a system having all transit times the same, as in piston flow.
Fig. 5
Fig. 5
Modification of the residue function technique for obtaining an approximate estimate of mean transit time, using early truncation of the curve to avoid recirculation. t̄ = [area up to time T]/[1 − R(T)].
Fig. 6
Fig. 6
(A) Constant rate iniection technique for the estimation of flow. The infusion starts at time zero and ends at tend. Flow can be estimated either from the concentration at the plateau, Cp, and a known constant rate of injection, dmi/dt or by the single injection formula, Eqs. [12] or [22]; q0 is the total amount of tracer injected during the constant rate injection, and is tend times dmi/dt. The diagram is for a nonrecirculating system. (B) The presence of recirculated tracer during the constant rate injection deforms the curve and reduces the accuracy of the technique. Cr(t) is the concentration of recirculated tracer just upstream from the site of the constant rate injection, Ca(t) is the concentration at the inflow which is composed of the injected tracer plus the recirculated tracer so that it rises slowly, more or less as a ramp. The concentration-time curve in the venous outflow, Cv(t), reaches a plateau, Cp, for a very brief period indicated by the bar, and then rises slowly from the plateau as a ramp delayed from Ca(t) by one mean transit time. The correct estimate of Cp during the period of recirculation is the difference between Cv(t) and Cr(t − t̄), which is Cr(t) at the injection point delayed by one mean transit time. Calculating the area under Cv(t) is difficult, but if the recirculated curve, Cr(t), is known it can be shifted one transit time to the right and subtracted from the area under Cv(t).
Fig. 7
Fig. 7
External detection with constant rate injection into a nonrecirculating system. The intersection of the initial slope (dashed line) with the plateau, q, is at t = t̄. The curved portion of q(t)/q (thick line) gives information on the shape of h(t) and of the dispersion of transit times through the system. (This is analogous to the frequency distribution of ratios of renal filtration of glucose to its tubular reabsorption maximum, Tm, as shown by Smith et al. in 1943.17)
Fig. 8
Fig. 8
Flow estimation from analysis of recorded input and output following step injection. At steady state, C = Cv(∞) = Ca (∞).
Fig. 9
Fig. 9
Combined intravascular and external detection. External detection provides t̄ and the slope dR/dt at a particular time ts. Sampling from the venous outflow from the organ at ts provides the concentration Cv(ts). The combination allows estimation of F, F/V, and therefore of V.
Fig. 10
Fig. 10
Parallel pathway system, fi is the fraction of the total flow going through the ith pathway, qi is the amount of tracer deposited in region i where extraction is complete.
Fig. 11
Fig. 11
Injection of completely extracted tracers into left ventricle during constant rate sampling from an artery. The quantity of microspheres in the syringe, qs, is the same fraction of the total injectate, q0, as is the syringe flow Fs of the cardiac output, FT.

References

    1. Zierler KL. Circulation times and the theory of indicator-dilution methods for determining blood flow and volume. In: Hamilton WF, Dow P, editors. Handbook of Physiology, vol 1, Section 2, Circulation. Washington, DC: American Physiological Society; 1962. p. 585.
    1. Zierler KL. Equations for measuring blood flow by external monitoring of radioisotopes. Circ Res. 1965;16:309. - PubMed
    1. González-Fernández JM. Theory of the measurement of the dispersion of an indicator in indicator-dilution studies. Circ Res. 1962;10:409. - PubMed
    1. Wood EH. Definitions and symbols for terms commonly used in relation to indicator-dilution curves. Circ Res. 1962;10:379.
    1. Bassingthwaighte JB, Chinard FP, Crone C, et al. Definitions and terminology for indicator dilution methods. In: Crone C, Lassen NA, editors. Capillary Permeability (Alfred Benzon Symposium II) Copenhagen: Ejnar Munksgaard; 1970. p. 665.

Publication types

LinkOut - more resources