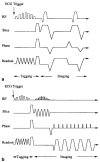
Multi-shot EPI for improvement of myocardial tag contrast: comparison with segmented SPGR
- PMID: 7760715
- PMCID: PMC2396266
- DOI: 10.1002/mrm.1910330321
Multi-shot EPI for improvement of myocardial tag contrast: comparison with segmented SPGR
Abstract
To assess the potential value of multi-shot EPI relative to segmented k-space SPGR for myocardial tagging, we measured tag contrast for both sequences in a phantom and human study and compared it with theoretical predictions. In the human heart, EPI tag contrast was three times that of SPGR at the end of systole. Tag duration was lengthened with EPI to at least 600 ms. In addition, the entire heart was examined in a total of 32 heartbeats with EPI versus 152 heartbeats with SPGR.
Figures


Similar articles
-
Single-shot-double-echo EPI.Magn Reson Imaging. 1994;12(7):1033-8. doi: 10.1016/0730-725x(94)91234-n. Magn Reson Imaging. 1994. PMID: 7997090
-
Readout-segmented echo-planar imaging in the evaluation of sinonasal lesions: A comprehensive comparison of image quality in single-shot echo-planar imaging.Magn Reson Imaging. 2016 Feb;34(2):166-72. doi: 10.1016/j.mri.2015.10.010. Epub 2015 Nov 2. Magn Reson Imaging. 2016. PMID: 26541548
-
A magnetization-driven gradient echo pulse sequence for the study of myocardial perfusion.Magn Reson Med. 1995 Aug;34(2):276-82. doi: 10.1002/mrm.1910340220. Magn Reson Med. 1995. PMID: 7476088 Free PMC article.
-
K-space in the clinic.J Magn Reson Imaging. 2004 Feb;19(2):145-59. doi: 10.1002/jmri.10451. J Magn Reson Imaging. 2004. PMID: 14745747 Review.
-
Spiral imaging: a critical appraisal.J Magn Reson Imaging. 2005 Jun;21(6):657-68. doi: 10.1002/jmri.20320. J Magn Reson Imaging. 2005. PMID: 15906329 Review.
Cited by
-
Multi-echo segmented k-space imaging: an optimized hybrid sequence for ultrafast cardiac imaging.Magn Reson Med. 1999 Feb;41(2):375-85. doi: 10.1002/(sici)1522-2594(199902)41:2<375::aid-mrm23>3.0.co;2-z. Magn Reson Med. 1999. PMID: 10080287 Free PMC article.
-
Quantification of regional myocardial wall motion by cardiovascular magnetic resonance.Quant Imaging Med Surg. 2014 Oct;4(5):345-57. doi: 10.3978/j.issn.2223-4292.2014.09.01. Quant Imaging Med Surg. 2014. PMID: 25392821 Free PMC article. Review.
-
In vivo measurement of T*2 and field inhomogeneity maps in the human heart at 1.5 T.Magn Reson Med. 1998 Jun;39(6):988-98. doi: 10.1002/mrm.1910390617. Magn Reson Med. 1998. PMID: 9621923 Free PMC article.
-
Advances in MRI tagging techniques for determining regional myocardial strain.Curr Cardiol Rep. 2006 Feb;8(1):53-8. doi: 10.1007/s11886-006-0011-4. Curr Cardiol Rep. 2006. PMID: 16507237 Review.
-
Improved real-time tagged MRI using REALTAG.Magn Reson Med. 2020 Aug;84(2):838-846. doi: 10.1002/mrm.28144. Epub 2019 Dec 24. Magn Reson Med. 2020. PMID: 31872918 Free PMC article.
References
-
- Zerhouni EA, Parish DM, Rogers WJ, Yang A, Shapiro EP. Human heart: tagging with MR imaging-method for noninvasive assessment of myocardial motion. Radiology. 1988;169:59. - PubMed
-
- Axel L, Dougherty L. MR imaging of motion with spatial modulation of magnetization. Radiology. 1989;171:841–849. - PubMed
-
- Young AA, Axel L, Dougherty L, Bogen DK, Parenteau CS. Validation of tagging with MR imaging to estimate material deformation. Radiology. 1993;188(1):101–108. - PubMed
-
- Atkinson DJ, Edelman RR. Cineangiography of the heart in a single breath hold with a segmented turbo FLASH sequence. Radiology. 1991;178:357–360. - PubMed
Publication types
MeSH terms
Grants and funding
LinkOut - more resources
Full Text Sources

