

Temporal expression of regulatory and structural muscle proteins during myogenesis of satellite cells on isolated adult rat fibers
- PMID: 7913900
- PMCID: PMC4128087
- DOI: 10.1006/dbio.1994.1226
Temporal expression of regulatory and structural muscle proteins during myogenesis of satellite cells on isolated adult rat fibers
Abstract
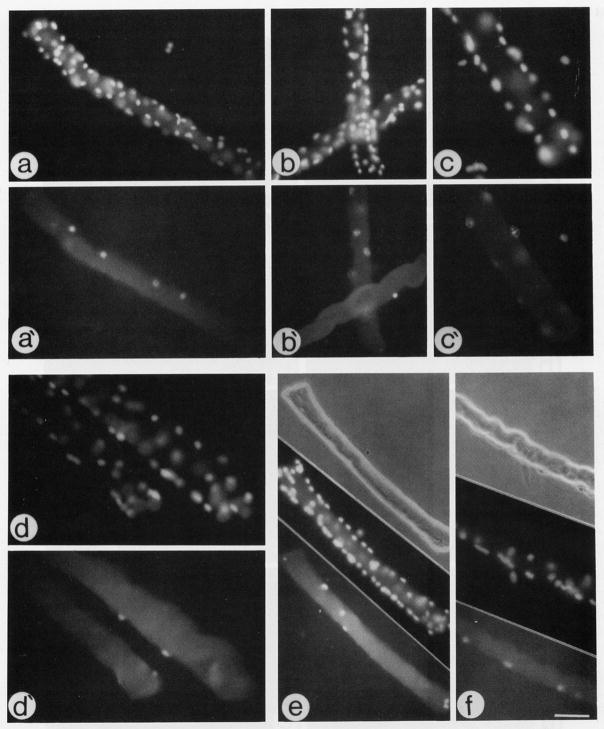
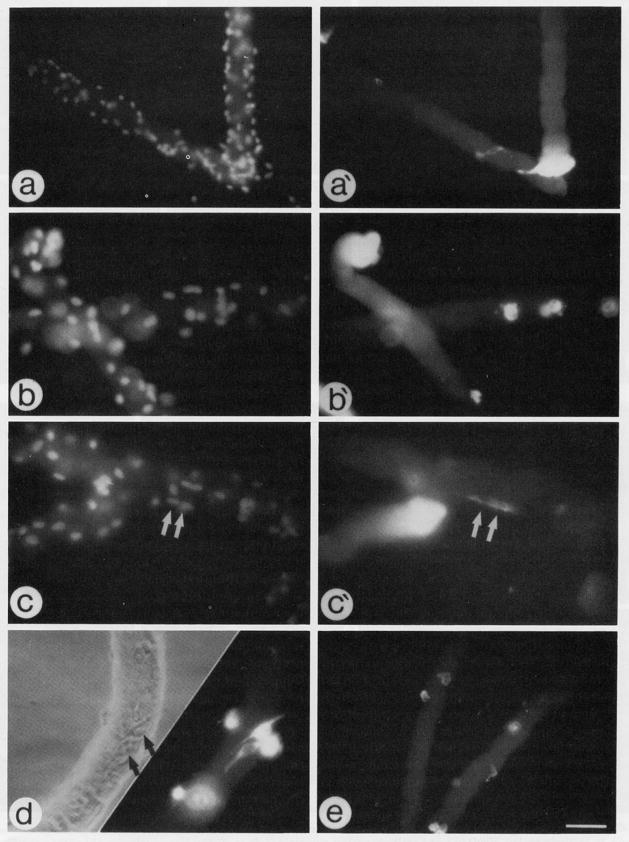
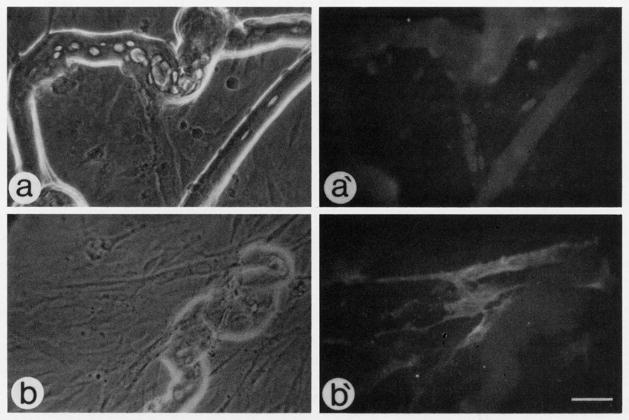
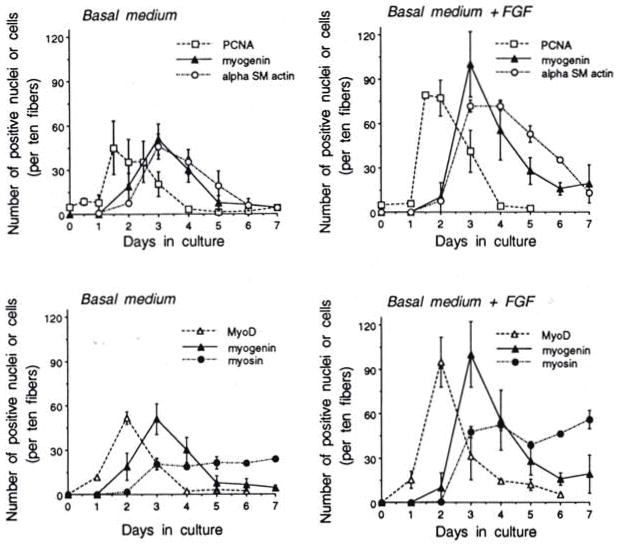
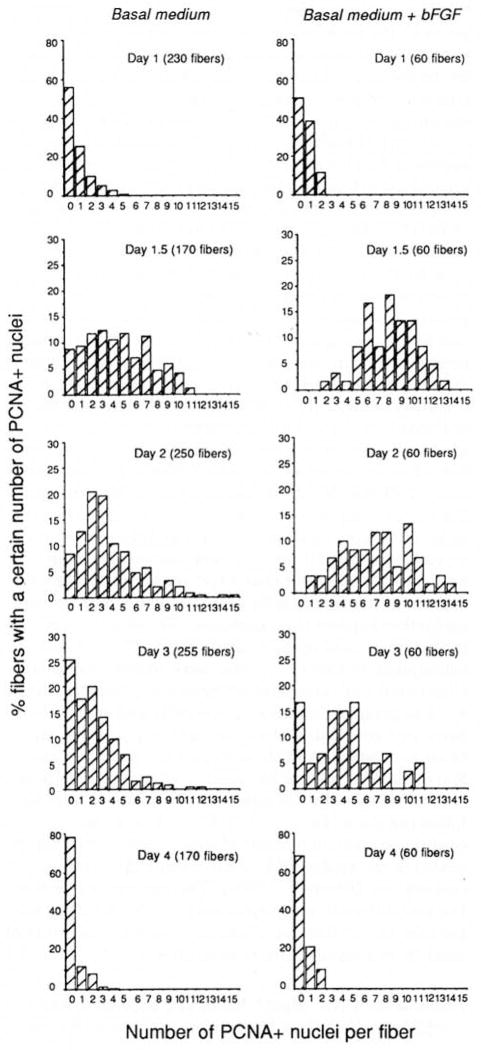
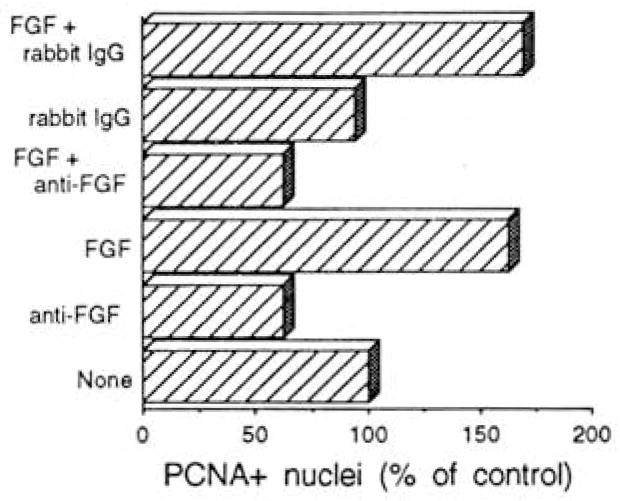
Myogenic precursors in adult skeletal muscle (satellite cells) are mitotically quiescent but can proliferate in response to a variety of stresses including muscle injury. To gain further understanding of adult myoblasts, we analyzed myogenesis of satellite cells on intact fibers isolated from adult rat muscle. In this culture model, satellite cells are maintained in their in situ position underneath the fiber basement membrane. In the present study patterns of satellite cell proliferation, expression of myogenic regulatory factor proteins, and expression of differentiation-specific, cytoskeletal proteins were determined, via immunohistochemistry of cultured fibers. The temporal appearance and the numbers of cells positive for proliferating cell nuclear antigen (PCNA) or for MyoD were similar, suggesting that MyoD is present in detectable amounts in proliferating but not quiescent satellite cells. Satellite cells positive for myogenin, alpha-smooth muscle actin (alpha SMactin), or developmental sarcomeric myosin (DEVmyosin) appeared following the decline in PCNA and MyoD expression. However, expression of myogenin and alpha SMactin was transient, while DEV-myosin expression was continuously maintained. Moreover, the number of DEVmyosin + cells was only half of the number of myogenin + or alpha SMactin + cells--indicating, perhaps, that only 50% of the satellite cell descendants entered the phase of terminal differentiation. We further determined that the number of proliferating satellite cells can be modulated by basic FGF but the overall schedule of cell cycle entry, proliferation, differentiation, and temporal expression of regulatory and structural proteins was unaffected. We thus conclude that satellite cells conform to a highly coordinated program when undergoing myogenesis at their native position along the muscle fiber.
Figures
Similar articles
-
Fibroblast growth factor promotes recruitment of skeletal muscle satellite cells in young and old rats.J Histochem Cytochem. 1999 Jan;47(1):23-42. doi: 10.1177/002215549904700104. J Histochem Cytochem. 1999. PMID: 9857210
-
Proliferative Dynamics and the Role of FGF2 During Myogenesis of Rat Satellite Cells on Isolated Fibers.Basic Appl Myol. 1997;7(3-amp4):189-202. Basic Appl Myol. 1997. PMID: 26052220 Free PMC article.
-
The transition from proliferation to differentiation is delayed in satellite cells from mice lacking MyoD.Dev Biol. 1999 Jun 15;210(2):440-55. doi: 10.1006/dbio.1999.9284. Dev Biol. 1999. PMID: 10357902 Free PMC article.
-
Growth hormone and the insulin-like growth factor system in myogenesis.Endocr Rev. 1996 Oct;17(5):481-517. doi: 10.1210/edrv-17-5-481. Endocr Rev. 1996. PMID: 8897022 Review.
-
Development and postnatal regulation of adult myoblasts.Microsc Res Tech. 1995 Apr 1;30(5):366-80. doi: 10.1002/jemt.1070300504. Microsc Res Tech. 1995. PMID: 7787236 Free PMC article. Review.
Cited by
-
Satellite cell dysfunction and impaired IGF-1 signaling cause CKD-induced muscle atrophy.J Am Soc Nephrol. 2010 Mar;21(3):419-27. doi: 10.1681/ASN.2009060571. Epub 2010 Jan 7. J Am Soc Nephrol. 2010. PMID: 20056750 Free PMC article.
-
Diagnostic protein expression in human muscle biopsies.Brain Pathol. 2000 Apr;10(2):193-214. doi: 10.1111/j.1750-3639.2000.tb00254.x. Brain Pathol. 2000. PMID: 10764040 Free PMC article. Review.
-
The expression profile of myogenic transcription factors in satellite cells from denervated rat muscle.Brain Pathol. 2002 Apr;12(2):170-7. doi: 10.1111/j.1750-3639.2002.tb00431.x. Brain Pathol. 2002. PMID: 11958370 Free PMC article.
-
Thermal stress affects proliferation and differentiation of turkey satellite cells through the mTOR/S6K pathway in a growth-dependent manner.PLoS One. 2022 Jan 13;17(1):e0262576. doi: 10.1371/journal.pone.0262576. eCollection 2022. PLoS One. 2022. PMID: 35025965 Free PMC article.
-
The influence of extracellular matrix derived from skeletal muscle tissue on the proliferation and differentiation of myogenic progenitor cells ex vivo.Biomaterials. 2009 Apr;30(12):2393-9. doi: 10.1016/j.biomaterials.2008.12.069. Epub 2009 Jan 24. Biomaterials. 2009. PMID: 19168212 Free PMC article.
References
-
- Allen RE, Boxhorn LK. Regulation of skeletal muscle satellite cell proliferation and differentiation by transforming growth factor-beta, insulin-like growth factor I, and fibroblast growth factor. J Cell Physiol. 1989;138:311–315. - PubMed
-
- Anderson JE, Liu L, Kardami E. Distinctive patterns of basic fibroblast growth factor (bFGF) distribution in degenerative and regenerative areas of dystrophic (mdx) striated muscles. Dev Biol. 1991;147:96–109. - PubMed
-
- Antonio J, Gonyea WJ. Skeletal muscle fiber hyperplasia. Med Sci Sports Exercise. 1993;25:1333–1345. - PubMed
-
- Babai F, Musevi-Aghdam J, Schurch W, Royal A, Gabbiani G. Coexpression of α-sarcomeric actin, α-smooth muscle actin and desmin during myogenesis in rat and mouse embryos. I Skeletal muscle. Differentiation. 1990;44:132–142. - PubMed
Publication types
MeSH terms
Substances
Grants and funding
LinkOut - more resources
Full Text Sources
Other Literature Sources
Miscellaneous
