. 1994 Dec;13(6):1403-12.
doi: 10.1016/0896-6273(94)90425-1.

Elimination of rapid potassium channel inactivation by phosphorylation of the inactivation gate

Affiliations

Elimination of rapid potassium channel inactivation by phosphorylation of the inactivation gate

M Covarrubias et al. Neuron. 1994 Dec.

Abstract

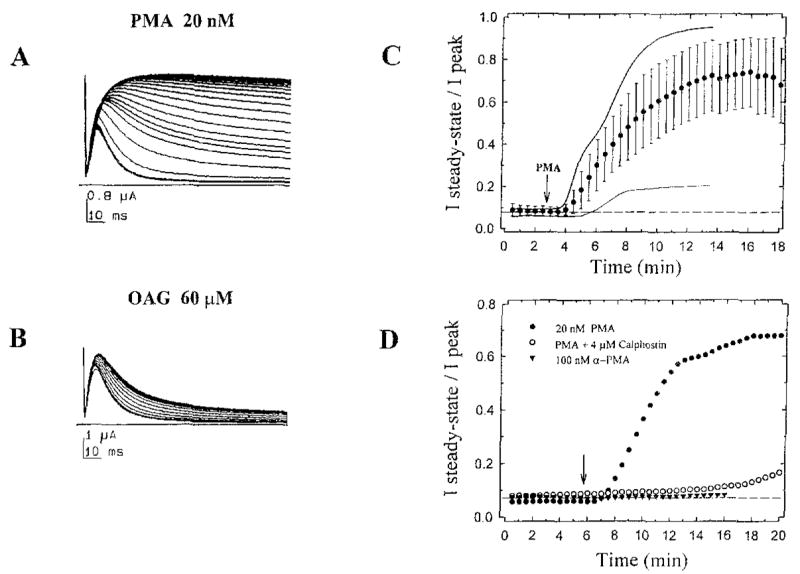
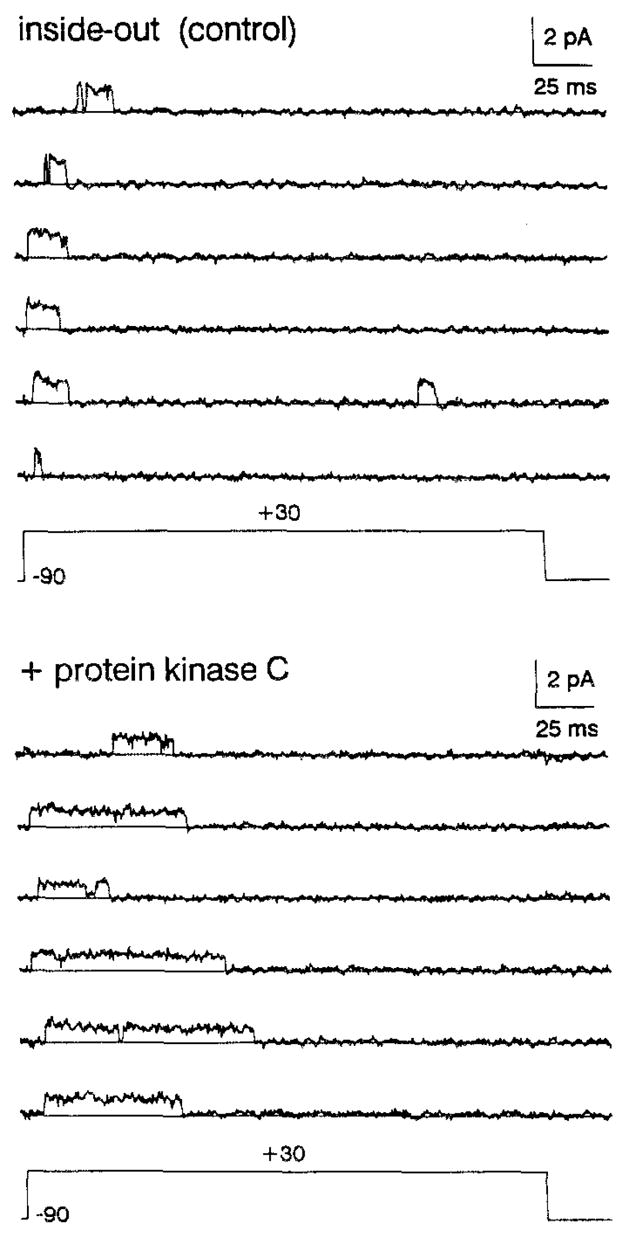
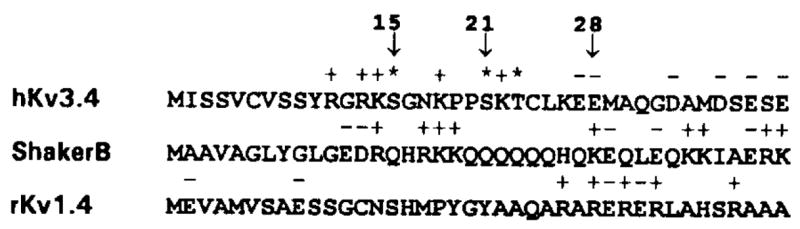
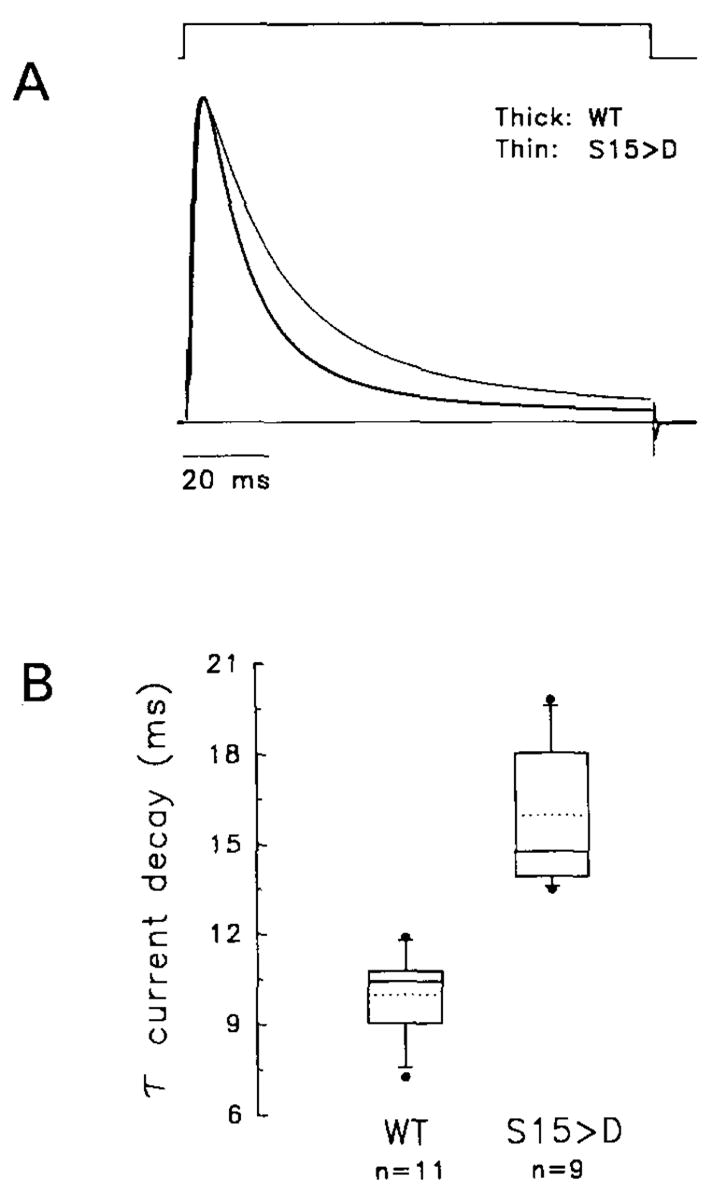
The effect of protein kinase C (PKC) on rapid N-type inactivation of K+ channels has not been reported previously. We found that PKC specifically eliminates rapid inactivation of a cloned human A-type K+ channel (hKv3.4), converting this channel from a rapidly inactivating A type to a noninactivating delayed rectifier type. Biochemical analysis showed that the N-terminal domain of hKv3.4 is phosphorylated in vitro by PKC, and mutagenesis experiments revealed that two serines within the inactivation gate at the N-terminus are sites of direct PKC action. Moreover, mutating one of these serines to aspartic acid mimics the action of PKC. Serine phosphorylation may thus prevent rapid inactivation by shielding basic residues known to be critical to the function of the inactivation gate. The regulatory mechanism reported here may have substantial effects on signal coding in the nervous system.


Figures

Figure 1
Figure 1. Rapid Inactivation of hKv3.4 K+ Channels Expressed in Xenopus Oocytes
(A) Whole-oocyte outward K+ currents were elicited by 112 ms step depolarizations between −50 and +50 mV in 10 mV increments from a holding potential of −100 mV. Inset shows that current inactivation is well described as an exponential decay (decaying solid line) with a time constant (τ) of 9.6 ms at +50 mV. When whole-oocyte currents were >10 μA (at +50 mV), a second small component (<10%) with slower time constant (~50 ms) was needed to describe current decay. (B) τ of current inactivation at +50 mV is plotted as a function of peak current (to represent level of expression; n = 20 cells from four separate batches of oocytes). Dotted line represents the average value. (C) Macroscopic outward K+ current recorded from a cell-attached macropatch. Response was elicited by a 220 ms step depolarization to +30 mV from a holding potential of −90 mV. The smooth line across the current trace represents the best exponential fit with a τ of 16 ms. This compares with a τ of 13 ms determined from whole-oocyte currents at +30 mV. (D) Whole-oocyte outward currents elicited by 900 ms step depolarizations between −30 and +50 mV in 20 mV increments, from a holding potential of −100 mV for wild-type (WT) and ΔN28 (deletion mutant removing the first 28 amino acids; see Figure 5).
Figure 2
Figure 2. Effect of PKC Activators on Inactivation of Whole-Oocyte K+ Currents Expressed by hKv3.4
(A) Consecutive whole-oocyte current responses (32) elicited by repetitive 112 ms step depolarizations to +30 rnV from a holding potential of −100 mV, at 30 s intervals. After 10 control responses in normal bath solution (under continuous bath perfusion), the oocyte was bathed in normal bath solution plus 20 nM PMA. (B) Same as in (A) but adding 60 μM OAG, Both compounds induced a time-dependent inhibition of current inactivation. To apply activators, the chamber (volume ~ 350 μl) was perfused at a rate of 3–4 ml/min. PMA and OAG dilutions were prepared immediately before the experiments from concentrated stock solutions (dimethylsulfoxide solutions stored at −20°C). (C) Time course of the effect of PKC activators. From each current trace, we measured peak (Ipeak) and steady-state (Isteady-state) amplitudes (the apparent steady-state current was measured as the average of the last 10 points in a trace). Thus, Isteady-state/Ipeak is a measure of the fraction of current that does not inactivate at the end of a 112 ms step depolarization. This variable was then plotted against recording time. Graph shows the average time course from 12 independent experiments (each point [closed circles] and corresponding bars represent the mean ± SD). Dashed line represents the average Isteady-state/Ipeak before PMA (<10 % ). For comparison, the time courses of experiments shown in (A) and (B) are plotted here too (PMA, thick solid line; OAG, thin solid line). (D) As described above, experiments were conducted in three different conditions (additions at the arrow): 20 nM PMA alone (closed circles), 20 nM PMA plus 4 μM calphostin C (open circles), and 100 nM α-PMA alone (closed triangles). Calphostin C was illuminated under standard fluorescent light for ~1 hr before the experiment and incubated for 7.5 min with the oocyte, before PMA application (inhibitor was present throughout the rest of the experiment). Calphostin C by itself did not affect kinetics or amplitude of currents.
Figure 3
Figure 3. Effect of PKC on Single-Channel Outward Currents in an Inside-Out Patch Expressing a Single hKv3.4 K+ Channel
Currents were elicited by 250 ms step depolarizations from −90 to +30 mV at intervals of 5 s. Records were low-pass filtered at 1 kHz and sampled at 250 μs per point. In a total of 32 consecutive records (including cell-attached period), no overlapping events were seen. To test the action of PKC, the cytoplasmic side of the patch was perfused with high calcium intracellular solution supplemented with 1 μM brain phosphatidylserine, 1 μM diacyl-glycerol, 1 mM ATP, and ~10 pM purified brain PKC. PKC recording was taken ~3 min after application of the enzyme (the latency of PKC action in this patch). Pipette solution contained 140 mM NaCl, 6 mM MgCl2, and 5 mM HEPES (pH 7.2}. Intracellular bath solution contained 140 mM KCl, 2 mM MgCl2, 1 mM CaCl2, 11 mM EGTA, and 10 mM HEPES (pH 7.2). High calcium intracellular solution contained 140 mM KCl, 2 mM MgCl2, 1.5 mM CaCl2, 1 mM EGTA, and 10 mM HEPES (pH 7.2). Intracelluar solutions were supplemented with 5 mM glutathioneto prevent inhibition of inactivation owing to cysteine oxidation (see Experimental Procedures). All were titrated to the indicated pH with N-methyl-D-glucamine.
Figure 4
Figure 4. Effect of PKC Activation on A-Type K+ Currents Expressed in Xenopus Oocytes
(B–D) Whole-oocyte outward K+ currents elicited by 450 ms step depolarizations to +40 mV from a holding potential of −100 mV. Currents are shown before and after bath application of 20 nM PMA. The effect of PMA reached a maximum within 5–10 min (see below). To investigate an effect on current kinetics, traces were scaled to match their peak current (insets) (A) Time course of experiments shown in (B), (C), and (D). This was measured as described in Figure 2, except that only peak current was measured. For comparison, this variable was normalized to the averaged peak amplitude before PMA.
Figure 5
Figure 5. Comparison of the Amino Acid Sequence at the N-Terminus of Three A-Type K+ Channels
To compare the primary structures of inactivation gates of three A-type K+ channels, we show the first 40 amino acids at the N-termini of hKv3.4, Shaker B, and rKv4.1. Basic and acidic amino acids are indicated above the corresponding sequence by a positive or negative sign, respectively. Potential PKC phosphorylation sites in hKv3.4 are indicated by asterisks. Arrows mark residues 15, 21, and 28. A; Ala; R, Arg; N, Asn; D, Asp; C, Cys; E, Glu; Q, Gln; G, Gly; H, His; I, Ile; L, Leu; K, Lys; M, Met; F, Phe; P, Pro; S, Ser; T, Thr; W, Trp; Y, Tyr; V, Val.
Figure 6
Figure 6. Whole-Oocyte Outward K+ Currents Expressed by WT and Mutant hKv3.4 in the Absence and Presence of PMA
Currents evoked by 900ms step depolarizations from −100 mV to +50 mV were recorded before and after exposure to 20 nM PMA. In the presence of PMA, currents were recorded after reduction of inactivation had reached steady state (10–15 min; Figure 2). For comparison, all currents were normalized to their corresponding peak and overlaid. WT peak currents were 2.1, 2.6, 3.5, 2.4, and 1.9 μA. The corresponding mutant peak currents were 0.9,2.5, 3.5,5.6, and 1.2 μA.
Figure 7
Figure 7. Whole-Oocyte Outward K+ Currents Expressed by hKv3.4 (S15D) and the Corresponding WT Controls
(A) Currents were evoked by a 112 ms step depolarization from −100 to +70 mV. For comparison, currents were normalized to their peak and overlaid (thick trace, WT; thin trace, S15D). Peak currents were 20 and 12 μA for WT and S15D, respectively. (B) Tukey box plot summarizing the effect of S15D on the time constant of current inactivation (τ at +50 mV). The lower border, middle line, and upper border of the box represent the 25th, 50th, and 75th percentiles, respectively. The dotted line indicates the arithmetic mean (WT, 10 ± 1 ms [n = 11]; S15D, 16 ± 2 ms [n = 9]). The upper and lower whiskers represent the 90th and 10th percentiles, respectively, and outliers are shown as closed circles.

References

    1. Armstrong D, Eckert R. Voltage-activated calcium channels that must be phosphorylated to respond to membrane depolarization. Proc Natl Acad Sci USA. 1987;84:2518–2522. - PMC - PubMed
    1. Augustine CK, Bezanilla F. Phosphorylation modulates potassium conductance and gating current of perfused giant axons of squid. J Gen Physiol. 1990;95:245–271. - PMC - PubMed
    1. Bezanilla F, Armstrong CM. Inactivation of the sodium channel I: sodium current experiments. J Gen Physiol. 1977;70:549–566. - PMC - PubMed
    1. Busch AE, Varnum MD, North RA, Adelman JP. An amino acid mutation in a potassium channel that prevents inhibition by protein kinase C. Science. 1992;255:1705–1707. - PubMed
    1. Chung SK, Reinhart PH, Martin BL, Brautigan D, Levitan IB. Protein kinase activity closely associated with a reconstituted calcium-activated potassium channel. Science. 1991;253:560–562. - PubMed

Publication types