. 1994 Mar;190(3):765-9.
doi: 10.1148/radiology.190.3.8115625.

Tagged MR imaging in a deforming phantom: photographic validation

Affiliations

Tagged MR imaging in a deforming phantom: photographic validation

C C Moore et al. Radiology. 1994 Mar.

Abstract

Purpose: To validate cine magnetic resonance (MR) image tagging measurements of a deforming object by means of a precise photographic method.

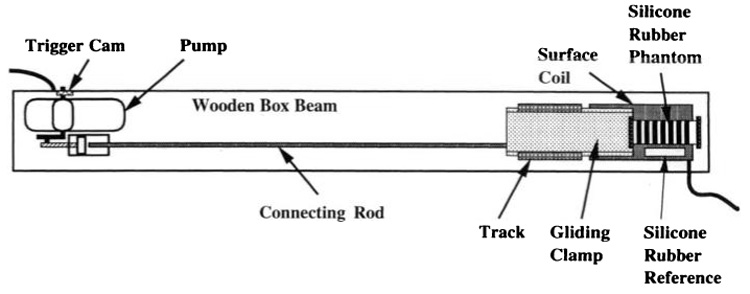
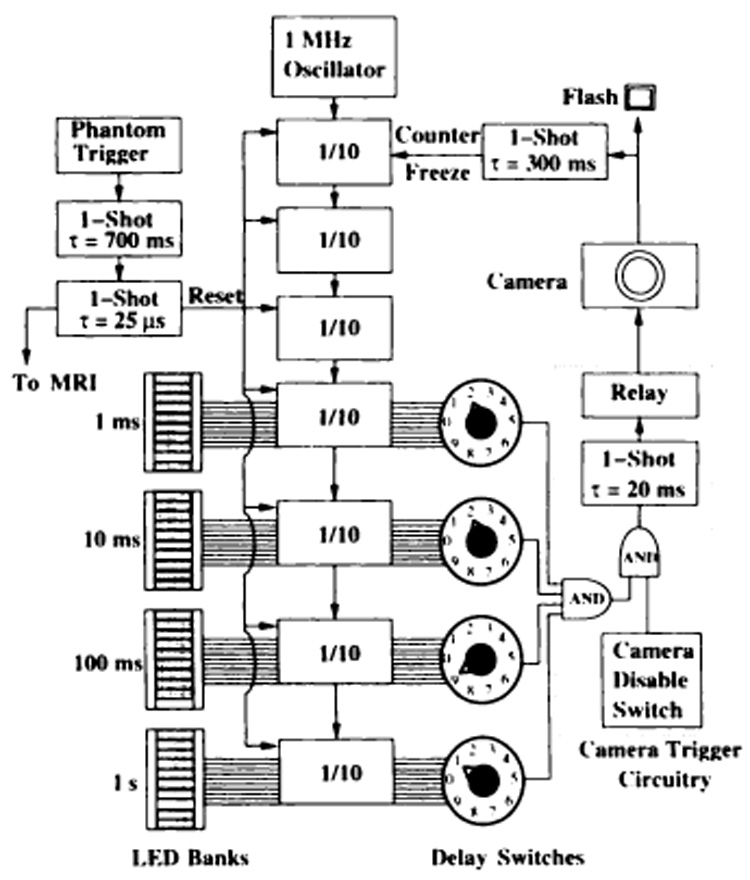
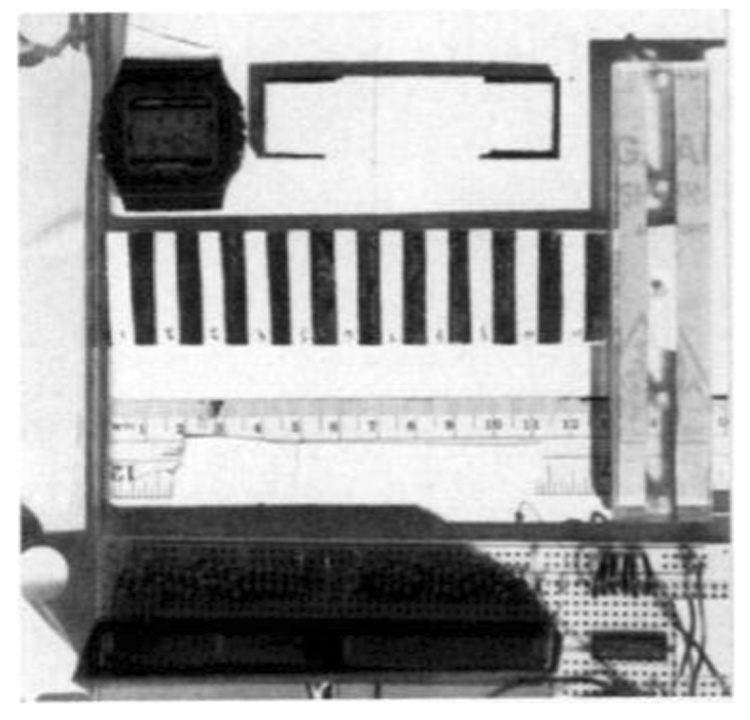
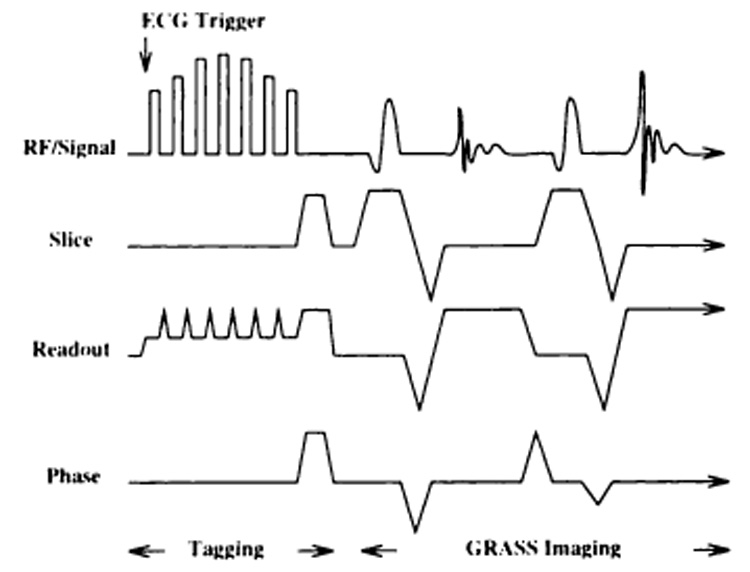
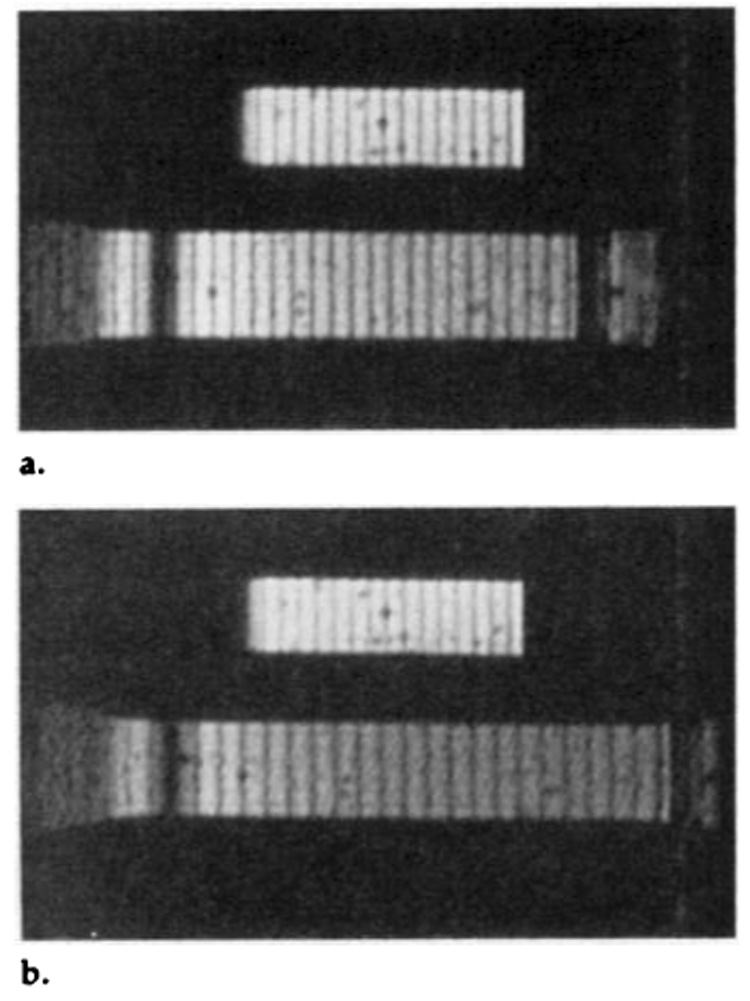
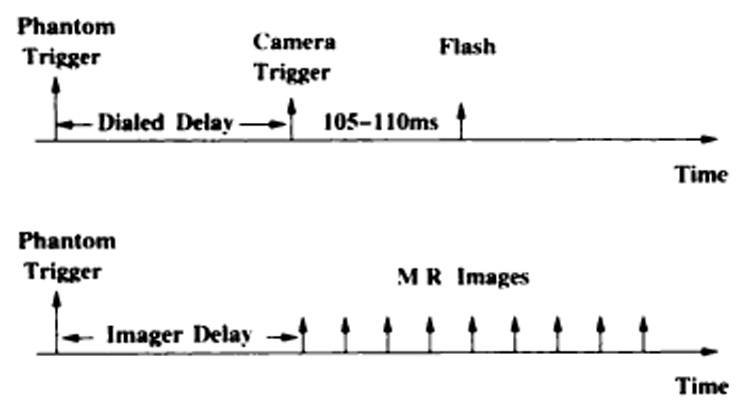
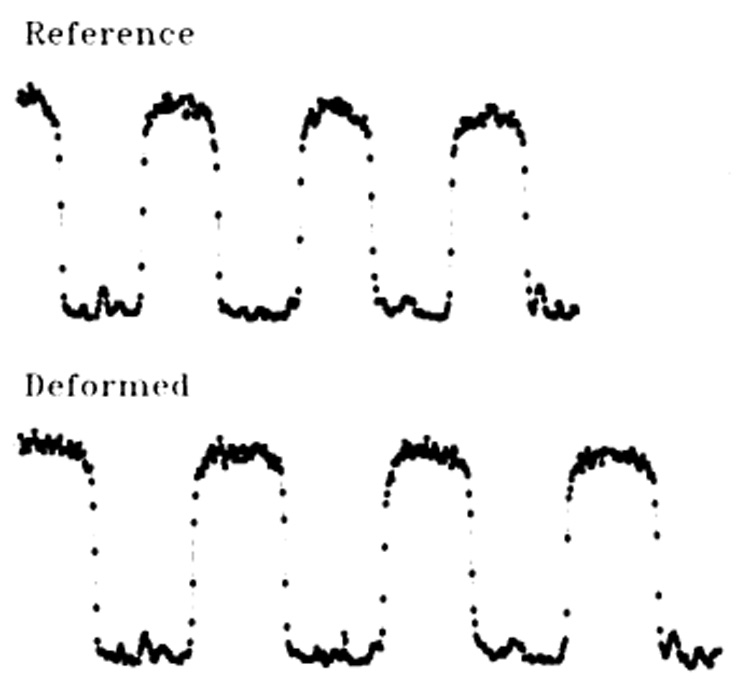
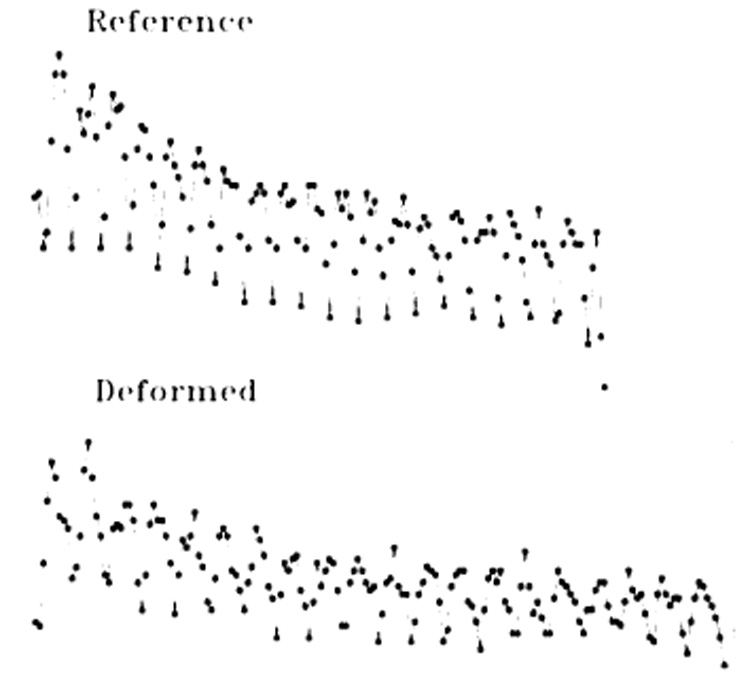
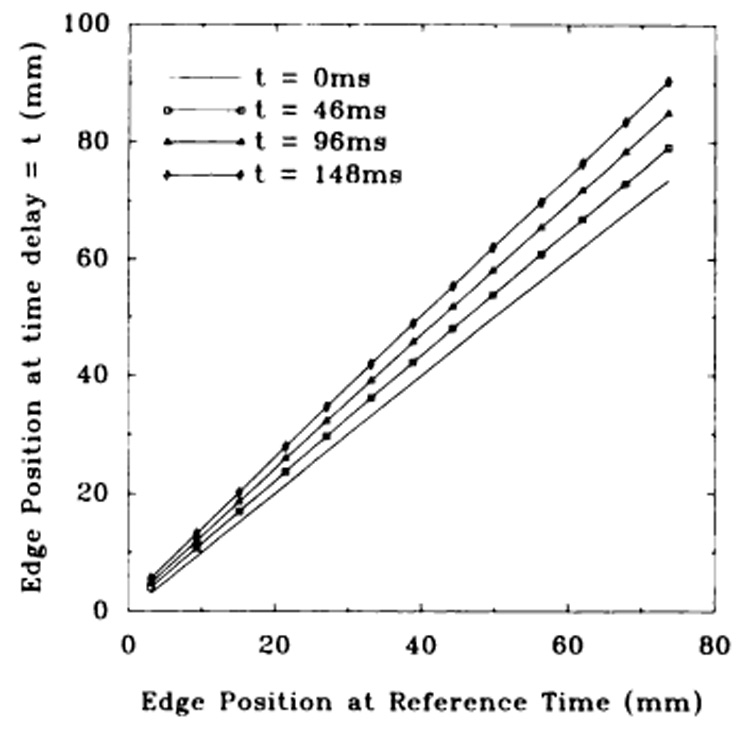
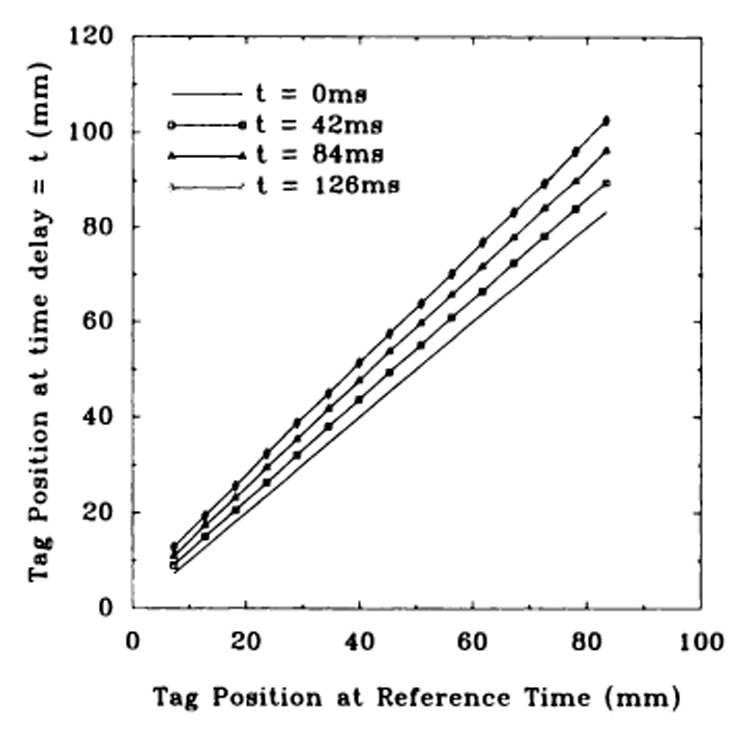
Materials and methods: A piece of silicone rubber that acted as a phantom was stretched in a cyclical fashion inside a plastic clamp driven by a respirator pump. Deformation as a function of time was measured with a rapid gradient-echo cine tagging sequence and with sequential stroboscopic photographs. Deformations from 1.0 to 1.2 (0% to 20% stretch) in the readout direction were measured over a 7-cm region of the phantom, which had a maximum standard error of +/- 0.001 with photography and a maximum standard error of +/- 0.003 with MR imaging.

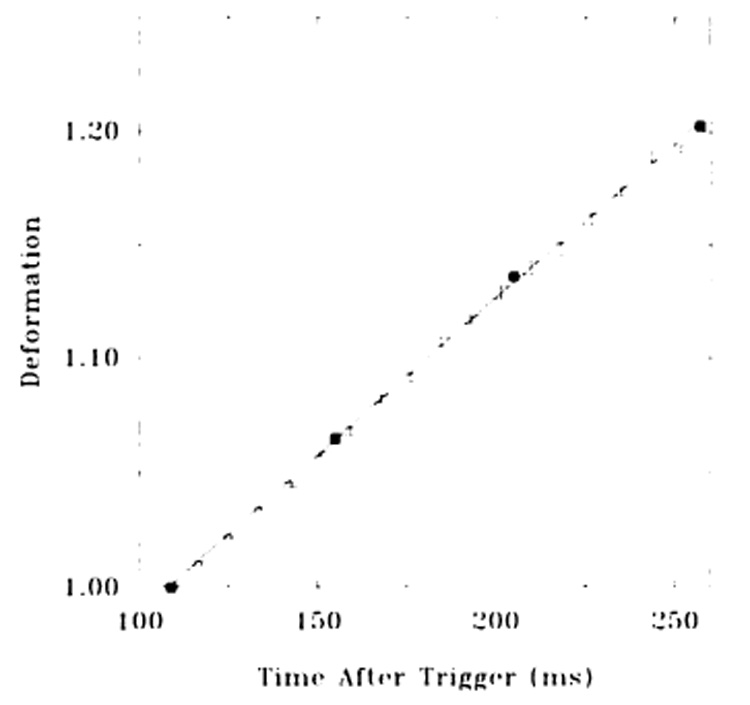
Results: The deformation versus time values measured with MR imaging had a standard error of 0.002 about a straight line fit to the photographic deformation versus time data. These results demonstrate that the MR imaging deformation estimates were accurate and precise.

Conclusion: The validated tagging method can now be used to evaluate MR imaging motion estimation techniques.


Figures

Figure 1
Figure 1
Phantom deformation apparatus. A respirator pump (left) cyclically moves a connecting rod and gliding clamp to deform the phantom (right). Black bands on the phantom allow photographic deformation measurement. The trigger cam generates a trigger every cycle to gate the imager and camera.
Figure 2
Figure 2
Timing circuitry. This circuit reads the phantom trigger, triggers the camera after a variable delay, displays the flash time in light-emitting diodes (LEDs), and sends a debounced gating trigger to the imager. The 1-MHz oscillator (top center) drives a cascade of divide-by-ten (1/10) integrated circuits (ICs) to form an LED timer. See text for details. MRI = MR imaging, ms = milliseconds, s = seconds.
Figure 3
Figure 3
Reference photograph of the phantom. The photograph was digitized to define the undeformed phantom geometry. The phantom is in a horizontal position with vertical black bands. It was fixed at the left and cyclically pulled from the gliding clamp at the right. The LEDs are at the bottom. A digital watch and a fixed, rubber reference are above the phantom.
Figure 4
Figure 4
Tagging and imaging pulse sequence. A hybrid DANTE-SPAMM tagging sequence is followed by a fractional-echo sequence performed with gradient-recalled acquisition in the steady state (GRASS). The short echo time (2.57 msec) minimized motion artifact; the short repetition time (8.40 msec) enabled high time resolution. ECG = electrocardiographic, RF = radio frequency.
Figure 5
Figure 5
Reference and deformed MR images of the phantom. (a) Reference MR image of the phantom, which is fixed at the left and pulled from the right. Above is the smaller, fixed position reference. (b) MR image obtained 148 msec later. The increase in tag spacing in the phantom illustrates the deformation.
Figure 6
Figure 6
Data acquisition timing diagram. The trigger from the phantom initiates either MR imaging or photography. Top: To obtain a photograph, a delay is programmed to change the camera trigger time. After a camera delay of 105–110 msec (ms), the flash occurs to expose the phantom. Bottom: MR images are obtained in rapid succession after an imager delay.
Figure 7
Figure 7
(7) Photographic pixel (■) profiles at reference time and 148 msec later (Deformed). The horizontal axis is the position along the phantom, and the vertical direction for each tracing represents pixel intensity. Deformation is evident from the increased separation of the vertical edges. The valleys represent the black bands on the white rubber.
Figure 8
Figure 8
(8) MR imaging pixel profiles at reference time and 148 msec later (Deformed). The horizontal axis is the position along the phantom, and the vertical direction for each tracing represents pixel intensity. Deformation is evident from the increased separation of the tag minima. Lower tag amplitudes in the deformed image result from tag fading.
Figure 9
Figure 9
(9) Position of photographic edges versus initial position at reference time. Three time curves are shown in addition to the reference curve at 0 msec, which has unity slope by definition. The slope indicates the deformation. The standard errors in position about the linear fits were, respectively, 0.025 mm, 0.060 mm, and 0.082 mm for the 46-, 96-, and 148-msec curves. In 9–11, ms = milliseconds; in 9 and 10, t = time.
Figure 10
Figure 10
(10) Position of MR tags versus initial position at reference time. Three time curves are shown in addition to the reference line at 0 msec, which has unity slope by definition. The slope indicates the deformation. The standard errors in position about the linear fits were, respectively, 0.090 mm, 0.150 mm, and 0.185 mm for the 42-, 84-, and 126-msec curves. Tag fading produces greater uncertainty in tag position with time.
Figure 11
Figure 11
(11) Deformation versus time for photographic and MR imaging methods. The photographic data are shown as solid squares, and a linear regression line through them is also shown. MR data are shown as points with symmetric error bars. Error bars show the standard errors in the slopes of tag-position versus reference-tag-position lines, as shown in 10.

References

    1. Zerhouni EA, Parish DM, Rogers WJ, Yang A, Shapiro EP. Human heart: tagging with MR imaging—a method for noninvasive assessment of myocardial motion. Radiology. 1988;169:59–63. - PubMed
    1. Mosher TJ, Smith MB. A DANTE tagging sequence for the evaluation of translational sample motion. Magn Reson Med. 1990;15:334–339. - PubMed
    1. Axel L, Dougherty L. MR imaging of motion with spatial modulation of magnetization. Radiology. 1989;171:841–849. - PubMed
    1. Bolster BD, McVeigh ER, Zerhouni EA. Myocardial tagging in polar coordinates with use of striped tags. Radiology. 1990;177:769–772. - PMC - PubMed
    1. McVeigh ER, Atalar E. Cardiac tagging with breath hold CINE MRI. Magn Reson Med. 1992;28:318–327. - PMC - PubMed

Publication types

Substances