Comparative Study
. 1993 Aug;21(4):457-78.
doi: 10.1007/BF01061691.

Comparison of four basic models of indirect pharmacodynamic responses

Affiliations
Comparative Study

Comparison of four basic models of indirect pharmacodynamic responses

N L Dayneka et al. J Pharmacokinet Biopharm. 1993 Aug.

Abstract

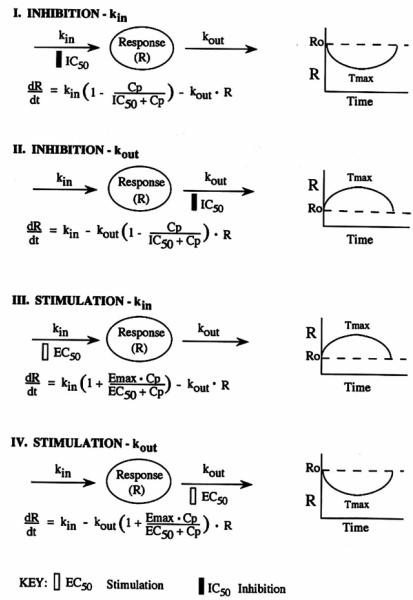
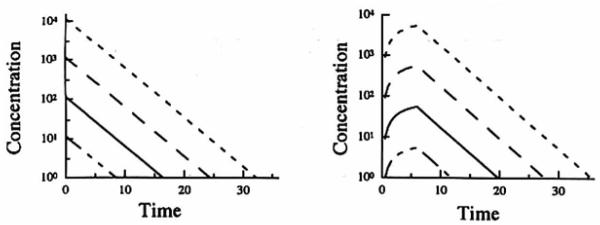
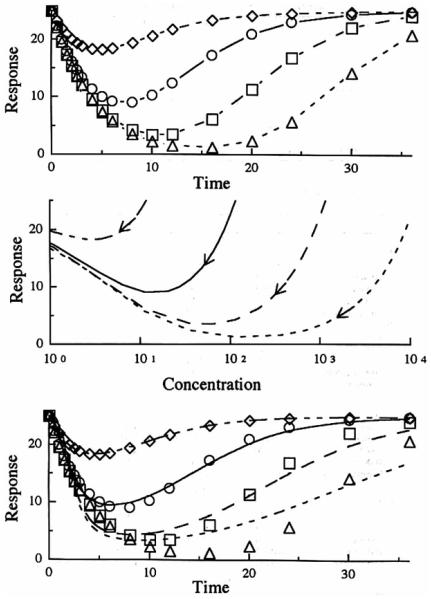
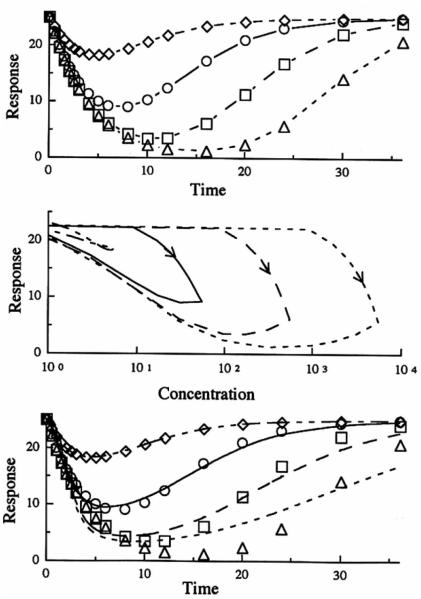
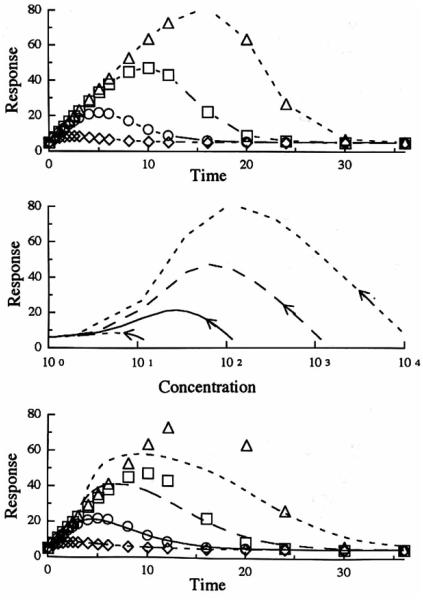
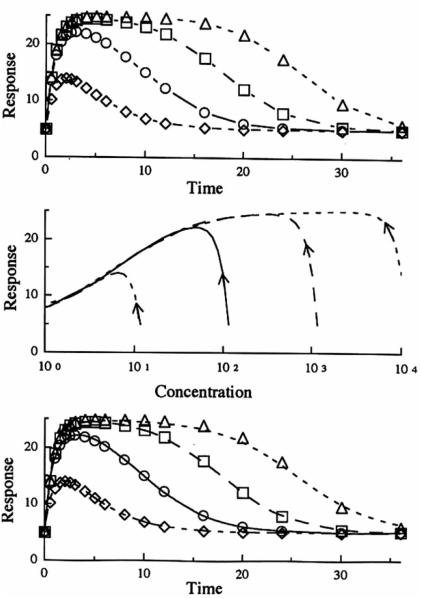
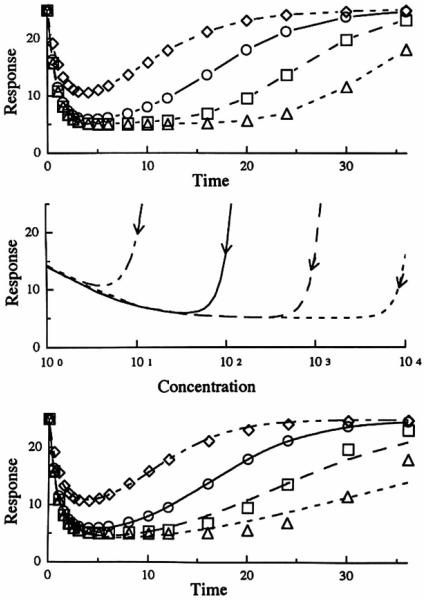
Four basic models for characterizing indirect pharmacodynamic responses after drug administration have been developed and compared. The models are based on drug effects (inhibition or stimulation) on the factors controlling either the input or the dissipation of drug response. Pharmacokinetic parameters of methylprednisolone were used to generate plasma concentration and response-time profiles using computer simulations. It was found that the responses produced showed a slow onset and a slow return to baseline. The time of maximal response was dependent on the model and dose. In each case, hysteresis plots showed that drug concentrations preceded the response. When the responses were fitted with pharmacodynamic models based on distribution to a hypothetical effect compartment, the resulting parameters were dose-dependent and inferred biological implausibility. Indirect response models must be treated as distinct from conventional pharmacodynamic models which assume direct action of drugs. The assumptions, equations, and data patterns for the four basic indirect response models provide a starting point for evaluation of pharmacologic effects where the site of action precedes or follows the measured response variable.


Figures

Fig 1
Fig 1
Four basic indirect response models characterized by either inhibition or stimulation or the response variable. The shapes of the responses are depicted on the right of each model.
Fig. 2
Fig. 2
Simulated pharmacokinetic profiles of methylprcdnisolonc following the administration of the four doses (1, 10, 100, or 1000 mg) either as an intravenous bolus (left panel) or as an intravenous infusion over 6 hr (right panel).
Fig. 3
Fig. 3
Model I simulation of the response after a single iv bolus dose with respect to time (upper panel) and plasma concentration (middle panel). The curves in the lower panel represent the best filling of the distributive sigmoid Emax model to the simulated data (symbols) from the indirect response model. Methylprednisolone iv doses of 1 mg (◇ - - -). 10 mg (○ —), 100mg(□ ––), 100mg(△ ---).
Fig. 4
Fig. 4
Model I simulation of the response after a single iv infusion dose given over 6 hr vs. time (upper panel) and plasma concentration (middle panel). The curves in the lower panel represent the best filling of the distributive sigmoid E.,. model to the simulated data (symbols) from the indirect response model. Methylprednisolone iv doses of 1 mg (◇ - - -). 10 mg (○ —), 100mg (□ ––), 1000mg (△ ---).
Fig. 5
Fig. 5
Model 2 simulation of the response afier a single iv bolus dose with respect lo time (upper panel) and plasma concentrarion (middle panel). The curves in lhc lower panel represent the best filling of the distributive sigmoid Emax model lo the simulated data (symbols) from the indirect response model. Mcthylprcdnisolone iv doses of 1 mg (◇ - - -), 10 mg (○ —), 100 mg (□ ––), 100 mg (△ - - -).
Fig. 6
Fig. 6
Model 3 simulation of the response after a single iv bolus dose with respect to time (upper panel) and plasma concentration (middle panel). The curves in the lower panel represent the best fitting of the distributive sigmoid Emax model to the simulated data (symbols) from the indirect response model. Methylprednisolone iv doses of 1 mg (◇ - - -). 10 mg (○ —). 100 mg(□ ––), 1000 mg(△ ---).
Fig. 7
Fig. 7
Model 4 simulation of the response aRer a single iv bolus dose with respect to time (upper panel) and plasma concentration (middle panel). The curves in the lower panel represent the best fitting of the distributive sigmoid Emax. model to the simulated data (symbols) from the indirect response model. Methylprcdnisolone iv doses of 1 mg (◇ - - -), 10 mg (○ —), 100 mg (□ ––), 1000 mg (△ ---).

References

    1. Holford NHG, Sheiner LB. Understanding the dose-effect relationship: Clinical application of pharmacokinetic-pharmacodynamic models. cin Pharmacokin. 1981;6:429–453. - PubMed
    1. Sheiner LB, Stanski DR, Vozeh S, Miller RD, Ham J. Simultaneous modeling of pharmacokinetics and pharmacodynamics: Application to d-tubocurarine. Clin Pharmacol Ther. 1979;25:358–371. - PubMed
    1. Verotta D, Beal SL, Sheiner LB. Semiparametric approach to pharmacokinetic-pharmacodynamic data. Am. J. Physiol. 1989;256:R1005–R1010. - PubMed
    1. Holford NHG, Sheiner LB. Pharmacokinetic and pharmacodynamic modeling in vivo. CRC Crit. Rev. Bioeng. 1981;5:273–322. - PubMed
    1. Lalonde RL. Applied Pharmacokinetics. In: Evans WE, Schentag JJ, Jusko WJ, editors. Applied Therapeutics. 3rd Vancouver: 1992. pp. 4–33.

Publication types

Substances

LinkOut - more resources