. 1994 Jan;15(1):7-27.
doi: 10.1016/0143-4160(94)90100-7.

Fluorescence lifetime imaging of intracellular calcium in COS cells using Quin-2

Affiliations

Fluorescence lifetime imaging of intracellular calcium in COS cells using Quin-2

J R Lakowicz et al. Cell Calcium. 1994 Jan.

Abstract

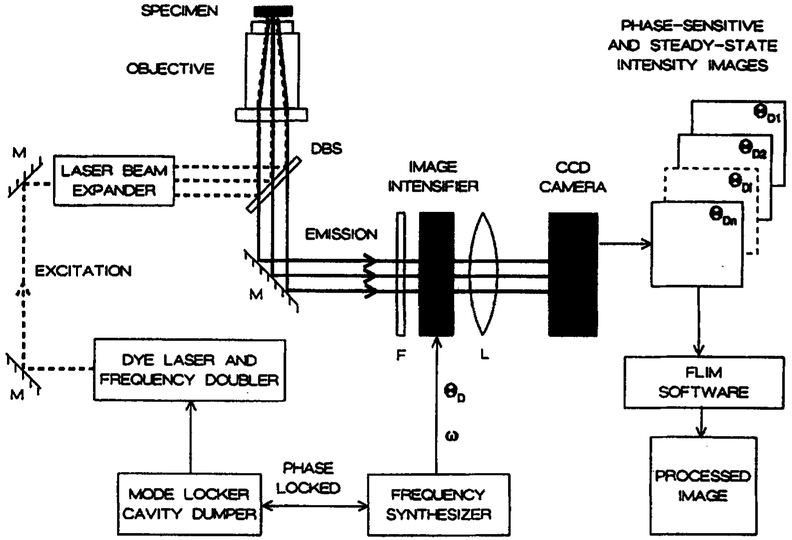
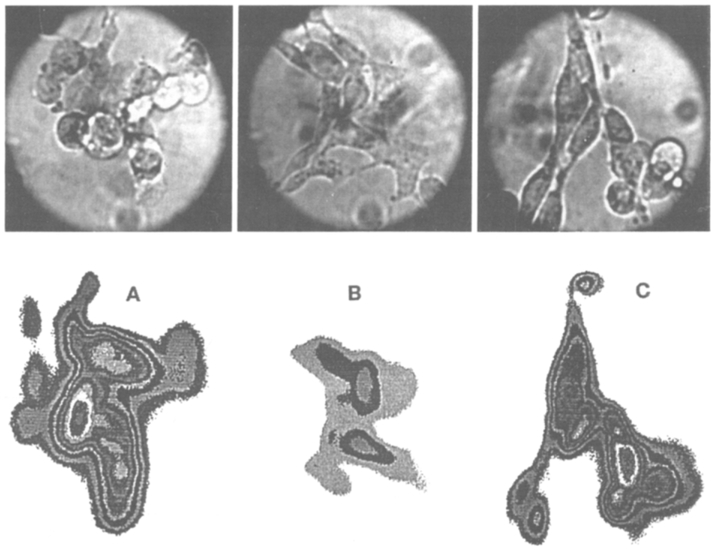
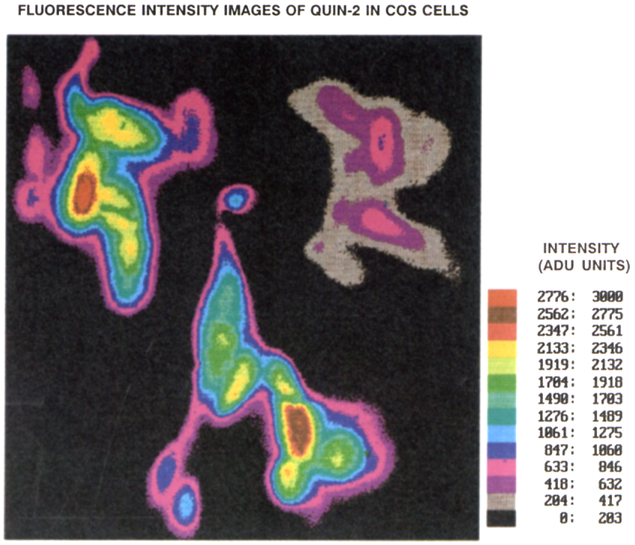
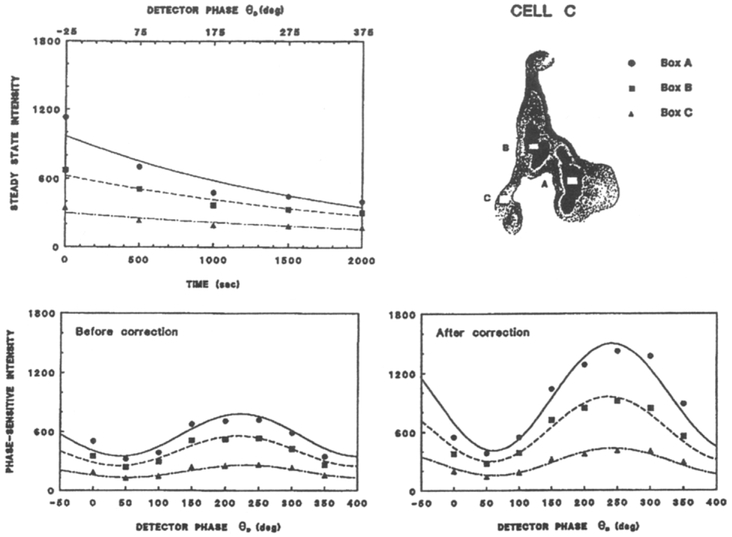
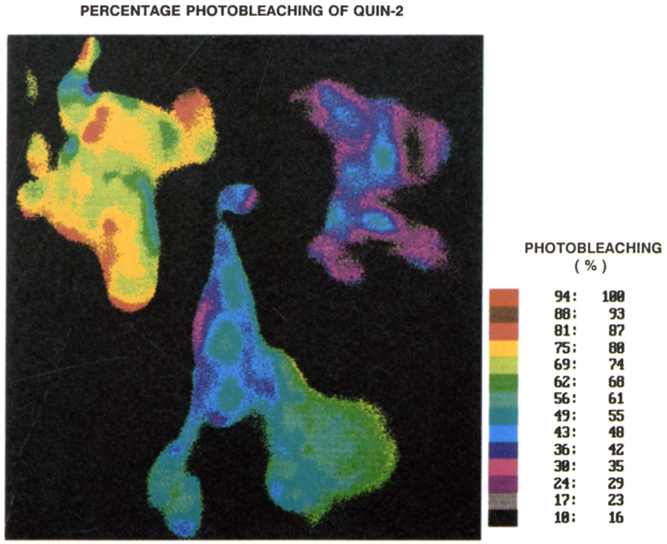
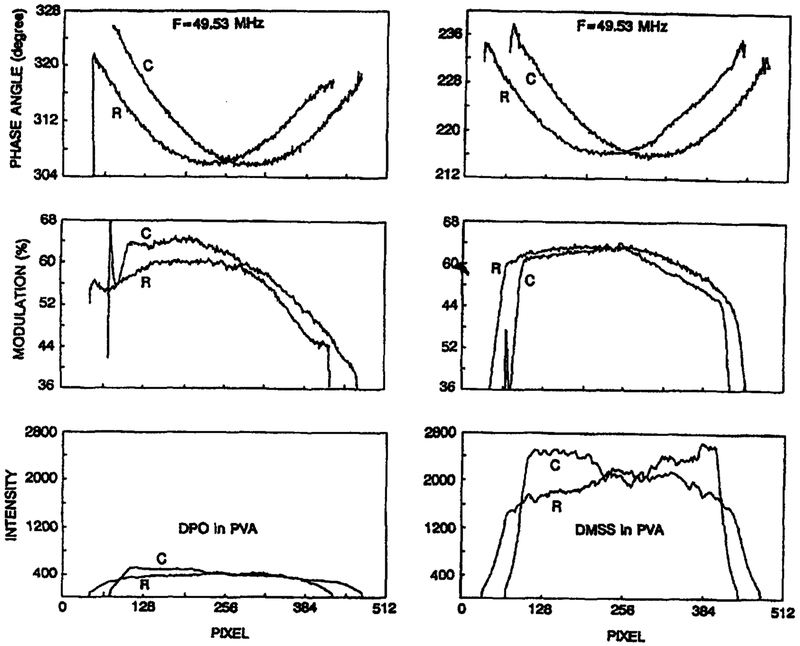
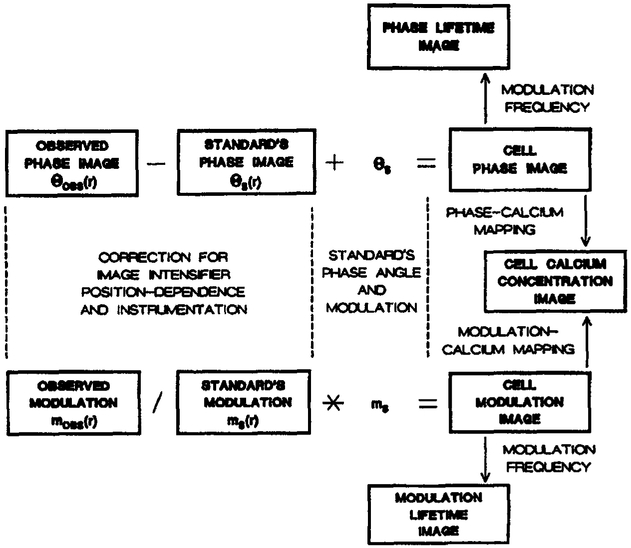
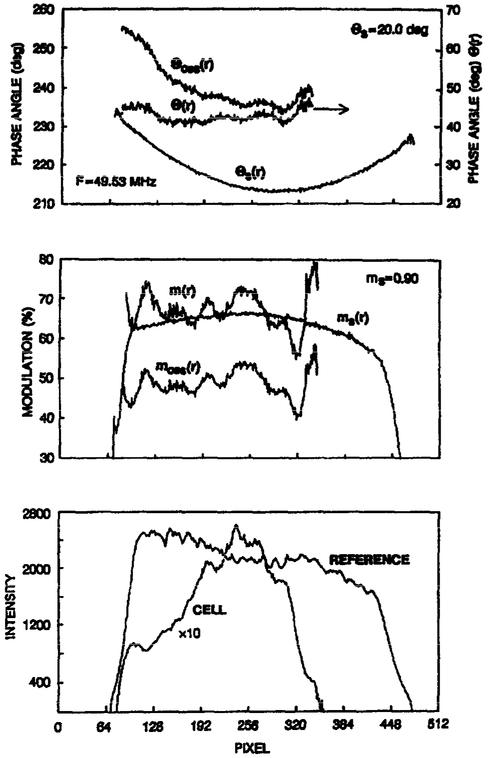
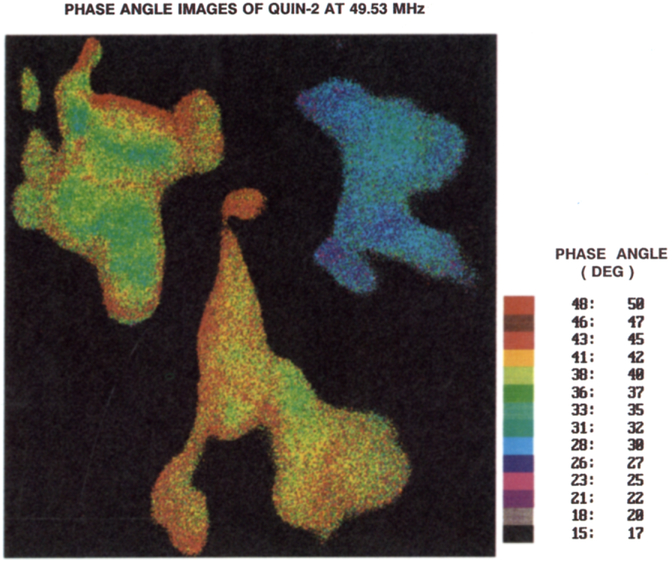
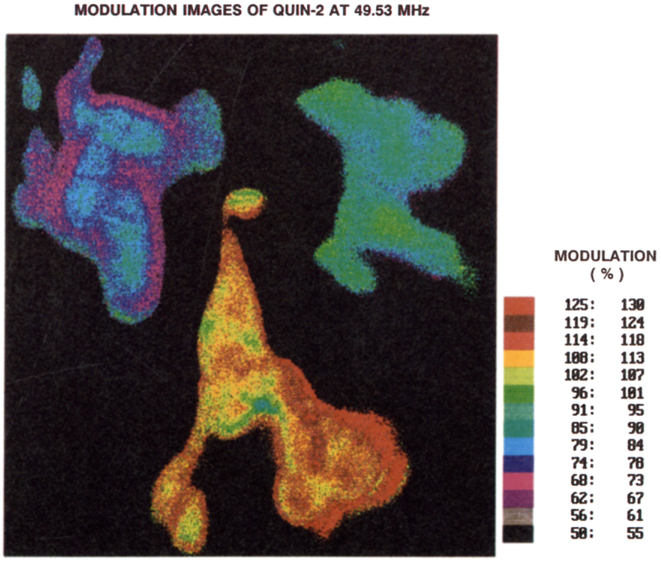
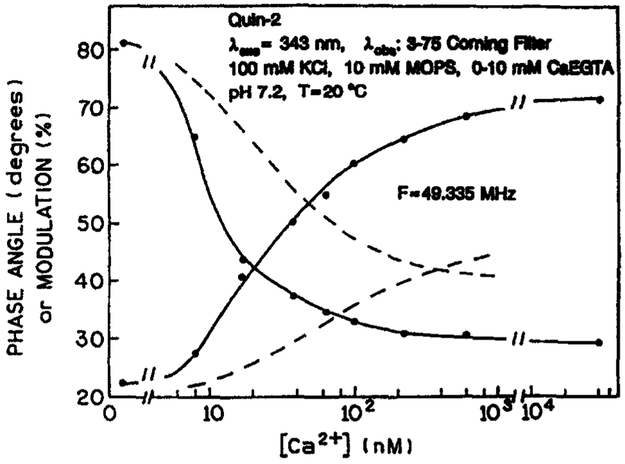
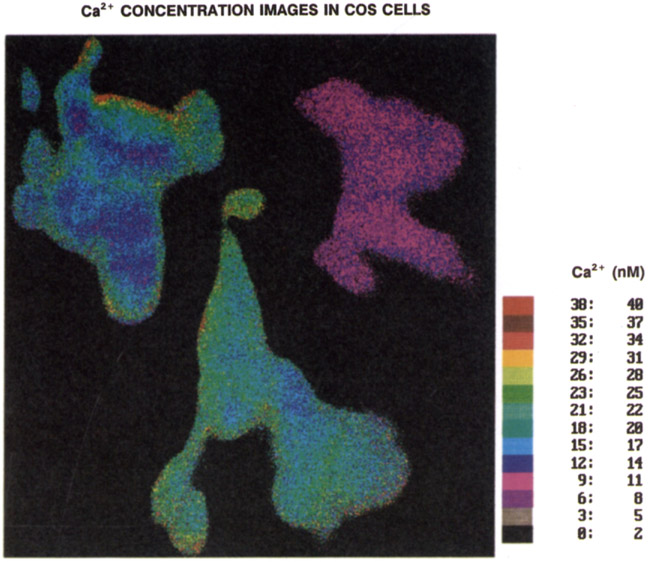
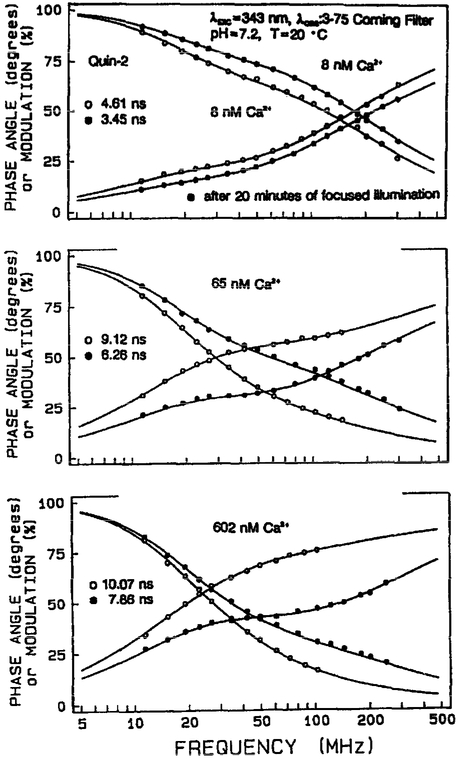
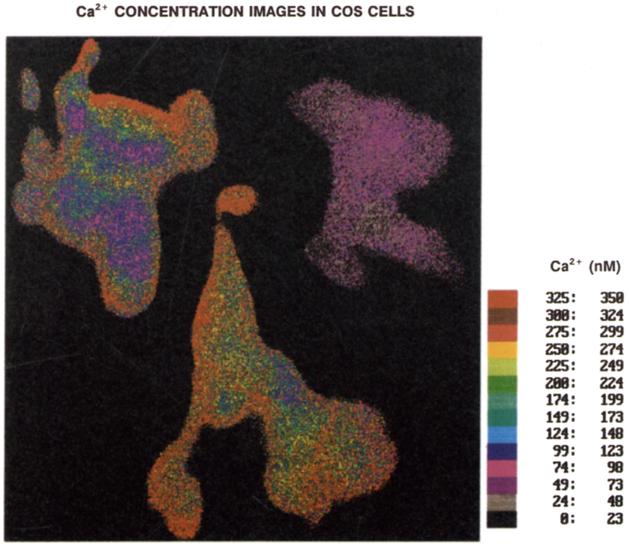
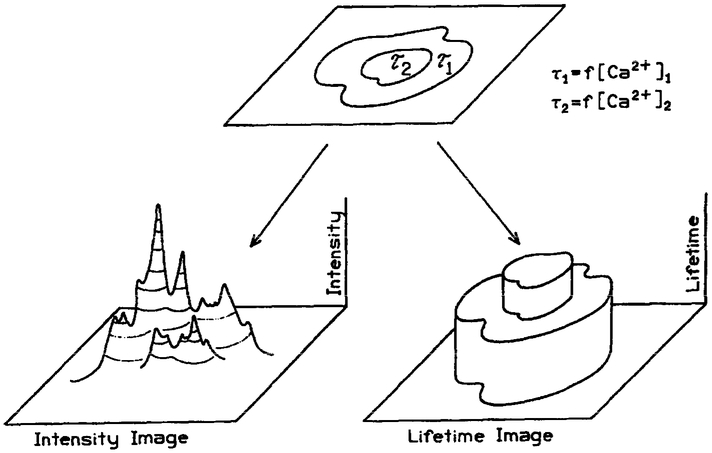
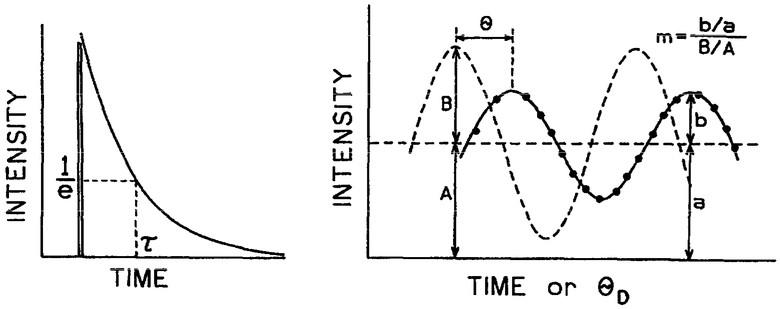
We describe the first fluorescence lifetime images of cells. To demonstrate this new capability we measured intracellular images of Ca2+ in COS cells based on the Ca(2+)-dependent fluorescence lifetime of Quin-2. Apparent fluorescence lifetimes were measured by the phase-modulation method using a gain-modulated image intensifier and a slow-scan CCD camera. We describe methods to correct the images for photobleaching during acquisition of the data, and to correct for the position-dependent response of the image intensifier. The phase angle Quin-2 images were found to yield lower than expected Ca2+ concentrations, which appears to be the result of the formation of fluorescent photoproducts by Quin-2. Fluorescence lifetime imaging (FLIM) does not require wavelength-radiometric probes and appears to provide new opportunities for chemical imaging of cells.


Figures

Fig. 1
Fig. 1
Apparatus for cellular FLIM. M, Mirror, DBS, dichroic beam splitter; F, filter, L, lens; ω, modulation frequency; θD, phase angle of the frequency synthesizer output. See Materials and methods for additional details.
Fig. 2
Fig. 2
Light microscopy images of COS cells. The lower images indicate the area, shape, and orientation of the cells in the subsequent color images.
Fig. 3
Fig. 3
Quin–2 fluorescence intensity images of the three COS cells. According to the manufacturer’s specifications, a unit of intensity corresponds to approximately 18 photoelectrons.
Fig. 4
Fig. 4
Correction of the phase-sensitive intensities at selected sites on COS cell C for the extent of photobleaching and/or illumination time.
Fig. 5
Fig. 5
Decrease of the fluorescence intensity of Quin–2 due to photobleaching.
Fig. 6
Fig. 6
Position-dependent, phase (top), modulation (middle) and intensity (bottom) of the standard fluocophores as seen by the gain-modulated image intensifier at 49.53 MHz. The values shown are for an average of 10 pixels of a row (R) or column (C) of the CCD image. See Table 1.
Fig. 7
Fig. 7
Procedure for correcting for the position-dependent phase and modulation of the image-intensifier and the lifetime of the standard fluorophore.
Fig. 8
Fig. 8
Calculation of the position dependent phase and modulation of a Quin–2 labeled COS cell. The data shown are the average of columns 235–240 of cell C (Fig. 5).
Fig. 9
Fig. 9
Phase angle images of the emission from Quin–2 in COS cells, measured at 49.53 MHz.
Fig. 10
Fig. 10
Modulation images of the Quin–2 emission from COS cells, measured at 49.53 MHz.
Fig. 11
Fig. 11
Phase and modulation calibration curves for Quin–2, 49.335 MHz. The dashed line shows the estimated phase and modulation calibration curves following phototransformation of Quin–2 by a focused laser beam. The rising and falling curves are the phase and modulation, respectively.
Fig. 12
Fig. 12
Calcium concentration image of the COS cells, as obtained from the pre-photobleaching Quin–2 calibration curve (Fig. 11).
Fig. 13
Fig. 13
Frequency-domain intensity decay data for Quin–2, before (open circles) and after (filled circles) photobleaching. The multi-exponential decay parameters are given in Table 3.
Fig. 14
Fig. 14
Calcium concentration images of the COS cells, as obtained from the after photobleaching Quin–2 calibration curve. (Fig. 11).
Scheme 1
Scheme 1
Comparison of intensity and lifetime imaging of cells.
Scheme 2
Scheme 2
Pulse and phase-modulation lifetime measurements.

Similar articles

Cited by

References

    1. Ryan TA Millard PJ Webb WW (1990) Imaging [Ca2+]i dynamics during signal transduction. Cell Calcium, 11, 145–155. - PubMed
    1. Sugimori M Llinás RR. (1990) Real-time imaging of calcium influx in mammalian cerebellar Purkinje cells in vitro. Proc. Natl. Acad. Sci. USA, 87, 5084–5088. - PMC - PubMed
    1. Tucker RW Fay FS (1990) Distribution of intracellular free calcium in quiescent BALB/c 3T3 cells stimulated by platelet-derived growth factor. Eur. J., Cell Biol, 51, 120–127. - PubMed
    1. Cornell Bell AH Finkbeiner SM Cooper MS Smith SJ. (1990) Glutamate induces calcium waves in cultured astrocytes: Long range glial signaling. Science, 247, 470–473. - PubMed
    1. Llinás RR Sugimori M Silver RB (1992) Microdomains of high calcium concentration in a presynaptic terminal. Science, 256, 677–680. - PubMed

Publication types