. 1994 Feb;8(2):240-8.
doi: 10.1210/mend.8.2.8170480.

Molecular mechanisms of stress-induced proenkephalin gene regulation: CREB interacts with the proenkephalin gene in the mouse hypothalamus and is phosphorylated in response to hyperosmolar stress

Affiliations

Molecular mechanisms of stress-induced proenkephalin gene regulation: CREB interacts with the proenkephalin gene in the mouse hypothalamus and is phosphorylated in response to hyperosmolar stress

D Borsook et al. Mol Endocrinol. 1994 Feb.

Abstract

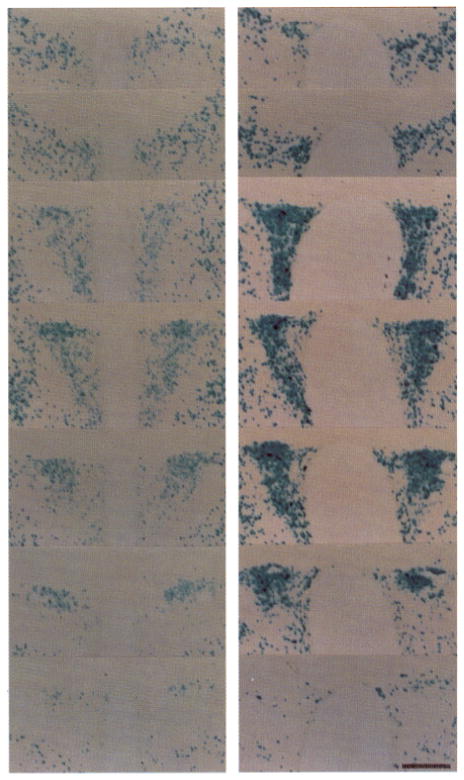
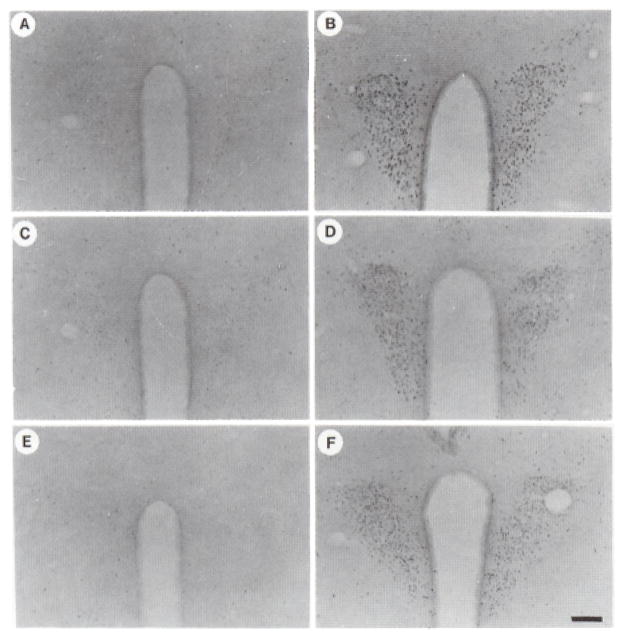
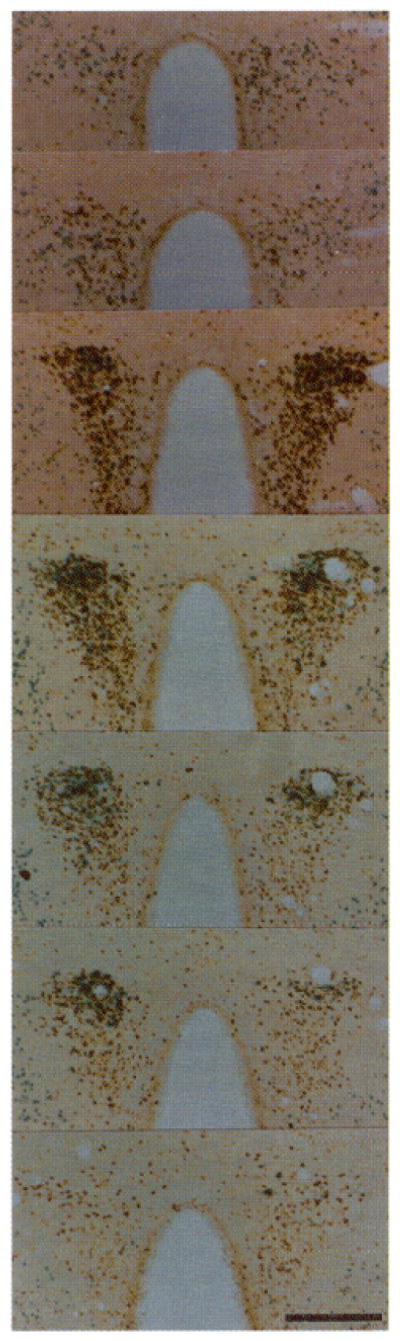
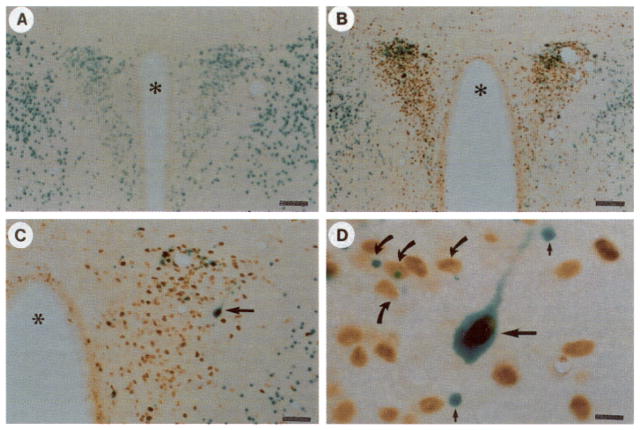
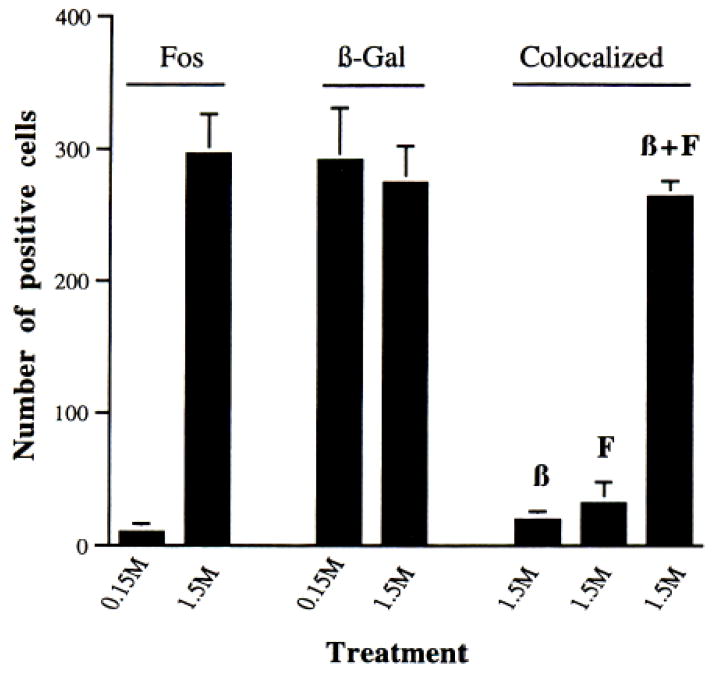
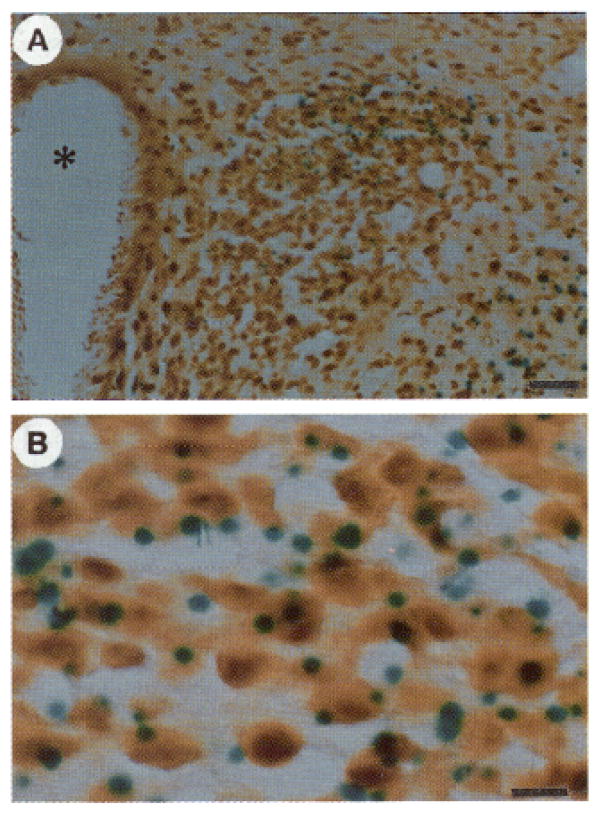
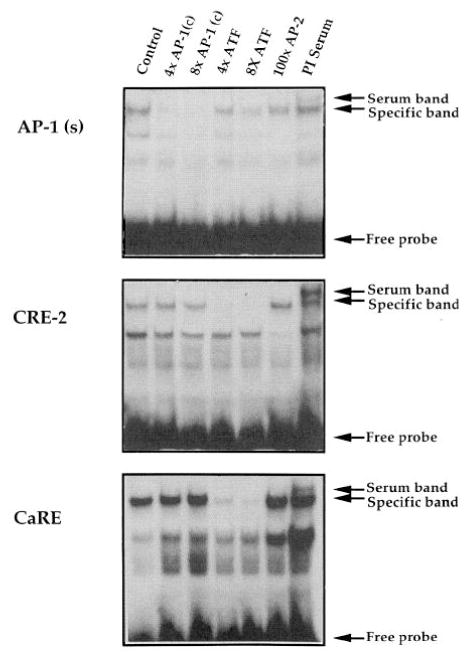
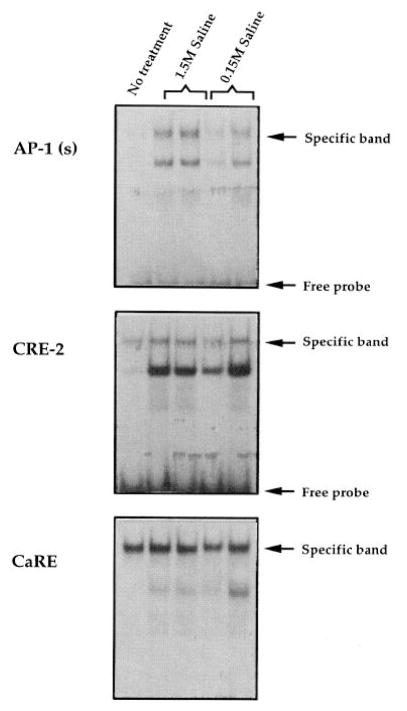
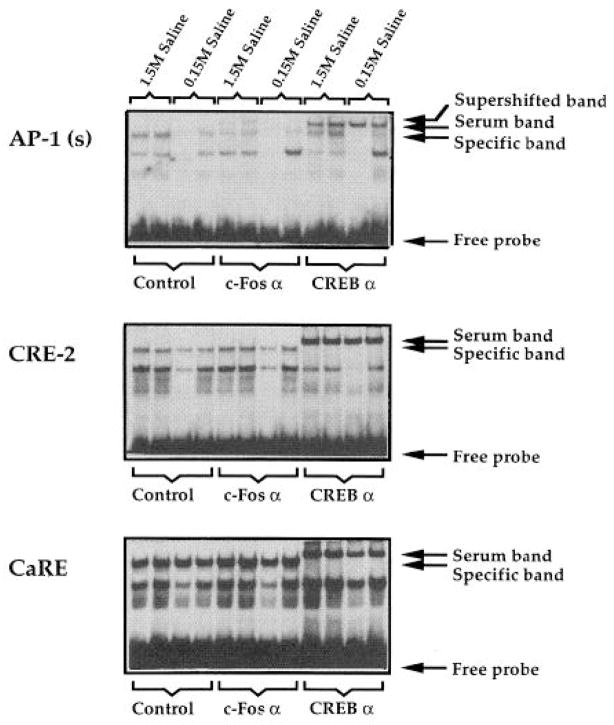
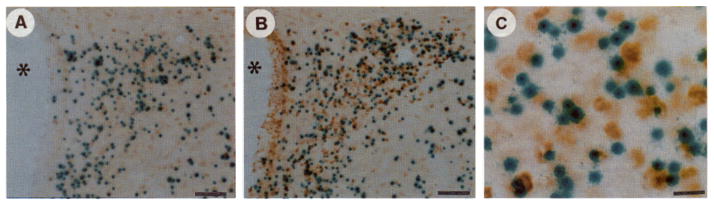
We have established a transgenic model to facilitate the study of stress-induced gene regulation in the hypothalamus. This model, which uses a human proenkephalin-beta-galactosidase fusion gene, readily permits anatomic and cellular colocalization of stress-regulated immediate early gene products (e.g. Fos) and other transcription factors [e.g. cAMP response element-binding protein (CREB)] with the product of a potential target gene. Moreover, Fos provides a marker of cellular activation that is independent of the transgene. Hypertonic saline stress induced Fos in almost all cells in the PVN that exhibited basal expression of the proenkephalin transgene; however, all cells in which the transgene was activated by stress also expressed Fos. CREB was found in essentially all neurons. Gel shift analysis with and without antisera to Fos and CREB showed that AP-1 binding activity, containing Fos protein, was induced by hyperosmotic stress. However, Fos was not detected binding to the proenkephalin second messenger-inducible enhancer even in hypothalamic cell extracts from stressed animals. In contrast, CREB formed specific complexes with both the proenkephalin enhancer and a cAMP- and calcium-regulated element (CaRE) within the c-fos gene. Moreover, we found that hypertonic saline induced CREB phosphorylation in cells that express the transgene within the paraventricular nucleus and supraoptic nucleus. These results suggest a model in which proenkephalin gene expression in the paraventricular nucleus is regulated by CREB in response to hypertonic stress.


Figures

Fig. 1
Fig. 1. Induction of the Transgene in the PVN of the Hypothalamus
Panels show 50-μm sections taken every 100 μm from rostral to caudal portions of the PVN stained for β-galactosidase activity. The panel on the left shows sections from a control mouse killed 6 h after an ip injection of normal (0.15 M) saline. The panel on the right is from a mouse killed 6 h after an ip injection of hypertonic (1.5 M) saline. Note the filling of neurons within the PVN with the β-galactosidase reaction produced after the 1.5-M saline injection. Magnification: horizontal bar = 250 μm.
Fig. 2
Fig. 2. Time Course of Fos Induction in the PVN after Hypertonic Saline Stress
The sections shown are from mice that received an ip injection of either normal (0.15 M) saline (A, C, and E) or hypertonic (1.5 M; B, D, and F) saline and were killed after 1 h (A and B), 3 h (C and D), or 6 h (E and F). Minimal induction was observed after 1 h in the control animals (A), presumably due to the stress of handling. Magnification: horizontal bar = 100 μm.
Fig. 3
Fig. 3. Regional Distribution of Transgene and Fos Expression in the PVN after Hypertonic Stress
Serial sections (50 μm) taken every 100 μm are shown from rostral (top) to caudal (bottom) regions of the PVN stained for β-galactosidase activity and Fos immunoreactivity 6 h after hypertonic saline. The enhanced intensity of Fos staining seen in the double labeling experiments appears to result from processing sections through the X-Gal solution (see Materials and Methods). Magnification: horizontal bar = 250 μm.
Fig. 4
Fig. 4. Colocalization of Transgene Expression with Fos
All sections are stained for β-galactosidase activity and Fos immunoreactivity in animals killed 6 h after normal saline (A) or hypertonic saline (B–D) injection. A dramatic example of colocalization (horizontal arrow) is shown in C and at higher magnification in D, illustrating the staining of the nucleus for Fos and the cytoplasm (including a process) for β-galactosidase activity. Also shown in D are additional cells in which colocalization of Fos with the transgene is observed (curved arrows) or not present (vertical small arrows). Magnification: horizontal bars = 100 μm (A and B), 50 μm (C), and 10 μm (D).
Fig. 5
Fig. 5. Quantitative Analysis of Colocalization of β-Galactosidase and Fos in the PVN
The graph shows the number of cells staining positively for Fos, β-Gal, or both in the PVN 6 h after a 1.5-M saline injection. Tissue sections were processed for Fos alone (left histograms), β-galactosidase alone (middle histograms), or colocalized for both products (right histograms). On the right of the graph, analysis of the total number of colocalized cells (β + F), cells only positive for β-Gal (β), and cells only positive for Fos (F) is shown (mean ± SEM; n = 4 in all cases derived from similar sections through the PVN). Note that the number of cells that do not colocalize is extremely small. There is no statistically significant difference among the three groups (β, F, and β+F) by Student’s t test. The graph does not reflect the number of induced (filled) cells (see text).
Fig. 6
Fig. 6. Colocalization of Transgene Expression with CREB
The section, shown at low magnification (A) and high magnification (B), was stained for β-galactosidase activity and CREB immunoreactivity. It shows colocalization of transgene expression with CREB protein within the PVN 20 min after an ip injection of hypertonic saline. Essentially all cells that express β-galactosidase also express CREB; in fact, CREB appears to be expressed within all cells in the section. There were no differences in staining among uninjected and 0.15-and 1.5-M saline injections. Magnification: horizontal bars = 50 μm (A) and 10 μm (B).
Fig. 7
Fig. 7. Specificity of Binding to Oligonucleotide Probes
Top, AP-1 oligonucleotide. Middle, Proenkephalin CRE-2 element. Bottom, CaRE element. Note that although the AP-1 (c) oligonucleotide competes more strongly with the AP-1 (s) oligonucleotide, the CREB/ATF oligonucleotide competes more strongly with the CRE-2 and CaRE oligonucleotides. The unrelated proenkephalin AP-2 sequence (3) does not compete effectively. See Materials and Methods for full oligonucleotide sequences. The control lane has no competitor added. 4x AP-1 (c) and 8x AP-1 (c), 4- and 8-fold molar excesses of unlabeled AP-1 oligonucleotide; 4x ATF and 8x ATF, 4- and 8-fold molar excesses of unlabeled CRE8/ATF oligonucleotide; 100x AP-2.100-fold excess of AP-2 oligonucleotide; Pl serum, binding in the presence of preimmune serum.
Fig. 8
Fig. 8. Gel Shifts Showing the Effects of Stress on Binding in Extracts from PVN
Each lane represents extracts made from the PVN regions pooled from three animals. For each oligonucleotide, the first lane represents no treatment, the next two lanes represent 1.5 M saline injection, and the last two lanes represent 0.15 M saline injection. Animals were killed 2 h after injection. Each saline condition is represented by two lanes, each representing an independent experiment. The arrows point to a specific band, as determined by competition analysis (see Fig. 7). Top, AP-1 oligonucleotide. Middle, CRE-2 oligonucleotide. Bottom, CaRE oligonucleotide.
Fig. 9
Fig. 9. Gel Shift Analysis in the Presence of c-Fos α and CREB α
Supershift analysis of proteins binding to the AP-1(s) oligonucleotide (top), the CRE-2 oligonucleotide (middle), and the CaRE oligonucleotide (bottom). A serum band is seen in the presence of CREB antiserum that is not affinity purified (see also Fig. 7 showing the additional band in the presence of serum). Each condition is shown in duplicate, representing entirely independent experiments. Lanes 1–4 show animals treated with hypertonic saline (lanes 1 and 2) and normal saline (lanes 3 and 4) in the absence of antibody. Lanes 5–8 show animals treated with hypertonic saline (lanes 5 and 6) and normal saline (lanes 7 and 8) in the presence of Fos antibody. Lanes 9–12 show animals treated with hypertonic saline (lanes 9 and 10) and normal saline (lanes 11 and 12) in the presence of CREB antiserum.
Fig. 10
Fig. 10. Colocalization of Phospho-CREB Induction with the Transgene in PVN
Low power sections through the PVN from transgenic mice killed 10 min after ip injection of 0.15 M saline (A) or 1.5 M saline (B). C shows high power oil immersion photomicrographs of cells stained for β-galactosidase and phospho-CREB imrnunoreactivities. The animals were handled daily for 5 days before the experiment to reduce the known effects of handling on induction of immediate early genes in the PVN. Minimal induction (as assessed by intensity of neuronal staining) is present in the PVN in both the control and 0.15 M saline groups compared with that in the stressed animals. Phospho-CREB is rapidly activated and may reflect the underlying mechanism by which CREB-like proteins bind to the regulatory sites within the proenkephalin gene, second messenger-inducible enhancer. Magnification: horizontal bars = 50 μm (A and B) and 10 μm(C).

References

    1. Comb M, Birnberg NC, Seasholtz A, Herbert E, Goodman HM. A cyclic AMP- and phorbol ester-inducible DNA element. Nature. 1986;323:353–356. - PubMed
    1. Hyman SE, Comb M, Lin YS, Pearlberg J, Green MR, Goodman HM. A common trans-acting factor is involved in transcriptional regulation of neurotransmitter genes by cyclic AMP. Mol Cell Biol. 1988;8:4225–4233. - PMC - PubMed
    1. Hyman SE, Comb M, Pearlberg J, Goodman HM. An AP-2 element acts synergistically with the cyclic AMP-and phorbol ester-inducible enhancer of the human proenkephalin gene. Mol Cell Biol. 1989;9:321–324. - PMC - PubMed
    1. Comb M, Mermod N, Hyman SE, Pearlberg J, Ross ME, Goodman HM. Proteins bound at adjacent DNA elements act synergistically to regulate human proenkephalin c AMP inducible transcription. EMBO J. 1988;7:3793–3805. - PMC - PubMed
    1. Sonnenberg JL, Rauscher FJ, Morgan Jl, Curran T. Regulation of proenkephalin by Fos and Jun. Science. 1989;246:1622–1625. - PubMed

Publication types

MeSH terms