

Effects of increasing dietary polyunsaturated fatty acids within the guidelines of the AHA step 1 diet on plasma lipid and lipoprotein levels in normal males
- PMID: 8199179
- PMCID: PMC3275914
- DOI: 10.1161/01.atv.14.6.892
Effects of increasing dietary polyunsaturated fatty acids within the guidelines of the AHA step 1 diet on plasma lipid and lipoprotein levels in normal males
Abstract
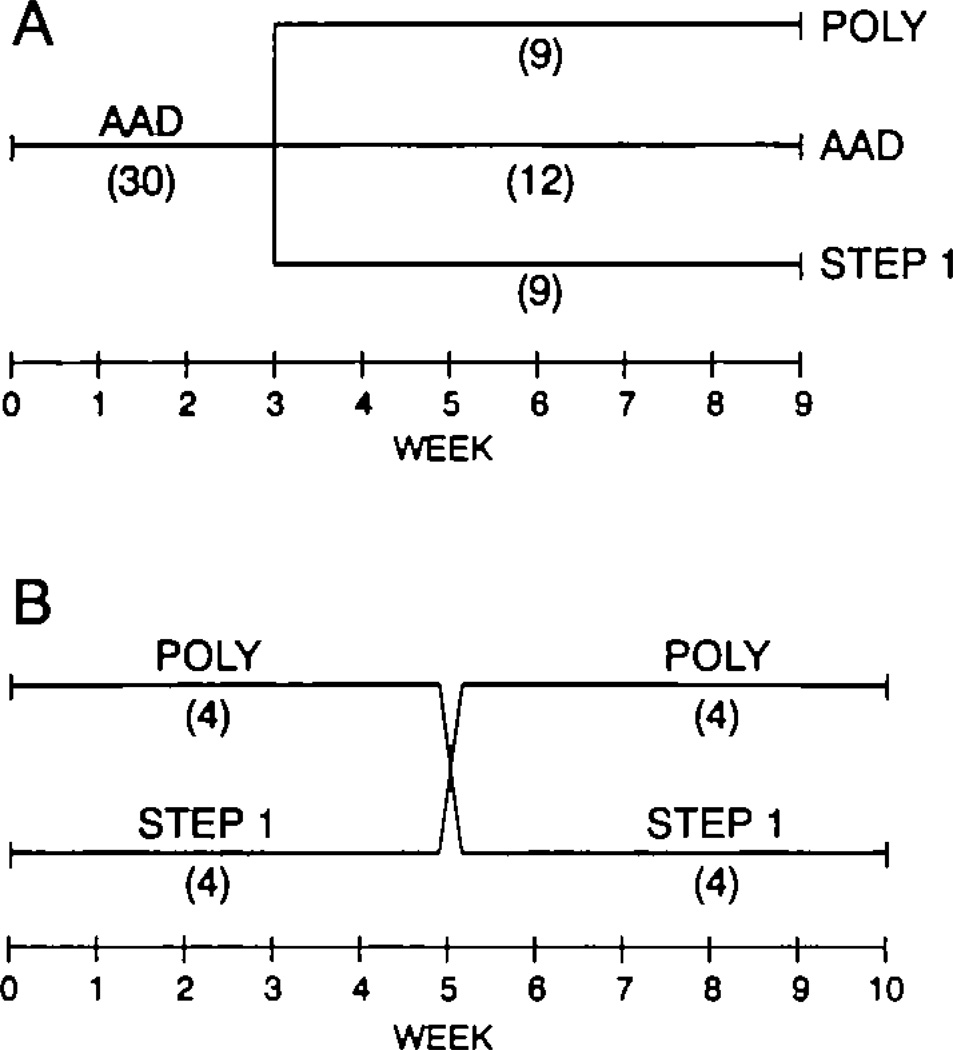
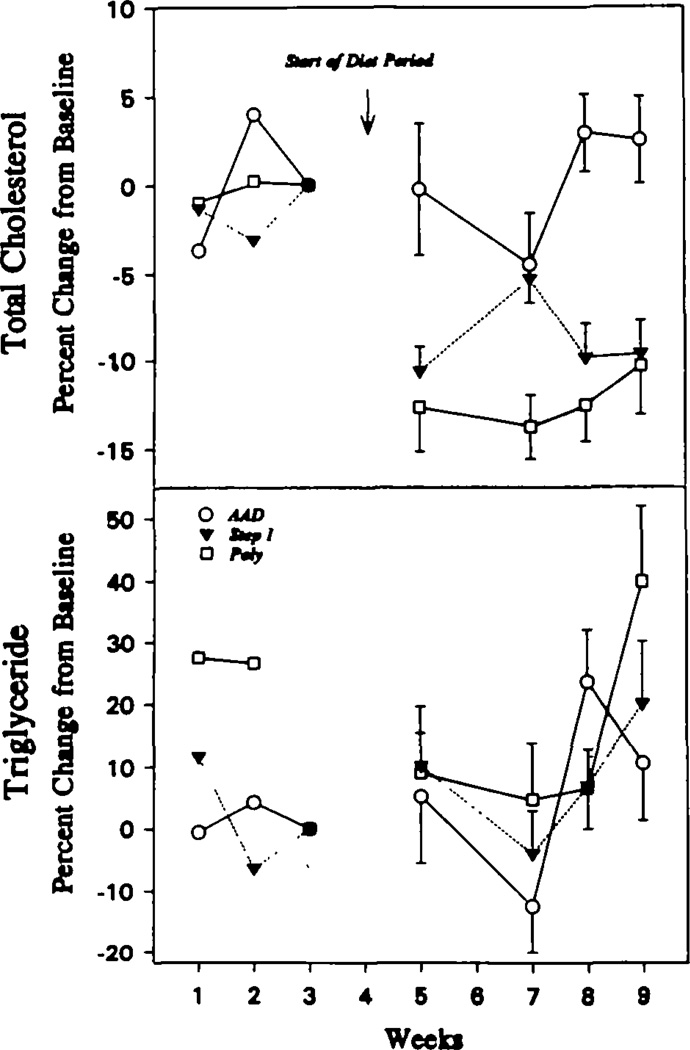
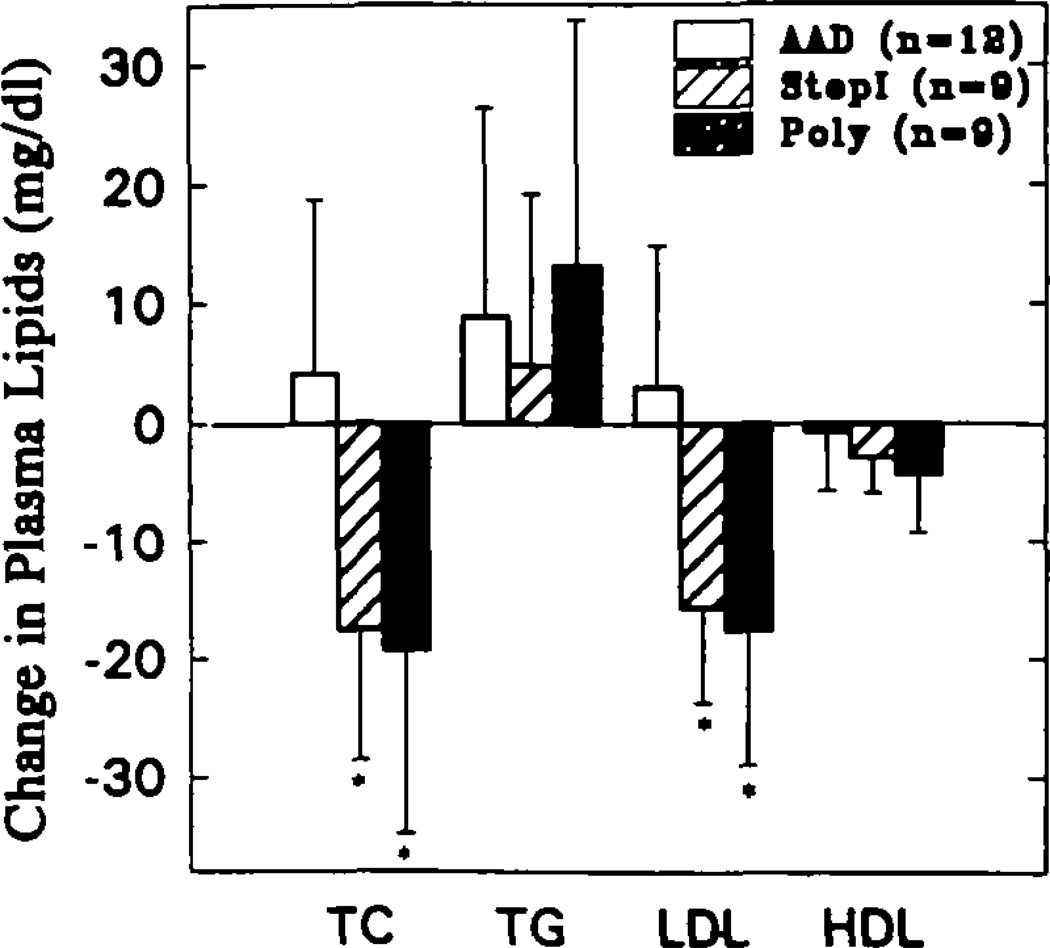
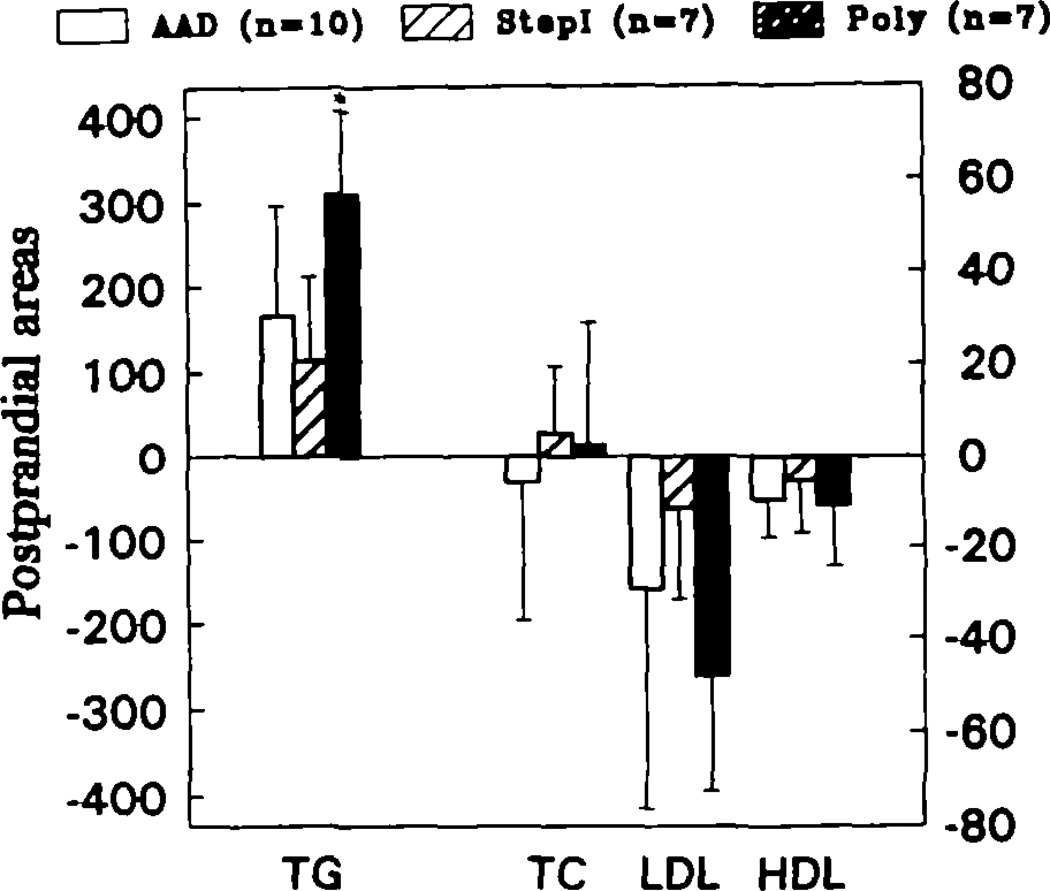
We attempted to ascertain the effects of polyunsaturated fatty acids by conducting two studies in normal young men, in which monounsaturated fats were replaced by polyunsaturated fats within the guidelines of the American Heart Association step 1 diet. Study A employed a randomized parallel design in which subjects first consumed an average American diet (AAD) containing 37% of calories as fat (saturated fat, 16% calories; monounsaturated fat, 14% calories; and polyunsaturated fat, 7% calories). After 3 weeks, one third of the subjects continued with the AAD, one third switched to a step 1 diet in which total fat calories were reduced to 30% by replacing saturated fat with carbohydrate, and one third switched to a polyunsaturated fat-enriched (Poly) diet with the same 30% fat calories and a reduction of monounsaturated fat from 14% to 8% and an increase of polyunsaturated fat from 7% to 13% of calories. The randomized period lasted 6 weeks. Total and low-density lipoprotein (LDL) cholesterol levels on the step 1 and Poly diets were reduced compared with levels on the AAD (P < .001). Total and LDL cholesterol did not differ between the step 1 and Poly diets, although comparison between the two diets is limited by the small study groups. Serum apolipoprotein (apo) B levels fell on the Poly diet compared with the AAD. Total high-density lipoprotein (HDL), HDL2, and HDL3 cholesterol levels were not significantly affected by the diets. Postprandial lipid and lipoprotein concentrations did not significantly differ either. In study B, a randomized crossover design was used in which all subjects ate the step 1 and Poly diets for 5 weeks each with a 4-day break between diets. In the eight subjects studied, the values for fasting plasma total, LDL, and HDL cholesterol; triglycerides; apoB; and apoA-I were essentially identical at the end of each diet period. Postprandial triglyceride areas obtained after ingestion of a large, standard fat load were also the same. Finally, LDL apoB and HDL apoA-I turnovers were unaffected by replacement of monounsaturates with polyunsaturates. In summary our results indicate that modest exchanges of monounsaturated for polyunsaturated fats do not significantly affect LDL or HDL levels or metabolism, which supports the view that reducing saturated fats is the key to lowering total and LDL cholesterol.
Figures
References
-
- Keys A, Anderson JT, Grande F. Serum cholesterol response to changes in the diet, IV: particular saturated fatty acids in the diet. Metabolism. 1965;14:776–787. - PubMed
-
- Hegsted DM, McGandy RB, Myers ML, Stare FJ. Quantitative effects of dietary fat on serum cholesterol in man. Am J Clin Nutr. 1965;17:281–295. - PubMed
-
- Mensink RP, Katan MB. Effect of dietary fatty acids on serum lipids and lipoproteins. Arterioscler Thromb. 1992;12:911–919. - PubMed
-
- The Expert Panel. Report of the National Cholesterol Education Program Expert Panel on detection, evaluation, and treatment of high blood cholesterol in adults. Arch Intern Med. 1988;148:36–69. - PubMed
-
- Ahrens EH, Jr, Blankenhorn DH, Tsaltas TT. Effect on human serum lipids of substituting plant for animal fat in diet. Proc Soc Exp Biol Med. 1954;86:872–878. - PubMed
Publication types
MeSH terms
Substances
Grants and funding
LinkOut - more resources
Full Text Sources
Medical
Research Materials
Miscellaneous