. 1993 Oct;10(3):247-57.
doi: 10.1016/0920-9964(93)90059-r.

ERP abnormalities during semantic processing in schizophrenia

Affiliations

ERP abnormalities during semantic processing in schizophrenia

J Adams et al. Schizophr Res. 1993 Oct.

Abstract

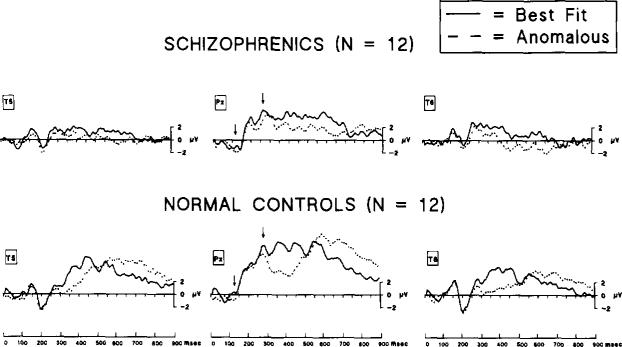
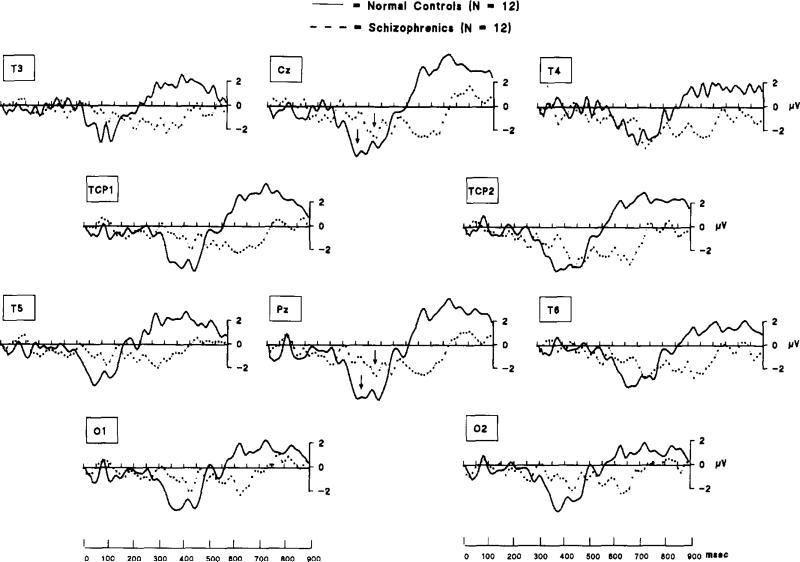
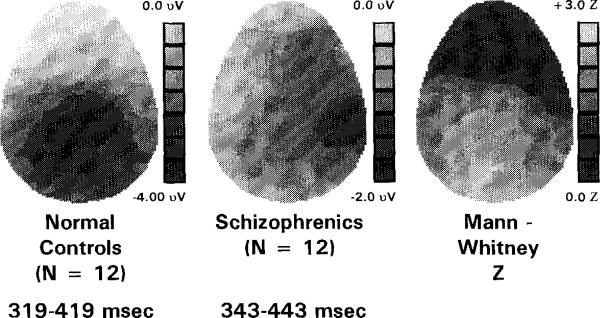
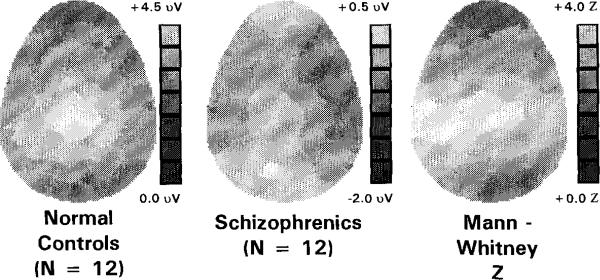
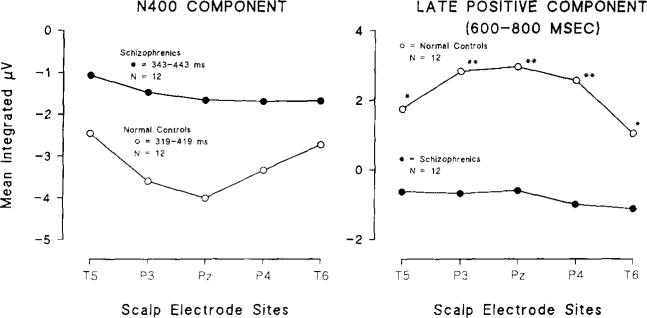
To examine the neurophysiological and cognitive characteristics of thought disturbance in schizophrenic patients, we examined the amplitude, latency, and topography of a specific event-related brain potential (ERP), the N400, which is elicited by semantically incongruent words and phrases. Twelve chronic schizophrenic patients and twelve age-matched control subjects read sentences presented visually that had either semantically correct (e.g., 'People pray in their local church') or incorrect endings (e.g., 'Every Sunday morning people pray in their local nest'). Relative to normal controls, schizophrenic patients had significantly reduced N400 amplitude and increased latency to semantically anomalous endings. Additionally, a late positive component which follows the N400 was significantly reduced in amplitude in schizophrenic patients. However, patients and controls did not differ significantly in terms of the topographical distribution of either the N400 or its late positive potential, examined at 28 electrode sites. Thus, N400 topography in schizophrenic patients was not accompanied by the asymmetry which frequently characterizes the well known auditory P300 disturbance in schizophrenic patients. We concluded that these findings may reflect a profound disturbance in attentional processes in chronic schizophrenia.


Figures

Fig. 1
Fig. 1
Grand-averaged waveforms elicited by ‘best fit’ (continuous line) and ‘anomalous’ (dashed line) end-of-sentence words in schizophrenics (top) and normal controls (bottom). In normal controls, note that the waveform associated with the ‘anomalous’ condition showed increased negativity (N400) in the 300–500 ms range and increased positivity (late positive component) in the 600–800 ms range with respect to the waveform associated with the ‘best-fit’ condition. Note, further, that these respective negativities and positivities in schizophrenics are negligible relative to normal controls. Voltage levels at time zero (baselines) were determined by the mean of a 100 ms prestimulus interval (not shown). Arrows (at Pz) indicate the approximate position of the mean N100 and P200 peak component latencies, respectively. Mean latency differences for these early components between groups were not statistically different. For both groups, n = 12.
Fig. 2
Fig. 2
Grand-averaged difference waveforms (‘anomalous’ minus ‘best-fit’) for schizophrenics (n = 12, continuous lines) and normal controls (n= 12, dashed lines). In normal controls, increased negativity (N400) was apparent in the 300–500 ms range, but is negligible for schizophrenics. Normal controls showed increased positivity (late positive component) in the 600–300 ms range; schizophrenics showed virtually no positivity in this time range. Arrows (at Cz and Pz) indicate the approximate position of the mean N400 peak component latencies for both schizophrenic patients and normal controls. Group latency differences were statistically significant.
Fig. 3
Fig. 3
Topographic distribution of N400 component activity (319–419 ms in normal controls and 343–443 ms in schizophrenics) and Mann-Whitney Z-SPM. Left and middle panels: These voltage maps show that normal controls produced a relatively symmetrical pattern of negativity (darker greys equal greater negativity), with a posterior minima at the midline. By contrast, schizophrenics showed a slightly greater negativity over right scalp than left. Grey-coded voltages are scaled differently for schizophrenics and normal controls to make scalp distributions clearly visible. Voltage scale maxima and minima are the following: normal controls = 0.0 to –4.0 μV; schizophrenics = 0.0 to –2.0 μV. Right panel, SPM: scale maxima and minima were the following: Z = + 3.0 to 0.0. The largest Z-values were in the left temporal-occipital scalp region (TCPl, P3, 01) with Z-values ranging from 2.02 to 2.60. The Z-values of neighboring centro-temporal electrodes (T3, C3, Cz, C4, T4) were 0.02 to 1.76.
Fig. 4
Fig. 4
Topographic distribution of late positive component (600–800 ms) and Mann-Whitney Z-SPM. Left and middle panels: Voltage maps show that normal controls produced a relatively symmetrical pattern of positivity (lighter greys equal greater positivity), with a posterior maximum at the central midline (lightest grey). By contrast, schizophrenics showed their greatest positivity over left occipital scalp. Grey-coded voltages are scaled differently for schizophrenics and normal controls to make scalp distributions clearly visible. Voltage scale maxima and minima are the following: normal controls = 4.5 to 0.0 μV; schizophrenics = +0.5 to –2.0 μV. Right panel, SPM: scale maxima and minima were the following: Z= +4.0 to 0.0. The largest Z-values were in the left temporal scalp region (T3, TCPl, C3, Cz), with Z-values ranging from 3.61 to 3.90. The Z-values of neighboring electrode sites ranged from 0.92 to 3.70.
Fig. 5
Fig. 5
Mean integrated N400 (left panel) and late positive component (right panel) amplitude compared by groups and scalp recording region. Despite large amplitude differences between groups, note that both groups showed amplitudes that were relatively symmetrical about the midline (Pz). Statistical differences (Bonferroni-corrected) of between-group amplitude differences by electrode site are asterisked (p < 0.05).

References

    1. Adams J, Faux SF, McCarley RW, et al. The N400 and language processing in schizophrenia.. Proceedings of the 9th International Conference on Event Related Potentials of the Brain (EPIC IX).1989. pp. 12–13.
    1. American Psychiatric Association, Committee on Nomenclature and Statistics . Diagnostic and Statistical Manual of Mental Disorder, Revised. Third Edition American Psychiatric Association; Washington, D.C.: 1987.
    1. Andreasen NC. Thought, language and communication disorders. I. Clinical assessment, definition of terms, and evaluation of their reliability. Arch. Gen. Psychiatry. 1979a;36:1315–1321. - PubMed
    1. Andreasen NC. Thought, language and communication disorders. II. Diagnostic significance. Arch. Gen. Psychiatry. 1979b;36:1325–1330. - PubMed
    1. Andreasen NC. Scale for the Assessment of Negative Symptoms (SANS) University of Iowa College of Medicine; Iowa City: 1981.

Publication types