. 1996 May 1;16(9):3104-11.
doi: 10.1523/JNEUROSCI.16-09-03104.1996.

Mouse model of hyperkinesis implicates SNAP-25 in behavioral regulation

Affiliations

Mouse model of hyperkinesis implicates SNAP-25 in behavioral regulation

E J Hess et al. J Neurosci. .

Abstract

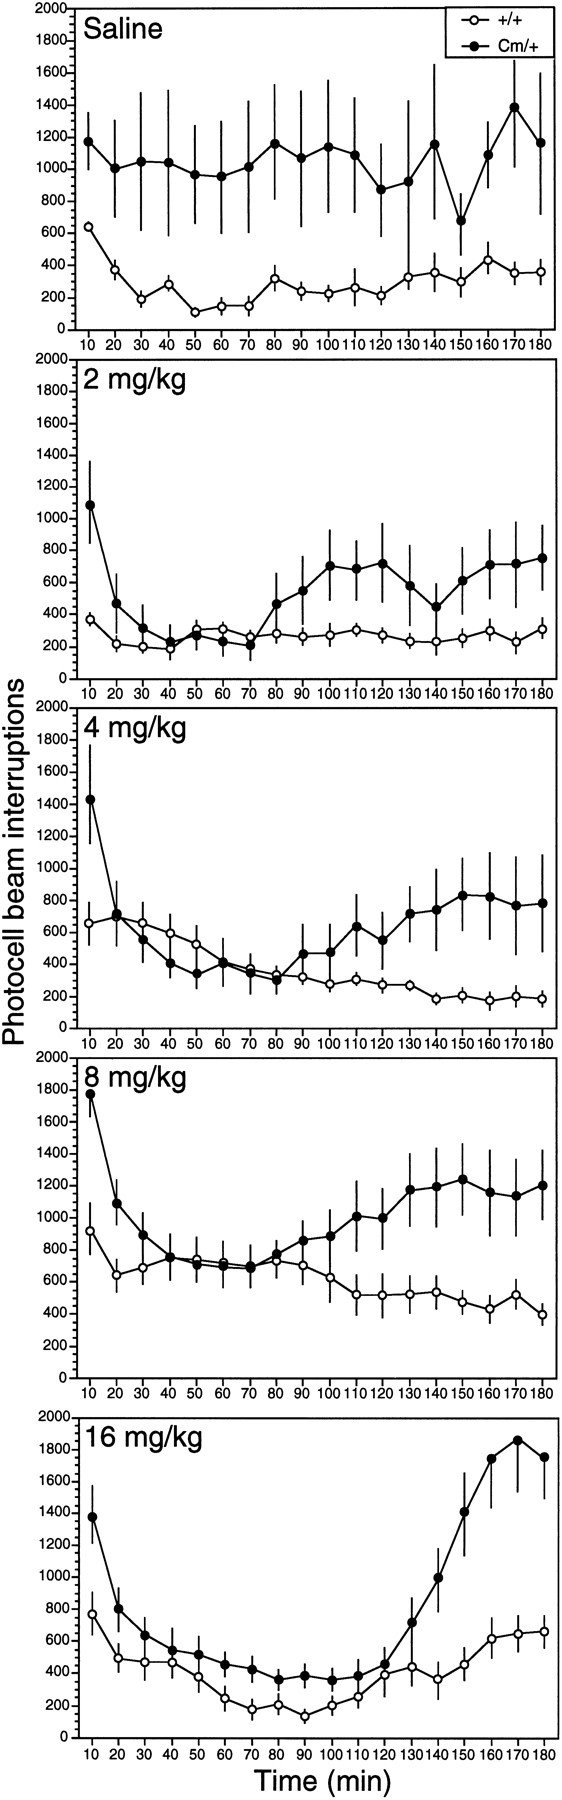
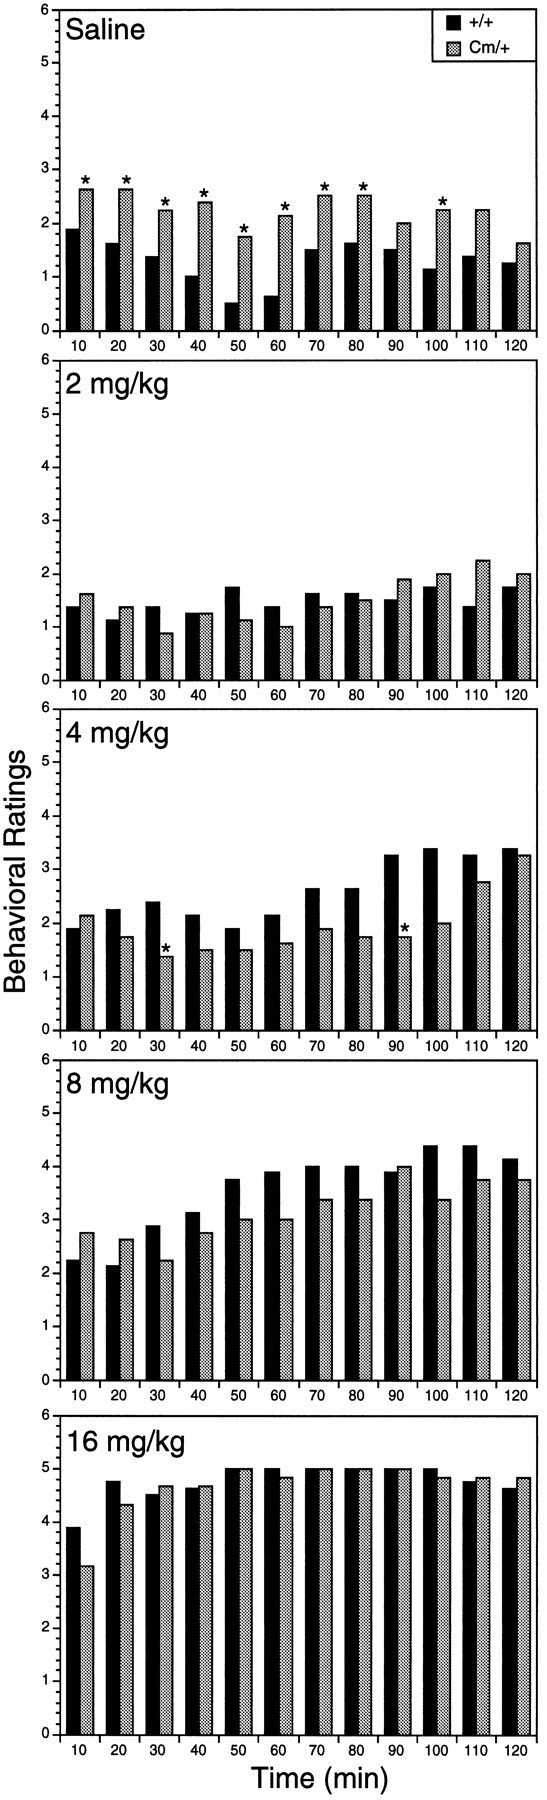
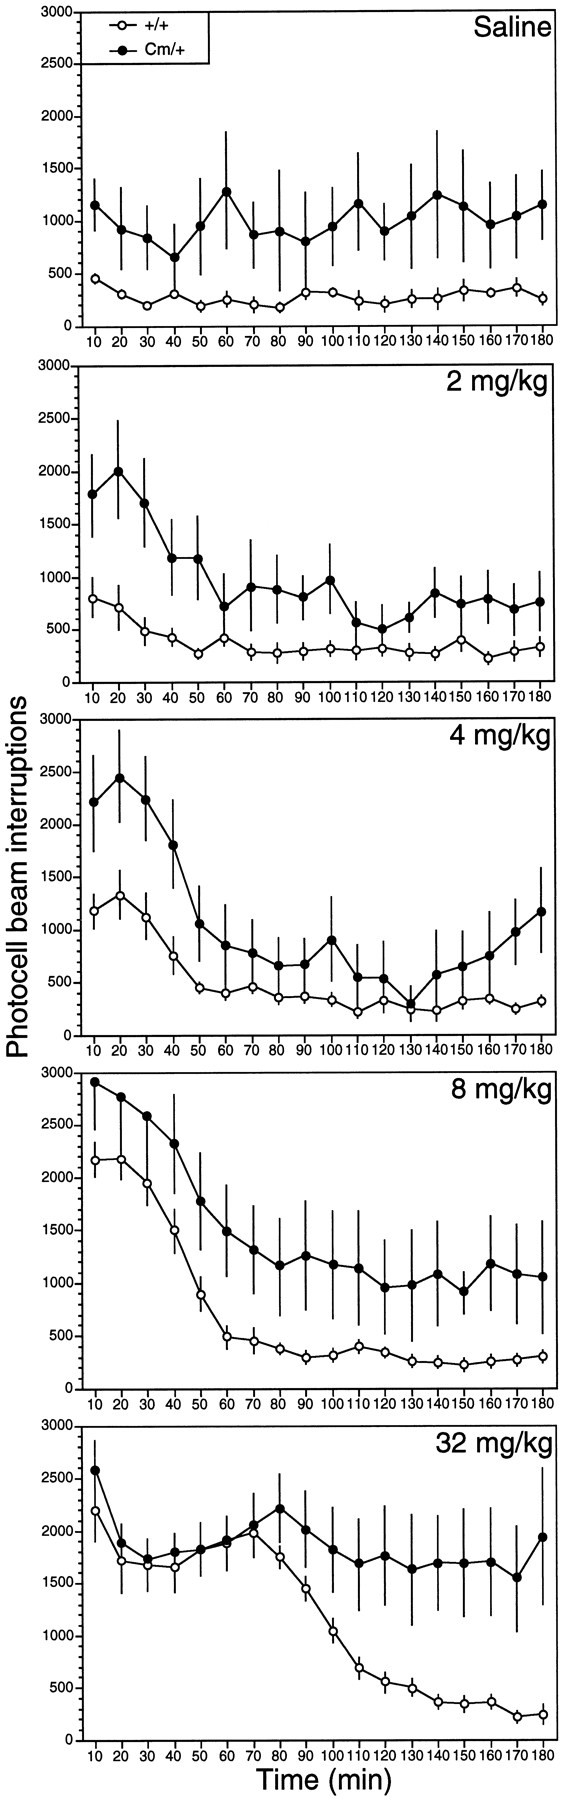
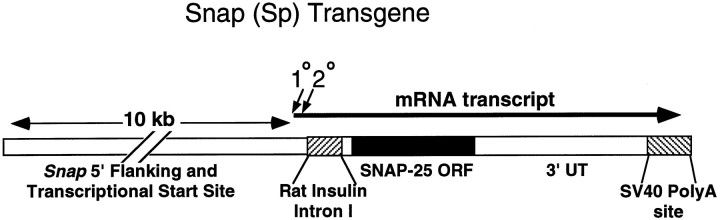
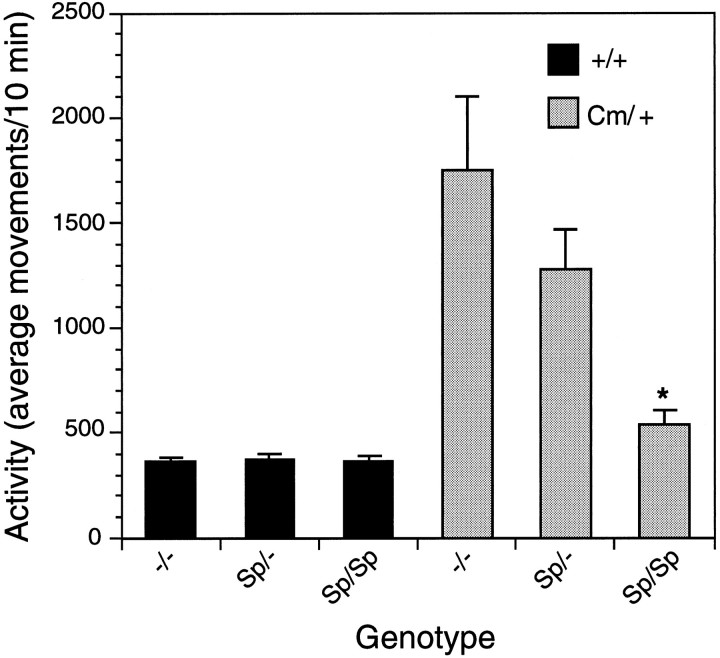
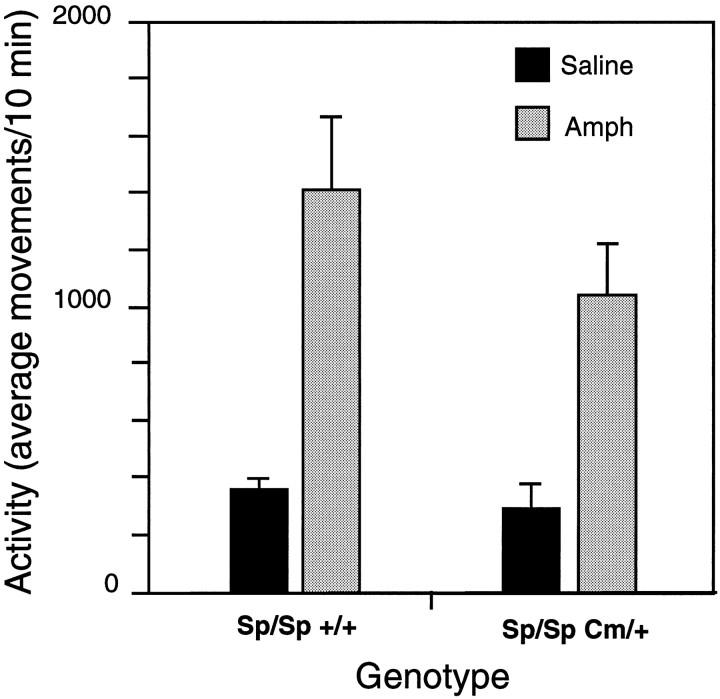
Although hyperkinesis is expressed in several neurological disorders, the biological basis of this phenotype is unknown. The mouse mutant coloboma (Cml+) exhibits profound spontaneous locomotor hyperactivity resulting from a deletion mutation. This deletion encompasses several genes including Snap, which encodes SNAP-25, a nerve terminal protein involved in neurotransmitter release. Administration of amphetamine, a drug that acts presynaptically, markedly reduced the locomotor activity in coloboma mice but increased the activity of control mice implicating presynaptic function in the behavioral abnormality. In contrast, the psychostimulant methylphenidate increased locomotor activity in both coloboma and control mice. When a transgene encoding SNAP-25 was bred into the coloboma strain to complement the Snap deletion, the hyperactivity expressed by these mice was rescued, returning these corrected mice to normal levels of locomotor activity. These results demonstrate that the hyperactivity exhibited by these mice is the result of abnormalities in presynaptic function specifically attributable to deficits in SNAP-25 expression.


Figures

Fig. 1.
Fig. 1.
Locomotor activity exhibited by control (n = 8) and coloboma (n = 8) mice after administration of saline or d-amphetamine sulfate. Mice were habituated to the test cages for 4 hr before subcutaneous injection, and photocell beam interruptions were recorded every 10 min for 3 hr postinjection. Data represent mean ± SEM. ANOVA for repeated measures indicated a significant genotype (F(1,14) = 6.18, p < 0.05) and repeated-measures (F(1,17) = 1.689, p < 0.05) effect for the saline treatment. A significant Genotype × Time interaction effect (F(17,238) = 1.69, p < 0.05 for 2 mg/kg; F(17,238) > 5.25, p < 0.001 for all other doses) was observed for all doses of d-amphetamine tested.
Fig. 2.
Fig. 2.
Behavioral rating scores for control (black bars; n = 8) and coloboma mice (graybars; n = 8) after administration of saline ord-amphetamine sulfate. Mice were rated every 10 min for 2 hr after injection. Data were analyzed using the Mann–WhitneyU test for nonparametric statistics; asterisksindicate significant difference between coloboma and wild-type littermates (p < 0.05). For ease of presentation, data are shown as mean scores.
Fig. 3.
Fig. 3.
Locomotor activity exhibited by control (n = 8) and coloboma (n = 8) mice after administration of saline or methylphenidate hydrochloride. Mice were habituated to the test cages for 4 hr before subcutaneous injection, and photocell beam interruptions were recorded every 10 min for 3 hr postinjection. Data represent mean ± SEM. ANOVA for repeated measures indicated a significant repeated-measures effect for 4 mg/kg methylphenidate (F(1,17) = 18.514, p < 0.0005) and 8 mg/kg methylphenidate (F(1,17) = 38.291, p < 0.0005) with no significant effects of groups or interaction for either dose. A significant Genotype × Time interaction effect was observed for 2 mg/kg methylphenidate (F(17,238) = 2.164, p < 0.01) and 32 mg/kg methylphenidate (F(17,238) = 5.409, p < 0.0005).
Fig. 4.
Fig. 4.
The mini-Snap transgene. TheSnap promoter was fused to a SNAP-25 cDNA and a rat insulin intron, and SV40 polyadenylation signals were added to provide post-transcriptional processing sites. Diagonal arrowsindicate the two transcriptional start sites.
Fig. 5.
Fig. 5.
Localization of Snap transgene mRNA expression. Parasagittal sections were hybridized with a probe to the SV40 polyadenylation sequence (a) or a probe to the murine SNAP-25 cDNA (b). The SV40 probe was hybridized to a section from an Sp/Sp +/+ mouse derived from founder 40, revealing the distribution of the transgene expression (a). A similar pattern of transgene expression was observed in several other founder lines. The SNAP-25 probe was hybridized to a section obtained from a −/− +/+ littermate to illustrate the localization of endogenous SNAP-25 mRNA expression for comparison with the transgene expression. Sections were processed in parallel in the same experiment and apposed to x-ray film for ∼60 hr.
Fig. 6.
Fig. 6.
Complementation of spontaneous hyperactivity in coloboma mice by the Snap transgene (Sp). Progeny (n = 92) generated from an Sp/− +/+ × Sp/−Cm/+ cross were tested for spontaneous locomotor activity. Activity was recorded for 3 hr and is expressed as average movements per 10 min. Data represent mean ± SEM. Data were analyzed by one-way ANOVA followed by a Scheffe’s post hoc test. Asteriskindicates significantly different (p < 0.05) from −/−Cm/+ mice derived from the same cross. Note that the locomotor activity expressed by Sp/Sp Cm/+ mice was not significantly different from +/+ mice either with or without the transgene. All data presented were obtained from a single transgenic founder (line 40); similar results have been obtained from the progeny of the same cross matings with two additional founder lines (lines 4 and 45) wherein homozygosity for the transgene was also effective in significantly reducing the hyperactivity of Cm/+ mice.
Fig. 7.
Fig. 7.
Complementation of the abnormal amphetamine response in coloboma mice by the Snap transgene (Sp). Sp/Sp +/+ (n = 9) and Sp/Sp Cm/+ (n = 6) derived from line 40 were administered 4 mg/kgd-amphetamine after a 4 hr habituation to the testing room and locomotor activity was assessed. The data represent the mean ± SEM of the activity of 10 min intervals taken over a 60 min period starting 10 min after injection; a two-way ANOVA reveals a significant drug effect (F(1,26) = 25, p = 0.0001), but no significant effect of genotype (F(1,26) = 1.4, p = 0.24) or drug/genotype (F(2,26) = 0.65, p = 0.43) interaction.

References

    1. Anastopoulos AD, Barkley RA. Biological factors in attention deficit-hyperactivity disorder. Behav Ther. 1988;11:47–53.
    1. Arnold LE, Christopher J, Huestis R, Smeltzer DJ. Methylphenidate vs dextroamphetamine vs caffeine in minimal brain dysfunction. Arch Gen Psychiatry. 1978;35:463–473. - PubMed
    1. Bark IC. Structure of the chicken gene for SNAP-25 reveals duplicated exons encoding distinct isoforms of the protein. J Mol Biol. 1993;233:67–76. - PubMed
    1. Bark IC, Wilson MC. Regulated vesicular fusion in neurons: snapping together the details. Proc Natl Acad Sci USA. 1994;91:4621–4624. - PMC - PubMed
    1. Bark IC, Hahn KM, Ryabinin AE, Wilson MC. Differential expression of SNAP-25 protein isoforms during divergent vesicle fusion events of neural development. Proc Natl Acad Sci USA. 1995;92:1510–1514. - PMC - PubMed

Publication types

MeSH terms

LinkOut - more resources