. 1996 May 15;16(10):3412-26.
doi: 10.1523/JNEUROSCI.16-10-03412.1996.

Morphological correlates of bilateral synchrony in the rat cerebellar cortex

Affiliations

Morphological correlates of bilateral synchrony in the rat cerebellar cortex

C I De Zeeuw et al. J Neurosci. .

Abstract

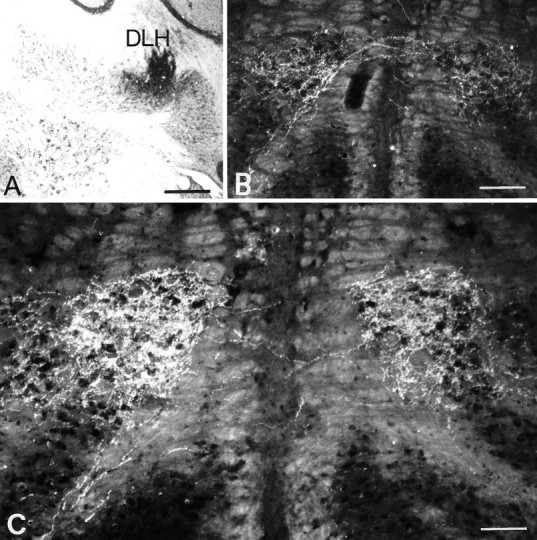
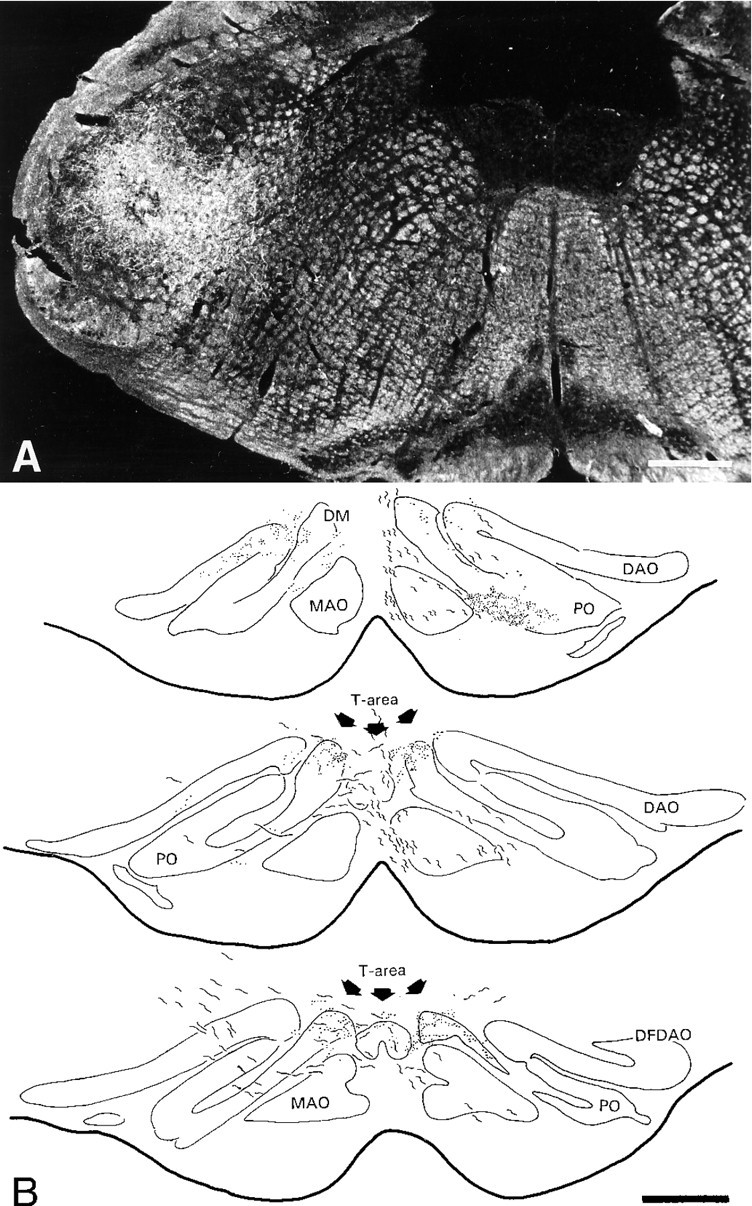
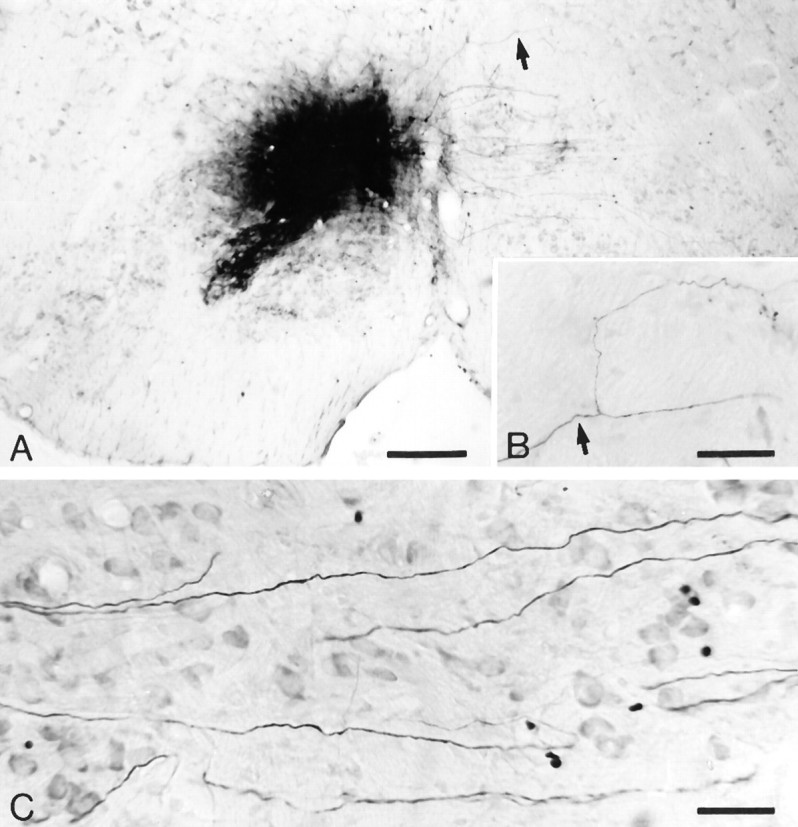
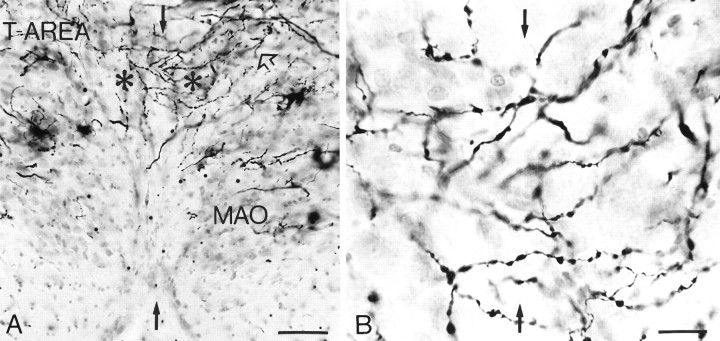
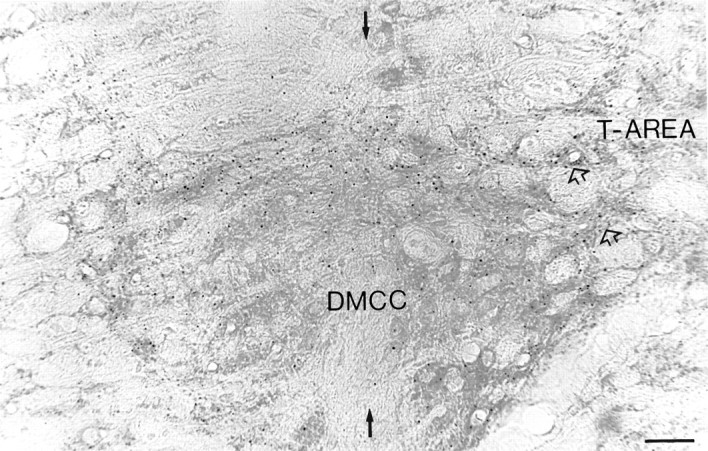
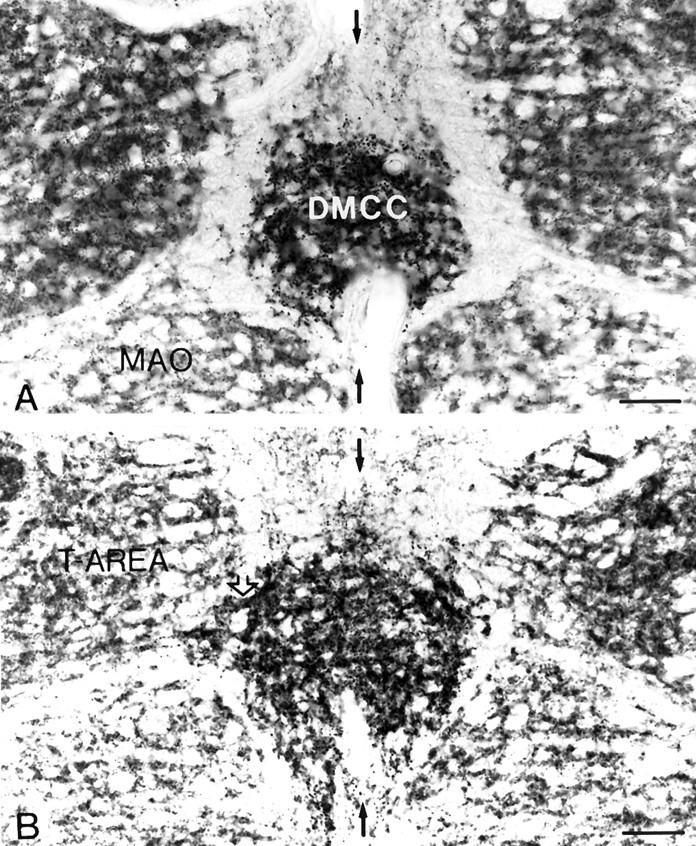
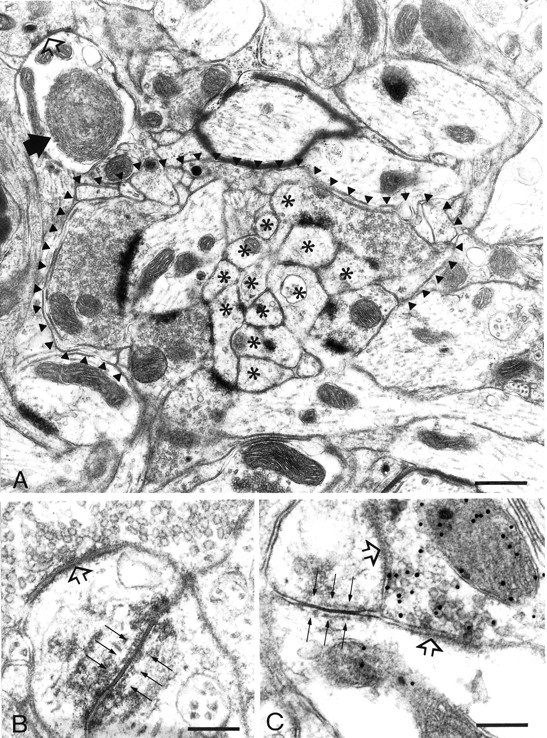
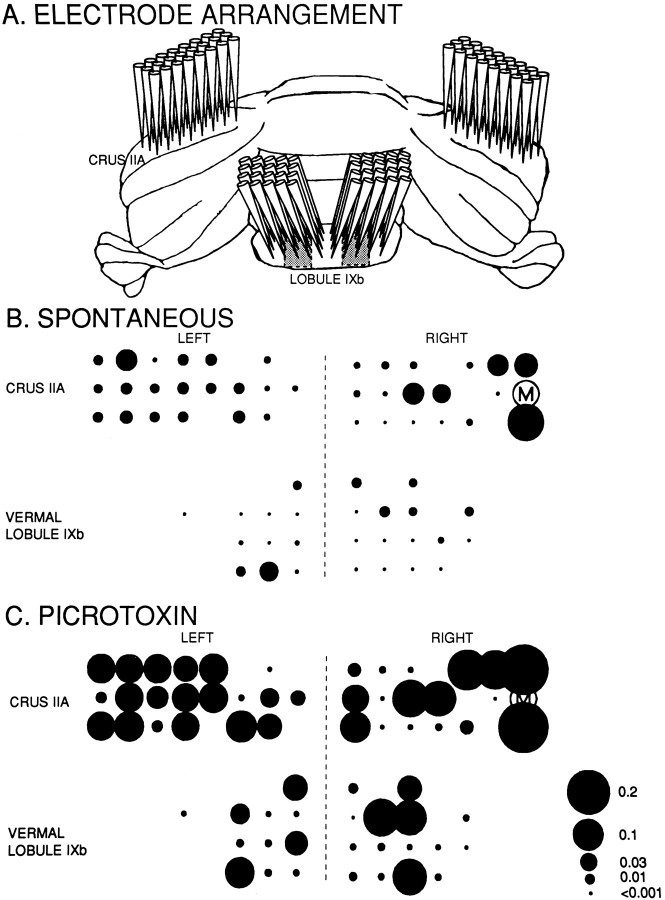
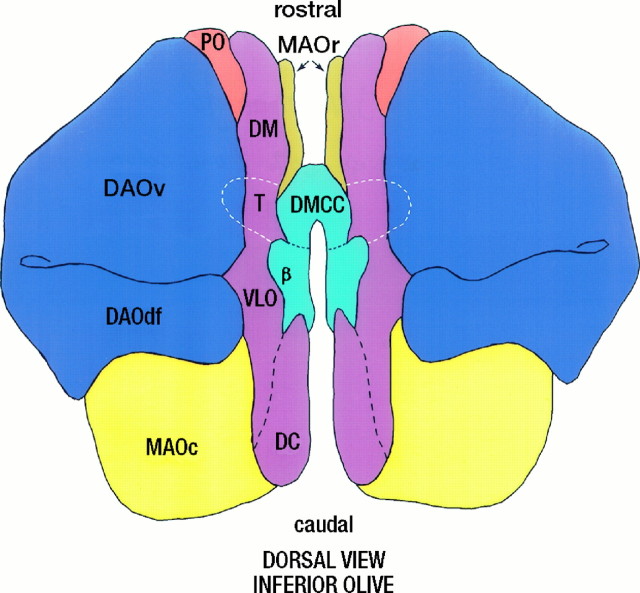
Simultaneous recordings of the left and right crus IIA of the cerebellar cortex in the rat have demonstrated that Purkinje cells of both sides can be activated synchronously by their climbing fibers. Because climbing fibers arise exclusively from the contralateral inferior olive (IO), this physiological finding seems to contradict the anatomy. To define the structural basis responsible for the bilateral synchrony, we examined the possibilities that bilateral common afferent inputs to the IO and interolivary connections form the underlying mechanisms. The bilaterality of the major afferents of the olivary regions that project to crus IIA was studied using Phaseolus vulgaris leucoagglutinin as an anterograde tracer. We found that the excitatory and inhibitory projections from the spinal trigeminal nucleus and dorsolateral hump of the interposed cerebellar nucleus to the transition area between the principal olive and dorsal accessory olive were bilateral. A second possible mechanism for bilateral synchrony, which is the possibility that axons of olivary neurons provide collaterals to the contralateral side, was investigated using biotinylated dextran amine as an anterograde tracer. Labeled axons were traced and reconstructed from the principal olive and dorsal and medial accessory olive up to the entrance of the contralateral restiform body. None of these axons gave rise to collaterals. The possibility that neurons in the left and right IO are electronically coupled via dendrodendritic connections was investigated by examining the midline region of the IO. The neuropil of the left and right IO is continuous in the dorsomedial cell column. Examination of Golgi impregnations of this subdivision demonstrated that (1) many dendrites cross from one side to the other, (2) neurons close to the midline give rise to dendrites that extend into both olives, and (3) dendrites of neurons in the dorsomedial cell column frequently traverse into adjacent olivary subdivisions such as the medial accessory olive and the transition area between the principal olive and dorsal accessory olive. Sections immunostained for dendritic lamellar bodies or GABAergic terminals showed the same pattern: the neuropils of the dorsomedial cell columns on both sides form a continuum with each other as well as with the neuropil of other adjacent olivary subdivisions. Ultrastructural examination of the dorsomedial cell column demonstrated that the midline area includes many complex glomeruli that contain dendritic spines linked by gap junctions. To verify whether the complex spike synchrony observed between left and right crus IIA could indeed be mediated in part through coupled neurons in the dorsomedial cell column, we recorded simultaneously from crus IIA areas and from left and right vermal lobule IX, which receives climbing fibers from the dorsomedial cell column. In these experiments we demonstrated that the climbing fibers of all four areas, i.e., the left and right crus IIA as well as the left and right lobule IX, can fire synchronously. The present results indicate that synchronous climbing fiber activation of the left and right crus IIA in the rat can be explained by (1) bilateral inputs to the transition areas between the principal olive and dorsal accessory olive and (2) dendrodendritic electrotonic coupling between neurons of the left and right dorsomedial cell column and between neurons of the dorsomedial cell column and adjacent olivary subdivisions.


Figures

Fig. 1.
Fig. 1.
Unilateral injection of PHA-L in the dorsolateral hump (DLH) of the interposed cerebellar nucleus (A) and bilateral projection in the T-area of the IO (B, C). Note the symmetry and the density of the anterograde labeling. Scale bars: A, 500 μm; B, 150 μm;C, 80 μm.
Fig. 2.
Fig. 2.
Unilateral injection of PHA-L in the pars interpolaris of the spinal trigeminal nucleus (A) and a reconstruction of the bilateral projection in the T-area of the IO (B). Projections were seen unilaterally in various olivary subdivisions such as the contralateral caudal DAO (not shown) and PO. The T-area was the only olivary region that received a bilateral input from the trigeminal nucleus. DM, Dorsomedial group; MAO, medial accessory olive;DAO, dorsal accessory olive; PO, principal olive;DFDAO, dorsal fold DAO. Scale bars: A, 460 μm;B, 410 μm.
Fig. 3.
Fig. 3.
An injection of BDA centered on the T-area of the IO (A) that provided labeled olivary axons passing through the contralateral IO (C). None of these fibers gave rise to axon collaterals. B, In contrast, some of the retrogradely labeled fibers in the reticular formation did show collaterals.Arrows in A and B indicate origin of collateral in the reticular formation. Scale bars: A, 240 μm; B, 59 μm; C, 41 μm.
Fig. 4.
Fig. 4.
A, Micrograph of the left and right DMCC (asterisks) from a Golgi-impregnated section of the rat brainstem. The dendrites course from one side to the other, and they even traverse from the DMCC to adjacent olivary subdivisions (open arrow). Black arrows indicate midline, andT-AREA indicates transition area between principal olive and dorsal accessory olive. B, High-power micrograph of the midline between left and right DMCC. MAO, Medial accessory olive. Scale bars: A, 100 μm; B, 25 μm.
Fig. 5.
Fig. 5.
Micrograph of the DMCC in a section processed for immunocytochemistry with antiserum α12B/18, which detects specifically dendritic lamellar bodies; each dotcorresponds to one dendritic lamellar body (De Zeeuw et al., 1995a). Note that the lamellar bodies were distributed most prominently in the periphery of the DMCC. Black arrows indicate midline, andopen arrows indicate the continuity between DMCCand T-AREA. Scale bar, 17 μm.
Fig. 6.
Fig. 6.
Micrographs of the DMCC in sections processed for immunocytochemistry with antiserum against GAD. The DMCC inA is totally separated from the adjacent subdivisions.B, At a more rostral level, the DMCC is continuous with theT-AREA (open arrows) and the medial accessory olive (MAO). In both sections, it is evident that the GABAergic input to the DMCC is more prominent than the adjacent subdivisions. Black arrows indicate midline. Scale bars:A, 85 μm; B, 90 μm.
Fig. 7.
Fig. 7.
Electron micrographs from the midline area in the DMCC (A, B) and the continuum between the DMCC and the T-area (C). A, A complex glomerulus in the DMCC includes many dendritic elements (asterisks). Note that the dendritic lamellar body (black arrow) is located just outside the glomerulus delineated by the arrowheads. B, Higher magnification of a gap junction (thin arrows) in the midline area of the DMCC. C, A GABAergic terminal labeled with postembedding immunogold is apposed to dendritic spines coupled by a gap junction (thin arrows). Open arrowsindicate symmetric synapses. Scale bars: A, 0.8 μm;B, 0.18 μm; C, 0.28 μm.
Fig. 8.
Fig. 8.
An example of multiple electrode recording from Purkinje cells in the molecular layer of a rat cerebellar cortex.A, Schematic illustration of the simultaneous recordings from the left and right hemispheric crus IIA areas and from lobule IXb. Electrodes were implanted into a 3 × 8 array in each crus IIA, whereas in each lobule IXb, electrodes were implanted into a 4 × 5 array. All electrodes were spaced 250 μm apart in both the rostrocaudal and mediolateral direction. The climbing fiber zone of the DMCC is at most 0.5 mm wide, starting ∼750 μm from the midline (indicated byshaded areas in lobule IXb) (Eisenman, 1984; Apps, 1990). We placed the vermal electrodes to attempt to record from this region with as many electrodes as possible. The five columns of electrodes in lobule IXb were positioned ∼0.5 mm, 0.75 mm, 1 mm, 1.25 mm, and 1.5 mm from the midline. B, C, spatial distribution of synchrony during spontaneous activity and after systemic administration of picrotoxin, respectively. Represented here are the recordings of only those electrodes whose CS isolations were retained for the entire experiment (n = 64). The master cell (M) used for the cross-correlation analysis presented in this illustration is the same in B as in C. Average cross-correlation coefficients were calculated from analyses in which every cell served as a master cell for one analysis (for outcomes, see Table 1). The total number of CSs was 101.178 in B (42.6 min of recording) and 277.412 in C (41.4 min). Note that all four areas, including the DMCC zones, can fire in synchrony both during spontaneous activity and after application of picrotoxin. The diameters of theblack circles correspond to the correlation coefficients between the individual cells and the master cell.
Fig. 9.
Fig. 9.
Diagram of the left and right rat IO that are connected in the middle via the DMCC and the T-area (indicated bydashed line). PO, principal olive;MAO, medial accessory olive; DAO, dorsal accessory olive; DM, dorsomedial group; VLO, ventrolateral outgrowth; DC, dorsal cap; β, β-nucleus (for definitions of olivary subdivisions, see Kooy, 1916; Brodal, 1940;Whitworth and Haines, 1986; Nelson and Mugnaini, 1988).
Fig. 10.
Fig. 10.
Estimate of number of gap junctions between IO neurons. A, Circuit showing cells 0 and 1, which are coupled by a gap junctional conductance (Gj). Circuit assumes all injected current flows through Gjinto cell 1. B, More realistic circuit showing cell 0 coupled to X; other neurons via identical junctional conductancesGj. All cells have membrane conductanceGm. In both A and B, a 0.5 nA current pulse into cell 0 produces a 10 mV response in that cell and a 2.5 mV response in cells 1 through X (values based on Fig. 9 ofLlinás and Yarom, 1981a). If we assume that all the injected current flowed through the gap junctional conductance (i.e., no current was lost through the membrane of cell 0), then using Ohm’s law we can calculate an upper limit for the total conductance between the two cells of 0.5 nA/(10 mV − 2.5 mV) = 66.7 nS. C, Plot ofGj versus X for three values ofRm. Dashed line indicates 3.0 nS, the estimated conductance of a single gap junction. The point at which each curve crosses this line gives an estimate of the maximum number of coupled cells to cell 0.

References

    1. Adams JC. A fast, reliable silver-chromate Golgi method for perfusion-fixed tissue. Stain Technol. 1979;54:225–226. - PubMed
    1. Aggelopoulos NC, Duke C, Edgley SA. Non-uniform conduction time in the olivocerebellar pathway in the anaesthetized cat. J Physiol (Lond) 1994;476:26–27. - PMC - PubMed
    1. Angaut P, Sotelo C. Synaptology of the cerebello-olivary pathway: double labeling with anterograde axonal tracing and GABA immunocytochemistry in the rat. Brain Res. 1989;479:361–365. - PubMed
    1. Apps R. Columnar organisation of the inferior olive projection to the posterior lobe of the rat cerebellum. J Comp Neurol. 1990;302:236–254. - PubMed
    1. Azizi S, Woodward DJ. Inferior olivary nuclear complex of the rat: morphology and comments on the principles of organization within the olivocerebellar system. J Comp Neurol. 1987;263:467–484. - PubMed

LinkOut - more resources