. 1996 Jun 1;16(11):3601-19.
doi: 10.1523/JNEUROSCI.16-11-03601.1996.

Tau is enriched on dynamic microtubules in the distal region of growing axons

Affiliations

Tau is enriched on dynamic microtubules in the distal region of growing axons

M M Black et al. J Neurosci. .

Abstract

It is widely held that tau determines the stability of microtubules in growing axons, although direct evidence supporting this hypothesis is lacking. Previous studies have shown that the microtubule polymer in the distal axon and growth cone is the most dynamic of growing axons; it turns over more rapidly and is more sensitive to microtubule depolymerizing drugs than the polymer situated proximally. We reasoned that if the stability of axonal microtubules is directly related to their content of tau, then the polymer in the distal axon should have less tau than the polymer in the proximal axon. We tested this proposition by measuring the relative tau content of microtubule along growing axons of cultured sympathetic neurons immunostained for tau and tubulin. Our results show that the tau content of microtubules varies along the axon, but in the opposite way predicted. Specifically, the relative tau content of microtubules increases progressively along the axon to reach a peak near the growth cone that is severalfold greater than that observed proximally. Thus, tau is most enriched on the most dynamic polymer of the axon. We also show that the gradient in tau content of microtubules does not generate corresponding gradients in the extent of tubulin assembly or in the sensitivity of axonal microtubules to nocodazole. On the basis of these findings, we propose that tau in growing axons has functions other than promoting microtubule assembly and stability and the key sites for these functions are the distal axon and growth cone.


Figures

Fig. 1.
Fig. 1.
Characterization of polyclonal antibodies against tau. A shows a schematic of the tau cDNA, the primers used for RT-PCR, and the constructs used to prepare fusion proteins for use in antibody production. The sequences of the primers, from 5′ to 3′, are as follows: primer 5TA, CTC GGA TCC GCT GAA CCC CGC CAG GAG TTT; primer 5TB, CTC GAA TTC CTT GAG TCA CAT GCC CAG CAG C; primer 3TA, CTC GGA TTC GAA ACC CAC AAG CTG ACC; primer 3TB, CTC GAA TTC ACA AAC CCT GCT TGG CCA A. B–D show portions of blots of soluble extracts of immature rat brain, adult rat brain, and cultured sympathetic neurons (lanes 1, 2, and 3, respectively) probed by the tau-3′ polyclonal (B), tau1 + tau49 monoclonal (C), and tau-5′ polyclonal (D) antibodies against tau; ∼10–30 μg of each type of type was applied to the gels. The polyclonal and monoclonal antibodies recognize the same set of bands in each type of sample.
Fig. 6.
Fig. 6.
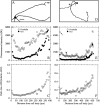
Quantitative analyses of the relative amounts of total tubulin and total tau along the axon. Cells fixed and then permeabilized (according to procedure 4) were double-stained for β-tubulin and tau according to staining condition 2. Images of the cells were obtained with the cooled CCD camera and then analyzed using the segmented mask procedure. Data from two representative neurons are shown. A and D show computer-generated tracings of these neurons; scale bar, 56 μm. B and Eshow the fluorescence intensity for tubulin and tau plotted against distance from the cell body. C and F show the ratio of tau fluorescence-to-tubulin fluorescence plotted against distance from the cell body. The arrow in Aidentifies the axon subjected to quantitative analysis. Thearrows in D–F indicate branch points, while thearrowheads indicate where two axons cross over each other.
Fig. 11.
Fig. 11.
Quantitative analyses of the relative amounts of assembled tubulin and assembled tau along the axon. Cells processed by combined fixation and extraction (according to procedure 3) were double-stained for β-tubulin and tau according to staining condition 2. Images of the cells were obtained with the cooled CCD camera and then analyzed using the segmented mask procedure. Data from two representative neurons are shown. A and D show computer-generated tracing of these neurons; scale bar, 56 μm.B and E show the fluorescence intensity for tubulin and tau plotted against distance from the cell body.C and F show the ratio of tau fluorescence-to-tubulin fluorescence plotted against distance from the cell body. The arrows in D–F indicate branch points.
Fig. 7.
Fig. 7.
Quantitative analyses of the volume densities of tubulin and tau along the axon. Cells fixed and then permeabilized (according to procedure 4) were double-stained for β-tubulin and tau according to staining condition 2. Images of the cells were obtained with the cooled CCD camera and then analyzed using the segmented mask procedure. For each axon analyzed, we determined the volume (in μm3), the fluorescence intensity of β-tubulin, and the fluorescence intensity of tau for each axon segment. To calculate the volume densities of β-tubulin and tau for each axon segment, the fluorescence intensities attributable to β-tubulin and tau for each segment were divided by segment volume. The resulting segment volumes and volume densities were plotted against distance from the cell body. Data from two representative neurons are shown. A and B show the data from one neuron (the same neuron shown in Fig. 5A–C), whereas C andD show the results from a different neuron (the same neuron shown in Fig. 5D–F). A and C show the volume of each segment plotted against distance from the cell body.B and D show the volume densities of β-tubulin and tau plotted against distance from the cell body. Thearrows and arrowheads in C andD are as defined for Figure5D–F.
Fig. 2.
Fig. 2.
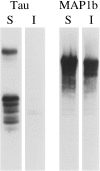
Immunoblot analyses of tau partitioning during extraction with an MT-stabilizing buffer containing Triton X-100. Cells were extracted with PHEM + 0.2% Triton X-100 + 10 μm taxol as described in Materials and Methods to obtain Triton-soluble and Triton-insoluble fractions, which contain unassembled and assembled MT proteins, respectively. The entire Triton-soluble and Triton-insoluble fractions were resolved on 4–10% gradient gels and then transferred to nitrocellulose. The transfer was first probed with the tau monoclonal cocktail and then, after obtaining the necessary exposures, the transfer was stripped and reprobed with the anti-MAP1b polyclonal antibody. Shown are portions of the resulting exposures showing the partitioning of tau and MAP1b between the Triton-soluble (S) and Triton-insoluble (I) fractions. Note that the middle portion of the immunoblot is shown for tau, whereas the top portion is shown for MAP1b.
Fig. 3.
Fig. 3.
Double-staining of neurons for tubulin and either tau (A–F) or MAP1b (G–J). The cells were processed according to procedure 1 and then stained using staining condition 1. A, C, E, G, and I show tubulin staining; B, D, and F show tau staining; andH and J show MAP1b staining. A andB show low-magnification images (scale bar, 56 μm) depicting the overall distribution of tubulin and tau in the neurons, whereas the remaining panels show higher-magnification views that reveal details of MT staining for tubulin, tau, and MAP1b under these fixation and staining conditions. Note that tubulin and tau are distributed throughout the axon but that tau does not colocalize with MTs in the growth cone, whereas MAP1b clearly decorates MTs in the growth cone to or near their tips (see also Black et al., 1994). Scale bar: A, B, 56 μm; C, D, G,H, 13 μm; E, F, I, J, 3 μm.
Fig. 4.
Fig. 4.
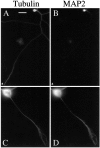
Double-staining of neurons for β-tubulin (A, C) and MAP2 (B, D). The cells were processed according to procedure 1 and then processed using staining condition 1. A and B show low-magnification views (scale bar, 56 μm) of typical neurons in 1-d-old cultures stained for tubulin and MAP2; the arrowheads identify the tip of the axon. Only faint staining of the axon for MAP2 is apparent, and this is seen in the proximal part of the axon. However, some neurons have relatively short axons with large growth cones that we presume are relatively immature. In these axons (C, D), MAP2 staining is more apparent than in the more typical axons, and it clearly colocalizes with MTs in spread regions where MTs can be visualized. Tau staining of similar axons does not show MT colocalization. Scale bar: C,D, 13 μm.
Fig. 5.
Fig. 5.
Double-staining of neurons for tubulin (A, C, E, G) and tau (B, D, F, H) in cells processed according to staining condition 2. A–D show low- and high-magnification views of cells processed using the combined fixation and extraction procedure of Lee and Rook (1992) (procedure 3).E–H show low- and high-magnification views of cells fixed without extraction according to procedure 4. Both procedures reveal that tau and tubulin staining are more intense in the distal part of the axon compared to its more proximal regions (see text for additional details), and that tau colocalizes with MTs in the growth cone (seeC, D, G, and H and Fig. 8). Scale bar inA = 56 μm and indicates scale in all low-magnification views (A, B, E, F). Scale bar in C = 13 μm and indicates scale in all high-magnification views (C, D, G, H).
Fig. 8.
Fig. 8.
Tau association with MTs in the growth cone. High-magnification views of growth cones were processed by combined fixation and extraction (according to procedure 3) and then double-stained for β-tubulin and tau using staining condition 1. Staining of two different growth cones is shown. A andD depict tubulin staining, B and Eshow tau staining, and C and F show pseudocolor representations of ratio images obtained by dividing, pixel by pixel, the image of tau staining by the image of tubulin staining. In the color key, red corresponds to relatively high ratios, whereas violet corresponds to relatively low ratios. The growth cone shown in A–C is representative of many growth cones examined, and shows that tau associates with MTs to or very near their tips, with no obvious decline in tau levels along the length of the MTs. The growth cone shown in D–F shows a distinct pattern that also occurred commonly in the cultures in which tau staining of growth cone MTs declines to near background levels over the distal few micrometers of the MTs. Scale bar, 13 μm.
Fig. 9.
Fig. 9.
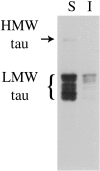
Immunoblot analyses of tau partitioning during extraction with an MT-stabilizing buffer containing saponin. Cells were extracted with PEM + 0.2% saponin + 10 μmtaxol as described in Materials and Methods to obtain saponin-soluble and saponin-insoluble fractions, which contain unassembled and assembled MT proteins, respectively. The entire amount of each fraction was resolved on 4–10% gradient gels, transferred to nitrocellulose, and then probed with the anti-tau polyclonal (tau-3′). Shown is a portion of a resulting exposure showing the partitioning of tau between the saponin-soluble (S) and saponin-insoluble (I) fractions. In this experiment, 96% of the tau partitioned with the saponin-soluble fraction. In three other experiments performed identically, 66, 99, and 99% of the total tau partitioned with the saponin-soluble fraction. The basis for the apparently spuriously low result in one of four experiments is unknown.
Fig. 10.
Fig. 10.
Effects of nocodazole on the intensity of axonal staining for tubulin and tau. Cells were treated with or without nocodazole (5 μg/ml) for 30 min, and then processed by combined extraction and fixation (procedure 3, A–D, G, H) or by fixation without extraction (procedure 4, E, F), and then double-stained for tubulin (A, C, E, G) and tau (B, D, F, H) using staining condition 1. A andB show a control cell demonstrating typical staining patterns for tubulin and tau, respectively. The intensity of staining in drug-treated cells is dependent on the conditions of fixation. With combined fixation and extraction (C, D), tubulin and tau staining is reduced to negligible levels compared to controls, whereas with fixation without extraction, tubulin and tau staining is strong. The cell shown in C and D is shown again inG and H, but scaled to better reveal the dim staining remaining in this cell. Entirely similar results were also obtained using a modified procedure 3 in which the Triton X-100 treatment after fixation was omitted. Note that staining for tubulin and tau is at or near background in the distal 30–40 μm of the axon (see C, D, G, H). The arrowheads identify non-neuronal cells (non-neuronal cells processed by combined fixation and extraction and then viewed at higher magnification contain a few wavy MTs; data not shown), the single-headedarrows identify the axon tip in drug-treated cells, and thedouble-headed arrows identify a gap in staining along the length of a drug-treated axon.
Fig. 12.
Fig. 12.
Quantitative analyses of the time course of nocodazole effects on the amount of MT polymer in the axon. Cultures were treated with 5 μg/ml nocodazole for 0, 10, or 20 min and processed by combined extraction and fixation using procedure 3. The cells were then double-stained for tubulin and tau using staining condition 1. Images were obtained from the resulting cells and subjected to the segmented mask procedure to quantify tubulin and tau staining along the length of the axon. We then computed the total staining intensity of tubulin and tau for the entire axon, and for a 100 μm segment located proximally, and a 100 μm segment located distally (10 or 11 axons were measured for each drug treatment condition). The proximal segment was situated between 50 and 150 μm from the cell body and contains the polymer that has the lowest average content of tau in the axon. The distal segment included the most distal 100 μm of the axon and contains polymer that has a much higher tau content than the polymer in the proximal segment, and includes the axonal polymer with the highest average content of tau. The staining intensity for tubulin and tau of drug-treated axons is expressed as a percentage of the intensity in control axons. These analyses show that the time course of polymer loss is the same in the proximal and distal axonal regions in spite of the severalfold difference in tau content of the polymer in these regions.

References

    1. Ahmad FJ, Pienkowski TP, Baas PW. Regional differences in microtubule dynamics in the axon. J Neurosci. 1993;13:856–866. - PMC - PubMed
    1. Baas PW, Ahmad FJ, Pienkowski TP, Brown A, Black MM. Sites of stabilization for axonal microtubules. J Neurosci. 1993;13:2177–2185. - PMC - PubMed
    1. Baas PW, Pienkowski TP, Cimbalnik KA, Toyama K, Bakalis S, Ahmad FJ, Kosik KS. Tau confers drug-stability but not cold-stability to microtubules in living cells. J Cell Sci. 1994;107:135–143. - PubMed
    1. Barlow S, Gonzalez-Garay ML, West RR, Olmsted JB, Cabral F. Stable expression of heterologous microtubule-associated proteins (MAPs) in chinese hamster ovary cells: evidence for differing roles of MAPs in microtubule organization. J Cell Biol. 1994;126:1017–1029. - PMC - PubMed
    1. Black MM. Comparison of MAP-2 and tau on the packing density of assembled microtubules. Proc Natl Acad Sci USA. 1987;84:7783–7787. - PMC - PubMed

Publication types

MeSH terms

LinkOut - more resources