

Metabotropic glutamate receptor activation in cerebellar Purkinje cells as substrate for adaptive timing of the classically conditioned eye-blink response
- PMID: 8642419
- PMCID: PMC6578825
- DOI: 10.1523/JNEUROSCI.16-11-03760.1996
Metabotropic glutamate receptor activation in cerebellar Purkinje cells as substrate for adaptive timing of the classically conditioned eye-blink response
Abstract
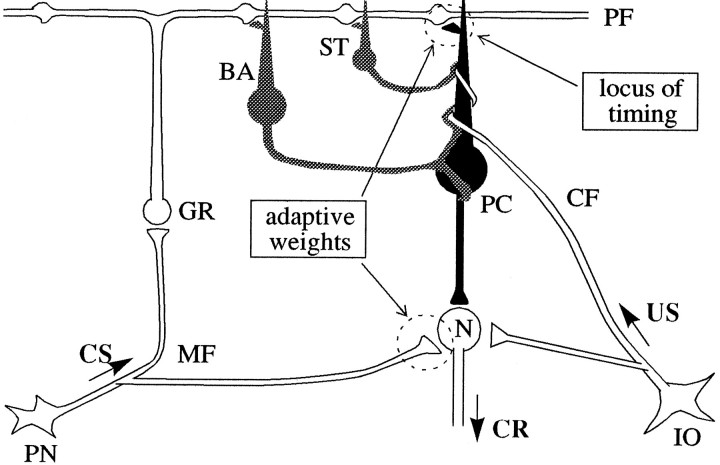
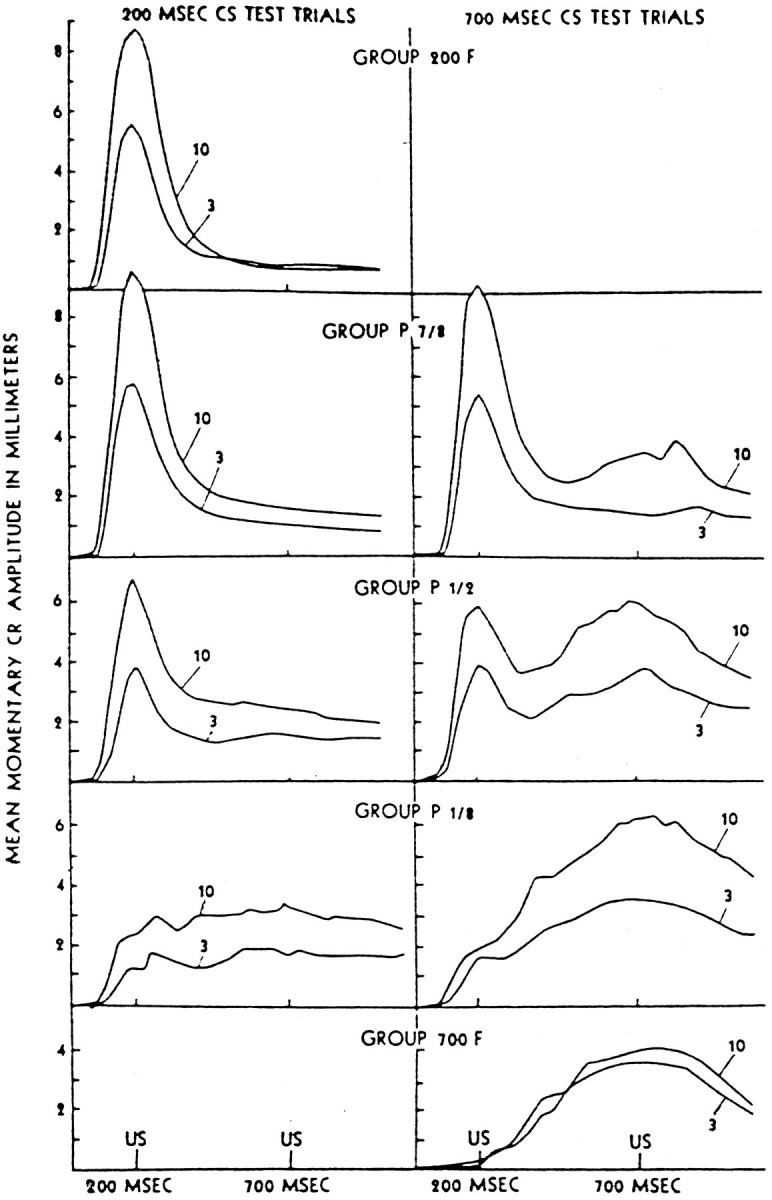
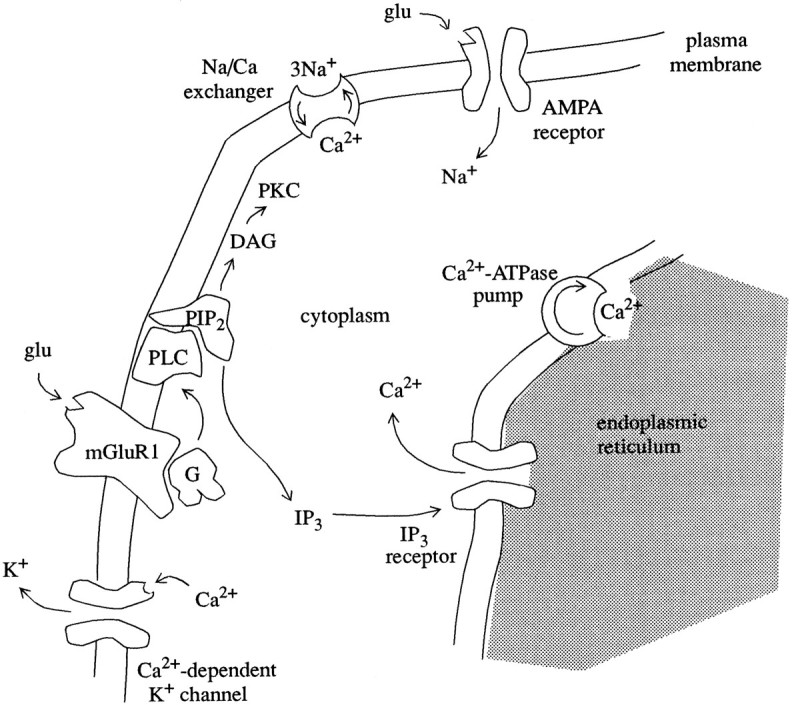
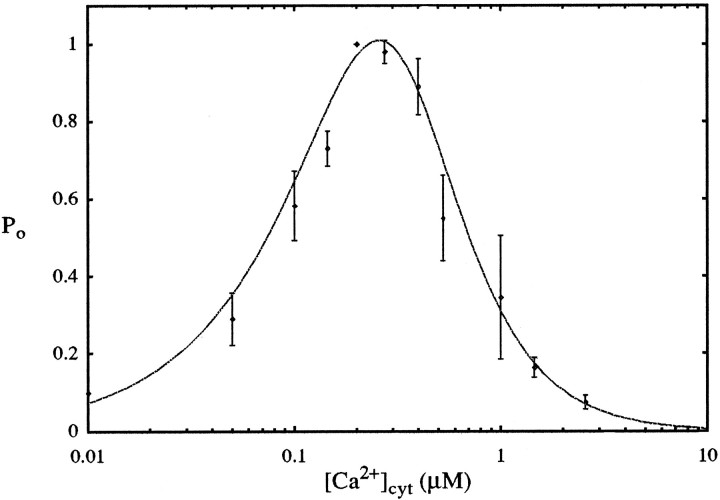
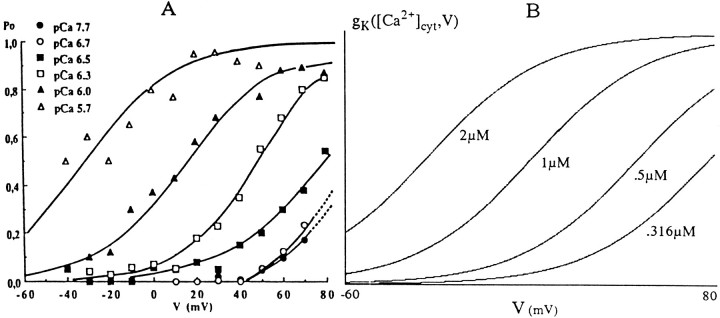
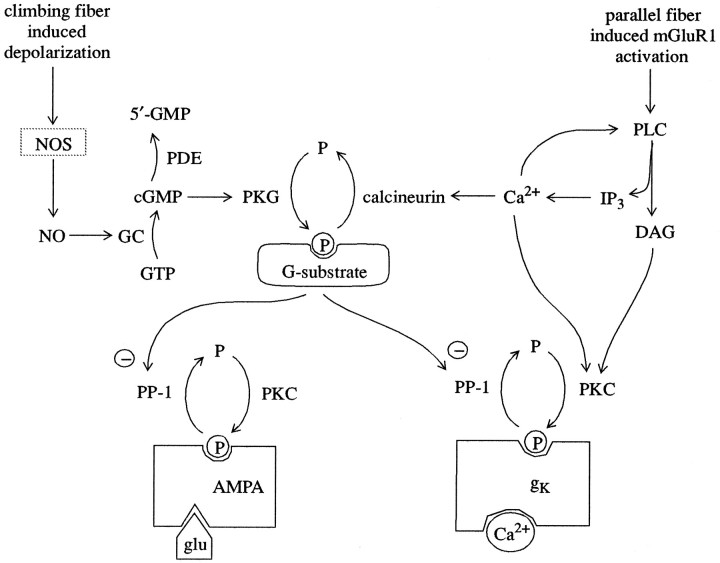
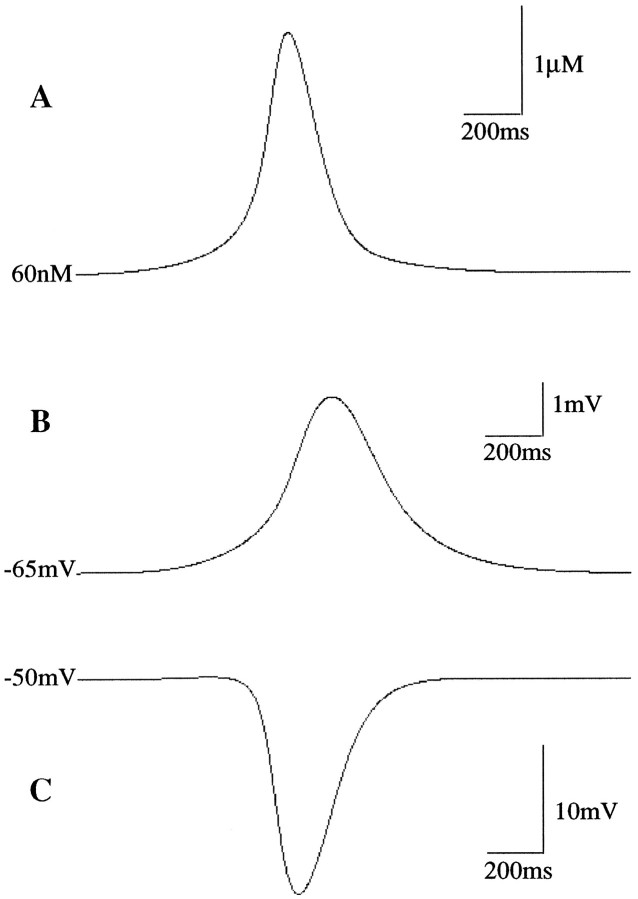
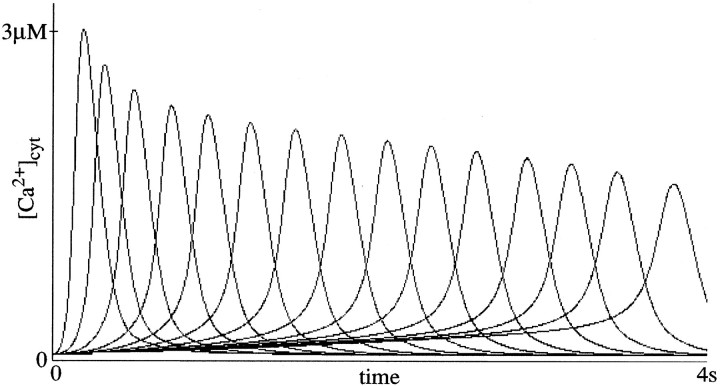
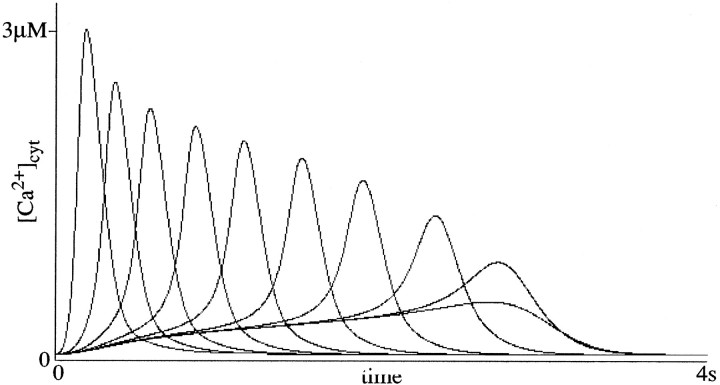
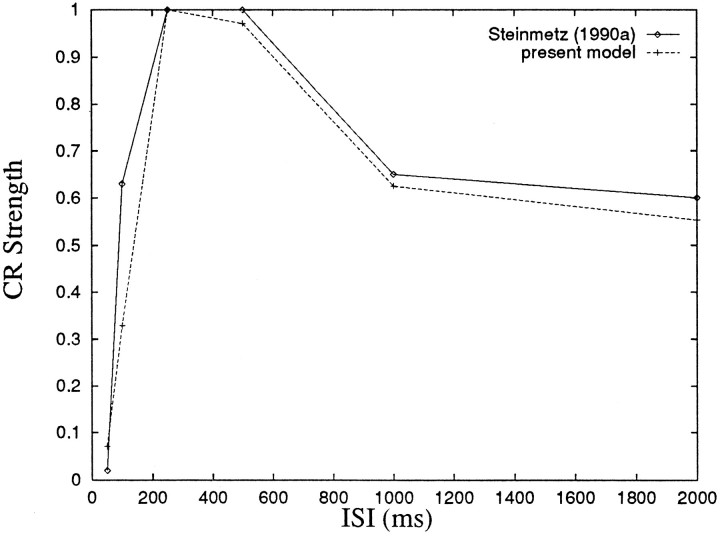
To understand how the cerebellum adaptively times the classically conditioned nictitating membrane response (NMR), a model of the metabotropic glutamate receptor (mGluR) second messenger system in cerebellar Purkinje cells is constructed. In the model, slow responses, generated postsynaptically by mGluR-mediated phosphoinositide hydrolysis and calcium release from intracellular stores, bridge the interstimulus interval (ISI) between the onset of parallel fiber activity associated with the conditioned stimulus (CS) and climbing fiber activity associated with unconditioned stimulus (US) onset. Temporal correlation of metabotropic responses and climbing fiber signals produces persistent phosphorylation of both AMPA receptors and Ca(2+)-dependent K+ channels. This is responsible for long-term depression (LTD) of AMPA receptors. The phosphorylation of Ca(2+)-dependent K+ channels leads to a reduction in baseline membrane potential and a reduction of Purkinje cell population firing during the CS-US interval. The Purkinje cell firing decrease disinhibits cerebellar nuclear cells, which then produce an excitatory response corresponding to the learned movement. Purkinje cell learning times the response, whereas nuclear cell learning can calibrate it. The model reproduces key features of the conditioned rabbit NMR: Purkinje cell population response is timed properly; delay conditioning occurs for ISIs of up to 4 sec, whereas trace conditioning occurs only at shorter ISIs; mixed training at two different ISIs produces a double-peaked response; and ISIs of 200-400 msec produce maximal responding. Biochemical similarities between timed cerebellar learning and photoreceptor transduction, and circuit similarities between the timed cerebellar circuit and a timed dentate-CA3 hippocampal circuit, are noted.
Figures
Similar articles
-
Purkinje cell activity in the cerebellar anterior lobe after rabbit eyeblink conditioning.Learn Mem. 2005 May-Jun;12(3):260-9. doi: 10.1101/lm.89505. Epub 2005 May 16. Learn Mem. 2005. PMID: 15897252 Free PMC article.
-
A biophysical model of synaptic delay learning and temporal pattern recognition in a cerebellar Purkinje cell.J Comput Neurosci. 2004 Sep-Oct;17(2):149-64. doi: 10.1023/B:JCNS.0000037678.26155.b5. J Comput Neurosci. 2004. PMID: 15306737
-
Learned response sequences in cerebellar Purkinje cells.Proc Natl Acad Sci U S A. 2017 Jun 6;114(23):6127-6132. doi: 10.1073/pnas.1621132114. Epub 2017 May 22. Proc Natl Acad Sci U S A. 2017. PMID: 28533379 Free PMC article.
-
Are Purkinje Cell Pauses Drivers of Classically Conditioned Blink Responses?Cerebellum. 2016 Aug;15(4):526-34. doi: 10.1007/s12311-015-0722-4. Cerebellum. 2016. PMID: 26400585 Free PMC article. Review.
-
Pharmacology of the metabotropic glutamate receptor mediated current at the climbing fiber to Purkinje cell synapse.Prog Brain Res. 2005;148:299-306. doi: 10.1016/S0079-6123(04)48023-6. Prog Brain Res. 2005. PMID: 15661198 Review.
Cited by
-
Stochastic reaction-diffusion modeling of calcium dynamics in 3D dendritic spines of Purkinje cells.Biophys J. 2021 Jun 1;120(11):2112-2123. doi: 10.1016/j.bpj.2021.03.027. Epub 2021 Apr 20. Biophys J. 2021. PMID: 33887224 Free PMC article.
-
Stimulus generalization of conditioned eyelid responses produced without cerebellar cortex: implications for plasticity in the cerebellar nuclei.Learn Mem. 2003 Sep-Oct;10(5):346-54. doi: 10.1101/lm.67103. Learn Mem. 2003. PMID: 14557607 Free PMC article.
-
A local circuit model of learned striatal and dopamine cell responses under probabilistic schedules of reward.J Neurosci. 2008 Oct 1;28(40):10062-74. doi: 10.1523/JNEUROSCI.0259-08.2008. J Neurosci. 2008. PMID: 18829964 Free PMC article.
-
Timing and causality in the generation of learned eyelid responses.Front Integr Neurosci. 2011 Aug 30;5:39. doi: 10.3389/fnint.2011.00039. eCollection 2011. Front Integr Neurosci. 2011. PMID: 21941469 Free PMC article.
-
The Neural Basis of Timing: Distributed Mechanisms for Diverse Functions.Neuron. 2018 May 16;98(4):687-705. doi: 10.1016/j.neuron.2018.03.045. Neuron. 2018. PMID: 29772201 Free PMC article. Review.
References
-
- Abe T, Sugihara H, Nawa H, Shigemoto R, Mizuno N, Nakanishi S. Molecular characterization of a novel metabotropic glutamate receptor mGLUR5 coupled to inositol phosphate/Ca2+ signal transduction. J Biol Chem. 1992;267:13361–13368. - PubMed
-
- Aiba A, Kano M, Chen C, Stanton ME, Fox GD, Herrup K, Zwingman TA, Tonegawa S. Deficient cerebellar long-term depression and impaired motor learning in mGluR1 mutant mice. Cell. 1994;79:377–388. - PubMed
-
- Ajima A, Ito M. A unique role of protein phosphatases in cerebellar long-term depression. NeuroReport. 1995;6:297–300. - PubMed
-
- Alkon DL. Calcium-mediated reduction of ionic currents: a biophysical memory trace. Science. 1984;226:1037–1045. - PubMed
-
- Alkon DL. Changes of membrane currents and calcium-dependent phosphorylation during associative conditioning. In: Alkon DL, Woody CD, editors. Neural mechanisms of conditioning. Plenum; New York: 1986. pp. 3–18.
Publication types
MeSH terms
Substances
LinkOut - more resources
Full Text Sources
Miscellaneous