. 1996 Jun 15;16(12):3862-76.
doi: 10.1523/JNEUROSCI.16-12-03862.1996.

Layer-specific properties of the transient K current (IA) in piriform cortex

Affiliations

Layer-specific properties of the transient K current (IA) in piriform cortex

M I Banks et al. J Neurosci. .

Abstract

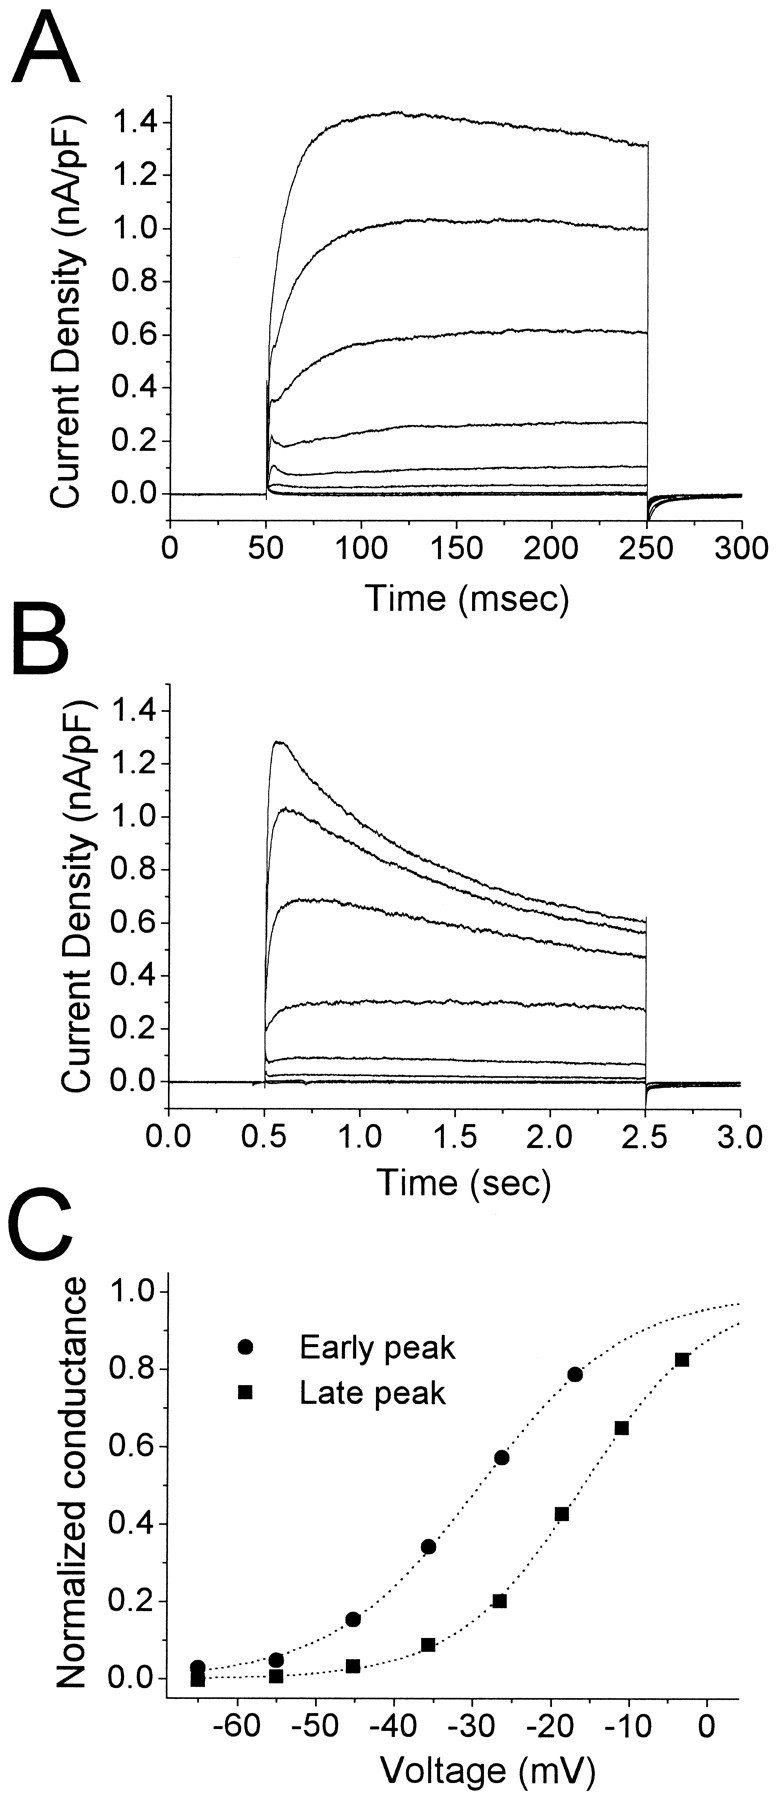
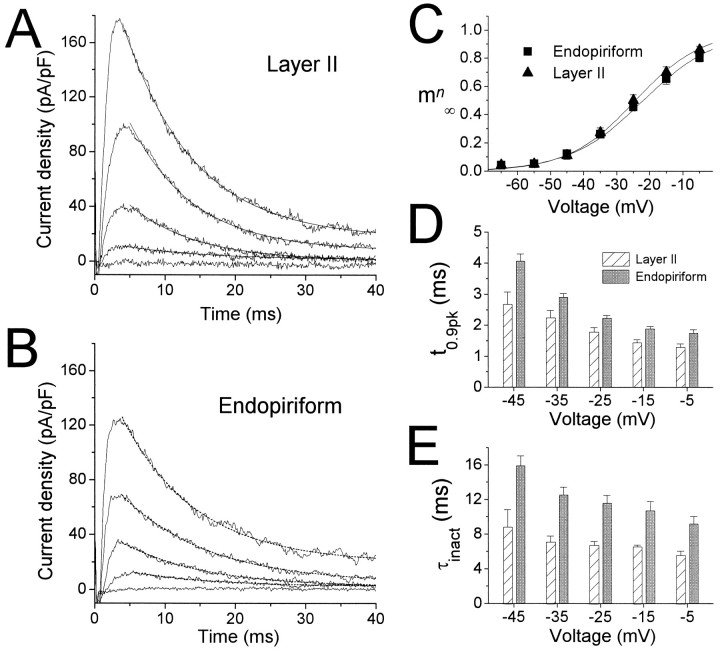
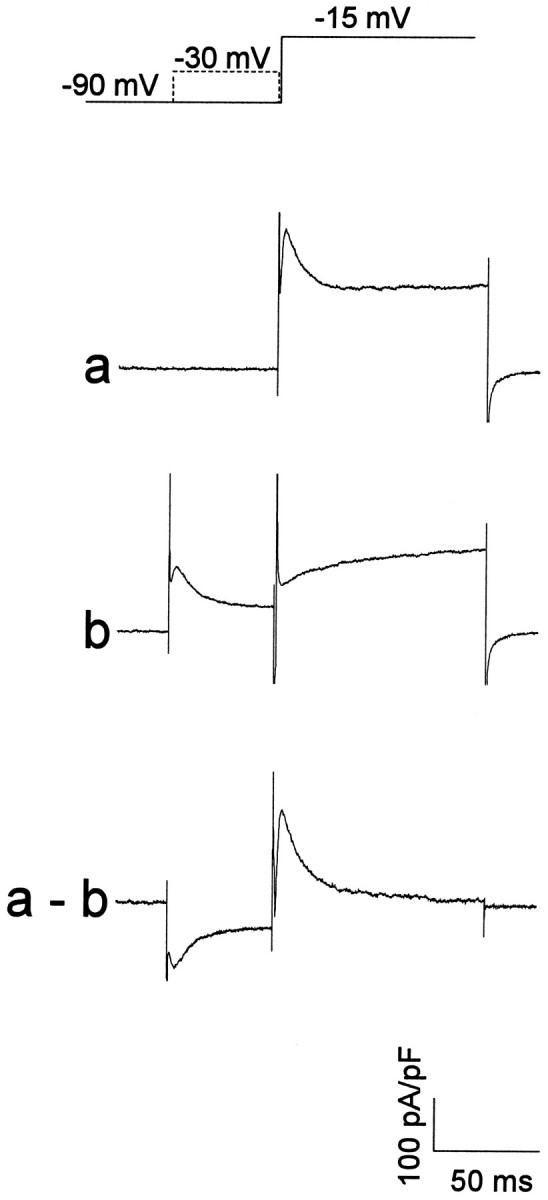
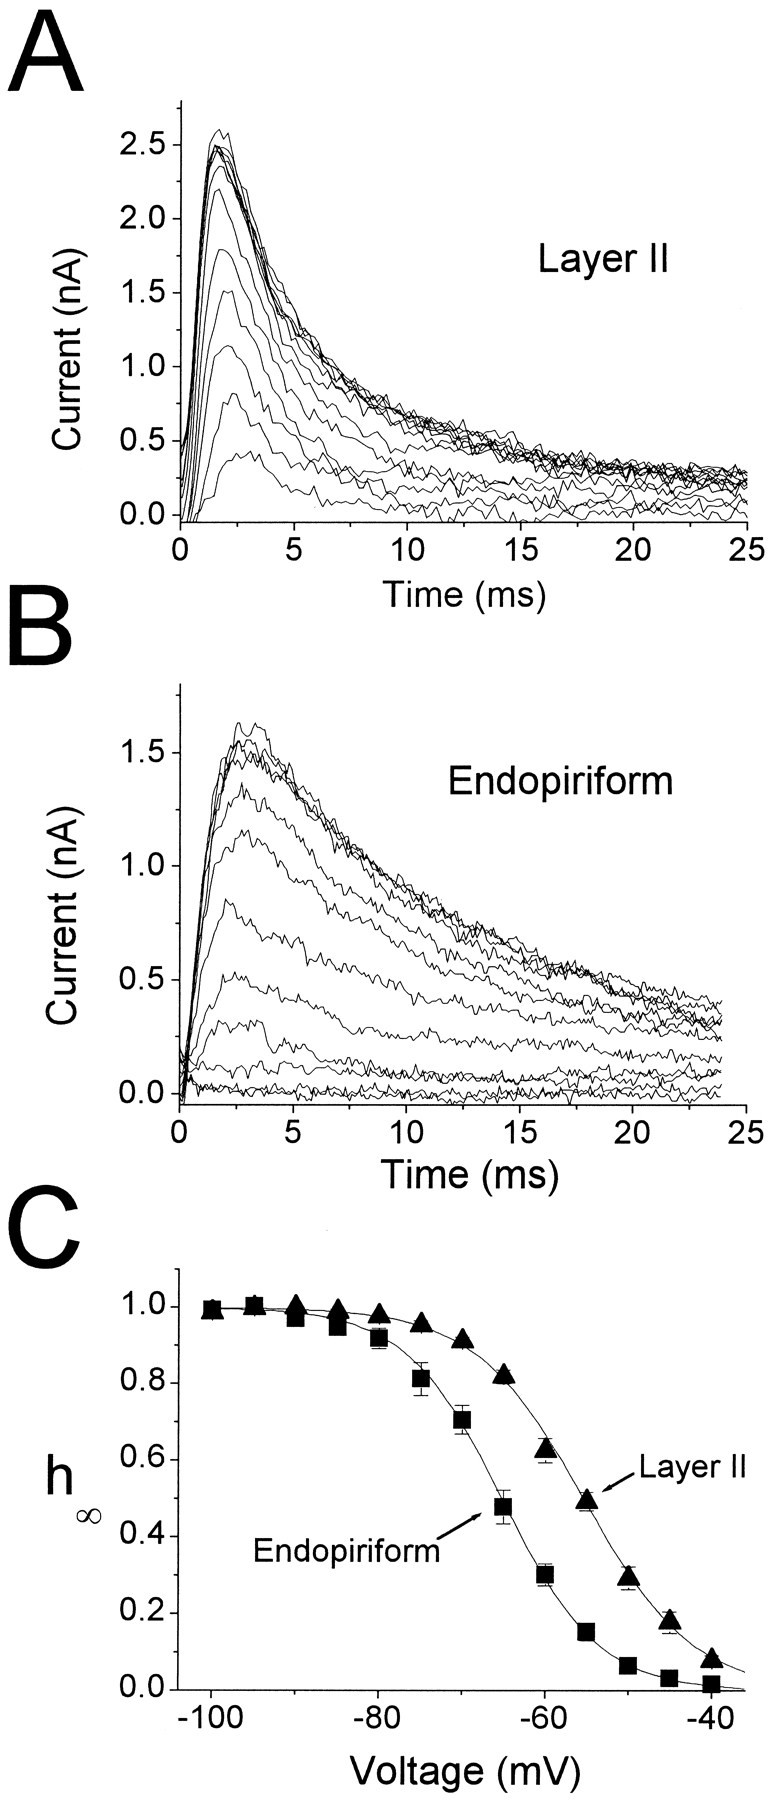
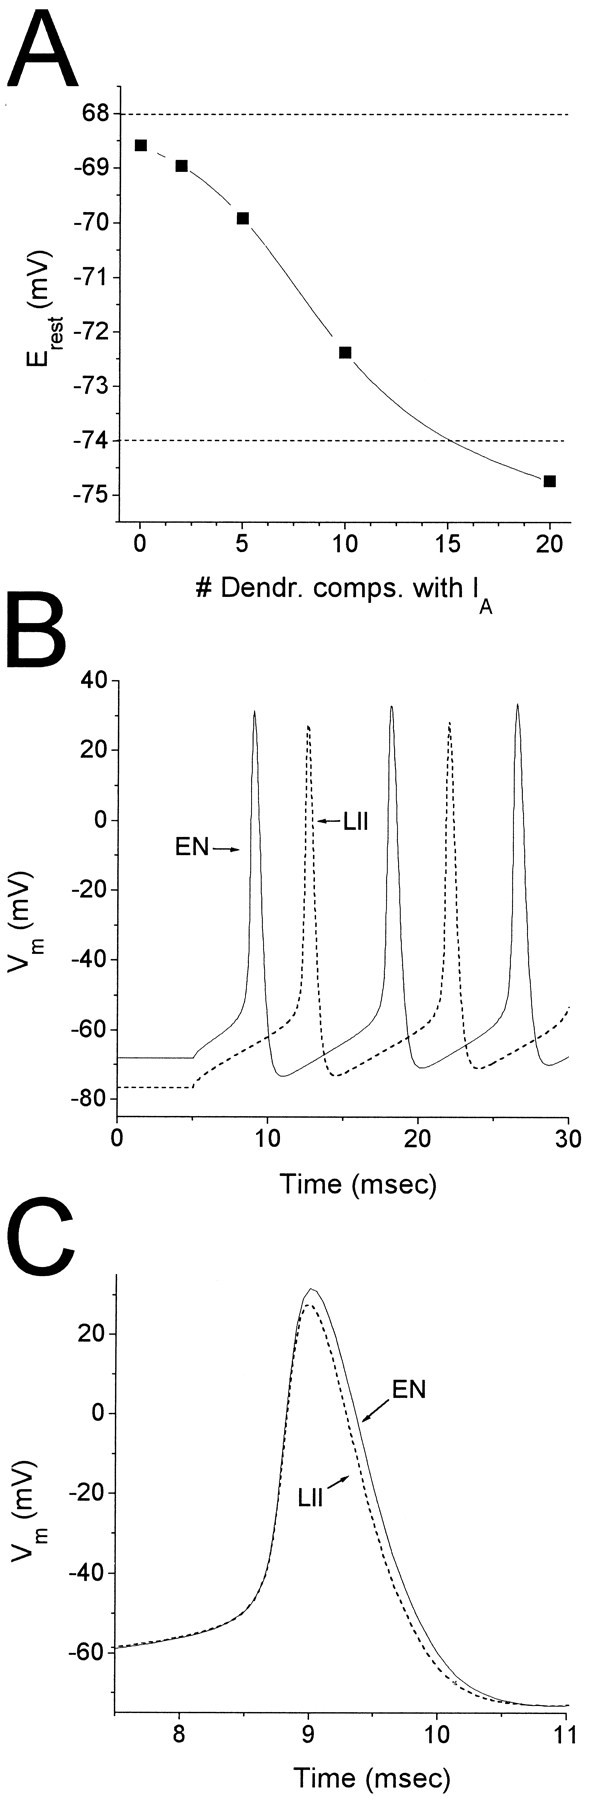
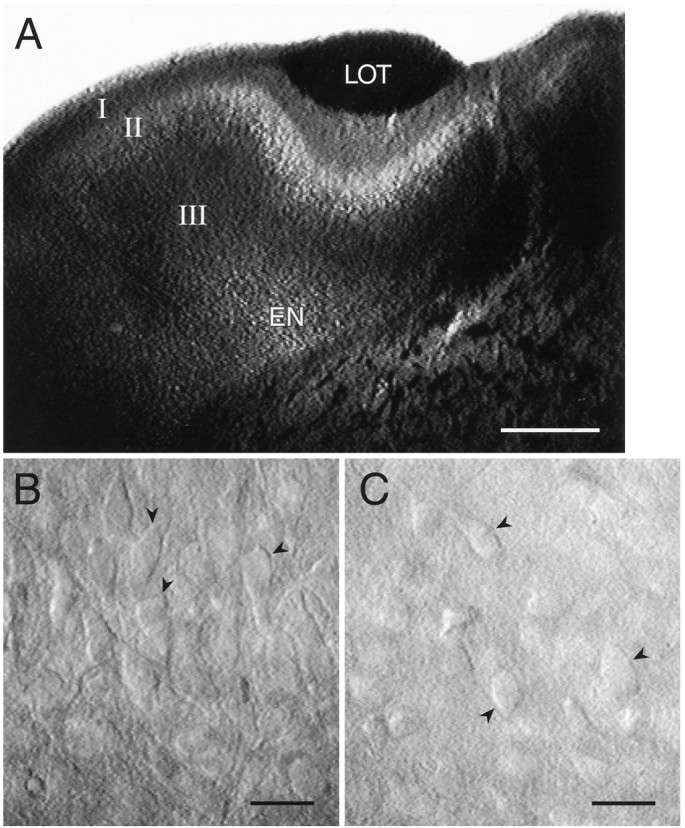
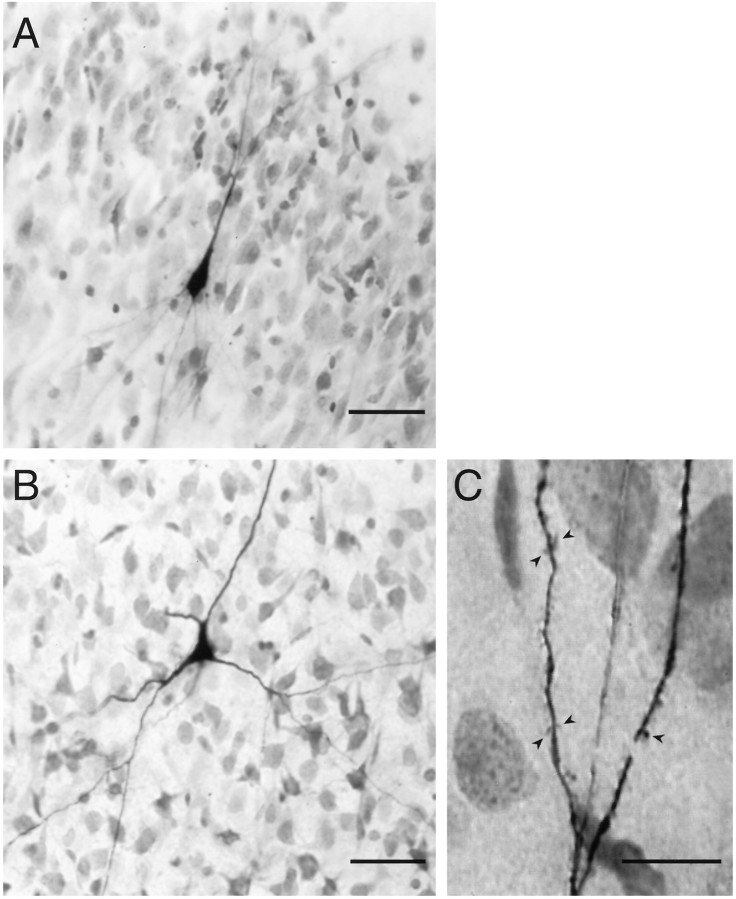
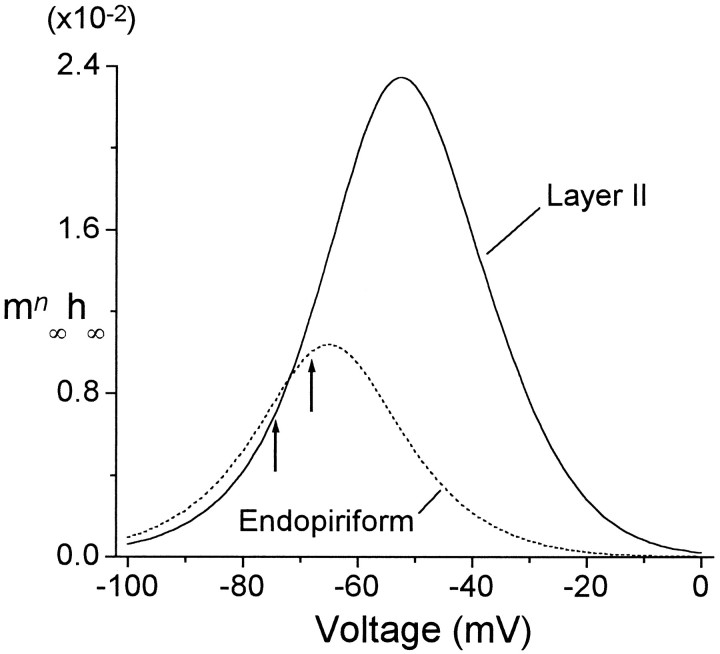
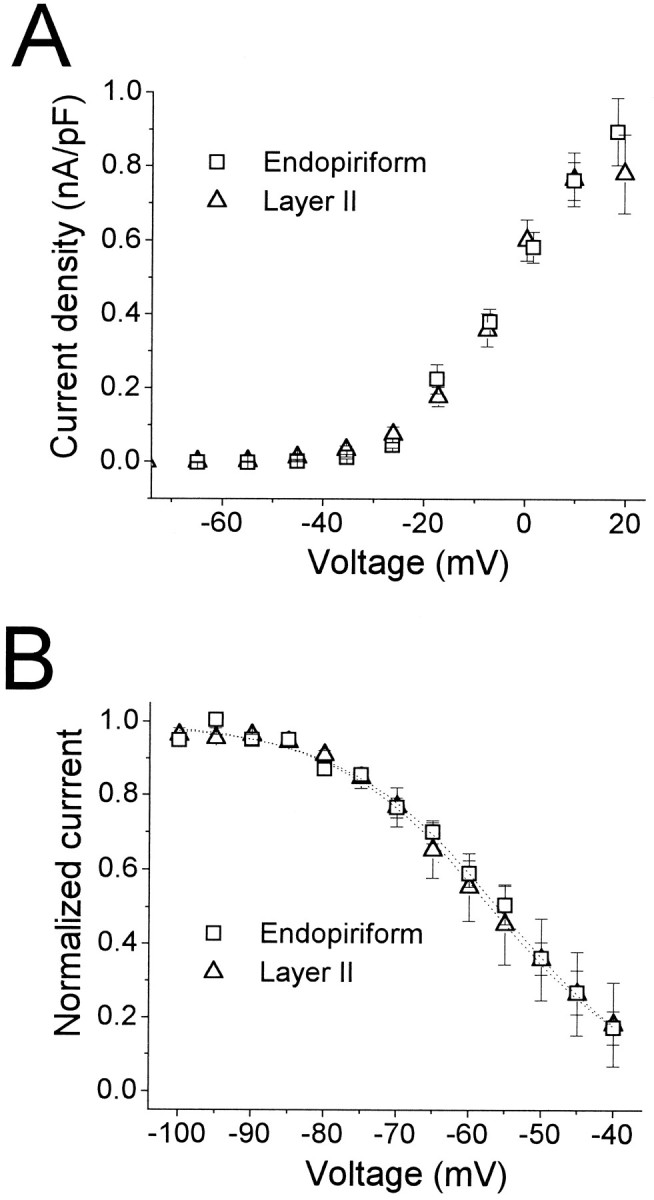
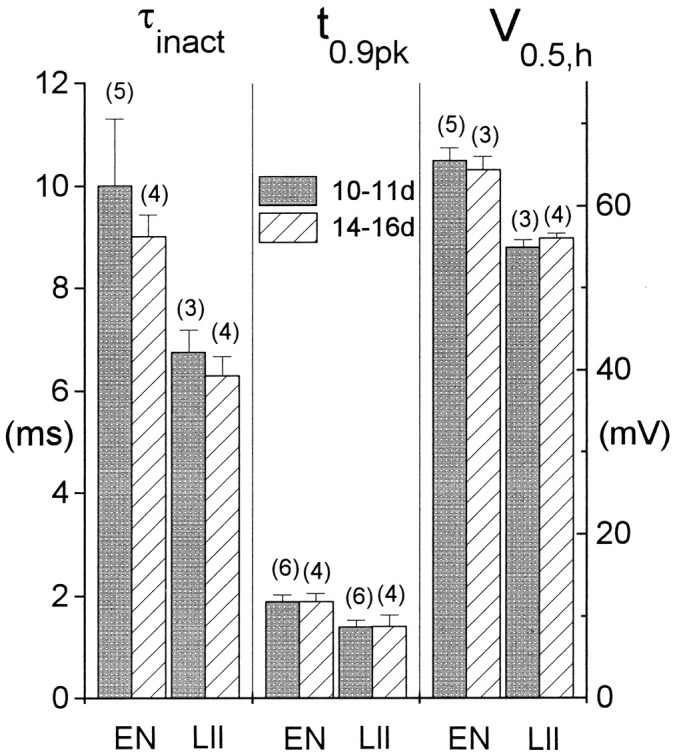
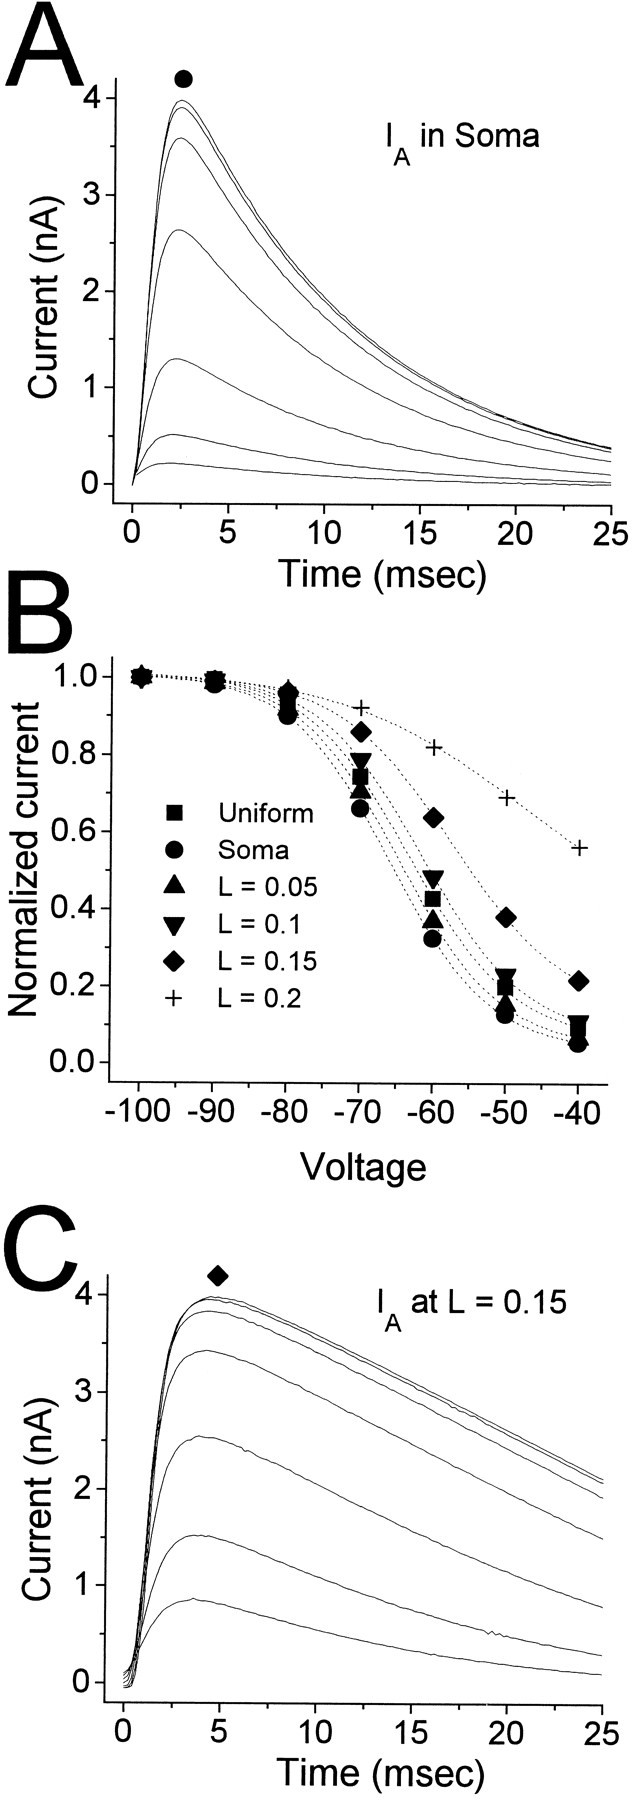
Piriform cortex in the rat is highly susceptible to induction of epileptiform activity. Experiments in vivo and in vitro indicate that this activity originates in endopiriform nucleus (EN). In slices, EN neurons are more excitable than layer II (LII) pyramidal cells, with more positive resting potentials and lower spike thresholds. We investigated potassium currents in EN and LII to evaluate their contribution to these differences in excitability. Whole-cell currents were recorded from identified cells in brain slices. A rapidly inactivating outward current (IA) had distinct properties in LII (IA,LII) versus EN (IA,EN). The peak amplitude of IA,EN was 45% smaller than IA,LII, and the kinetics of activation and inactivation was significantly slower for IA,EN. The midpoint of steady-state inactivation was hyperpolarized by 10 mV for IA,EN versus IA,LII, whereas activation was similar in the two cell groups. Other voltage-dependent potassium currents were indistinguishable between EN and LII. Simulations using a compartmental model of LII cells argue that different cellular distributions of IA channels in EN versus LII cells cannot account for these differences. Thus, at least some of the differences are intrinsic to the channels themselves. Current-clamp simulations suggest that the differences between IA,LII and IA,EN can account for the observed difference in resting potentials between the two cell groups. Simulations show that this difference in resting potential leads to longer first spike latencies in response to depolarizing stimuli. Thus, these differences in the properties of IA could make EN more susceptible to induction and expression of epileptiform activity.


Figures

Fig. 4.
Fig. 4.
A, B, Outward currents recorded from a cell in endopiriform nucleus. Depolarizing voltage steps to −65, −55,  … , +5 mV were applied for 200 msec (A) or 2 sec (B) from a holding potential of −90 mV. Biexponential fit to the 2 sec response to +5 mV (B,top trace) gave time constants of 376 msec (16.4% of total current) and 1530 msec (54.0% of total current). C, Activation functions estimated from the data in A andB. Early and late peak values were divided by the driving force (assuming EK = −98 mV) and normalized using the technique described in Materials and Methods. The early peak was distinguishable only for the responses to voltage steps up to −15 mV. Voltages were corrected for series resistance errors. Boltzmann fit parameters: V0.5 = −29.2 mV,k = 9.35 mV (early peak); V0.5 = −16.0 mV, k = 8.08 mV (late peak).
Fig. 5.
Fig. 5.
Activation and kinetics ofIA. A,IA currents recorded in an LII pyramidal cell in response to depolarizing voltage steps from −90 mV to −55, … , −15 mV. Currents were isolated using the protocol illustrated in Figure 1. Monoexponential fits are superimposed on the data. Time constants: −45 mV, 9.79 msec; −35 mV, 9.03 msec; −25 mV, 8.71 msec; −15 mV, 8.07 msec. B, IsolatedIA obtained by the same protocol from a cell in EN. Exponential fits are superimposed on the data (dotted lines). Time constants: −45 mV, 11.4 msec; −35 mV, 11.5 msec; −25 mV, 12.2 msec; −15 mV, 10.5 msec. C, Pooled activation data for 11 cells in LII (triangles) and 14 cells in EN (squares). Data were obtained by normalizing the peak currents in response to the activation protocol used in Aand B, and dividing by the driving force (assumingEK = −98 mV). Boltzmann functions were fitted to the data for each cell, then averaged to give the plotted functions (solid lines). Boltzmann fit parameters are given in Table 2. D, E, Voltage dependence ofIA activation (D) and inactivation (E) kinetics for LII (striped bars) and EN (gray bars). Activation kinetics was measured by computing the time to reach 90% of peak (t0.9pk). Inactivation kinetics was measured by fitting single exponentials to decaying currents, as inA and B. For D, n = 18 for EN and 13 for LII. For E, n = 17 for EN and 11 for LII. Statistical comparisons were made between LII and EN at each voltage point using the Student’s t test. Significance level was p ≤ 0.01 for all voltages.
Fig. 1.
Fig. 1.
Subtraction protocol used to isolateIA. Shown is the procedure used to study activation of IA. The cell was held at −90 mV and stepped to depolarized voltages (trace a; response at −15 mV). The protocol then was repeated, but with a 50 msec prepulse to −30 mV preceding the depolarizing voltage steps (trace b). The difference current yielded IA(traces a, b). Data from this cell are shown in Figure 5A.
Fig. 6.
Fig. 6.
Steady-state inactivation ofIA. A,IA in a LII cell in response to the inactivation protocol. Conditioning voltage steps varying from −100 mV to −40 mV were applied for 500 msec, followed by test steps to 0 mV.IA was isolated using a procedure similar to that illustrated in Figure 1, with the prepulse interposed between the conditioning and test pulses. B,IA recorded from a cell in EN using the same protocol as in A. C, Steady-state inactivation functions for 10 cells in LII (triangles) and 10 cells in EN (squares). Data were obtained by normalizing the peak currents in response to the inactivation protocol used in Aand B. Boltzmann functions were fitted to the data for each cell, and then averaged to give the plotted functions (solid lines). Boltzmann fit parameters are given in Table 2.
Fig. 11.
Fig. 11.
Effect of IA on cell excitability. IA first was placed in the soma, then was added to the first two dendritic compartments, then the first five dendritic compartments, and so on, until it was distributed uniformly throughout the cell. In each case,gmax, V0.5,m,V0.5,h, α0,m, and α0,h were adjusted to give currents measured at the soma under voltage clamp comparable to the experimental data (Table 2). For all distributions, the current decays were reasonably well fit by single exponentials. A, Effect onErest. The resting potential of the model was measured after setting the leak withIA,EN to giveErest = −68 mV, then switching toIA,LII with the same leak.Erest became increasingly hyperpolarized asIA was added to more and more dendritic compartments. The horizontal dotted lines at −68 and −74 mV mark Erest as measured in EN and LII, respectively. B. Effect on first spike latency and interspike interval of switching from IA,EN (solid line) to IA,LII (dashed line) in a model with currents distributed uniformly along the dendritic tree. The model was stimulated with a 25 msec current pulse (0.3 nA) to elicit action potentials. First spike latency increased from 3.83 (EN) to 7.48 (LII) msec, whereas interspike interval increased from 9.1 (EN) to 9.35 (LII) msec. C, Effect on spike width. The traces from B were shifted by ∼3.6 msec to align the first action potentials. Spike width at −10 mV decreased from 0.66 (EN) to 0.57 (LII) msec. Spike amplitude was slightly smaller (4 mV) with IA,LII.
Fig. 2.
Fig. 2.
A, Low-power view of a typical piriform cortex slice used in these experiments. LI, LII,LIII, and EN are indicated. LOT, Lateral olfactory tract. B, Pyramidal cells in LII in a live piriform cortex slice. Healthy cells (arrowheads) had a three-dimensional appearance, with smooth, flat surfaces and no noticeable vacuoles. C, Multipolar cells in EN in a live piriform cortex slice. Arrowheads indicate healthy cells. Scale bars: A, 500 μm; B, C, 20 μm.
Fig. 3.
Fig. 3.
A, Biocytin-filled pyramidal cell in LII of piriform cortex. Distal basal and apical dendrites were out of the plane of focus. The border between LI and LII is visible at thetop right of the picture. B, Biocytin-filled multipolar cell in endopiriform nucleus. Dendrites can be seen extending both within and orthogonal to the plane of section.C, Higher-power view of a distal dendrite from the cell inB, showing dendritic spines (arrowheads). Scale bars: A, B, 50 μm; C, 20 μm.
Fig. 7.
Fig. 7.
mn(V) · h(V) in LII and EN. The product of the best-fitting activation and inactivation functions from Figures 5C and 6C are shown for LII (solid line) and EN (dashed line) to give the steady-state fraction of active IA channels. Resting potentials are indicated (arrows) on the respective curves for LII (−74 mV) and EN (−68 mV). Resting potential values are fromTseng and Haberly (1989b).
Fig. 8.
Fig. 8.
Development of IA in LII and EN. Shown are τinact (left four bars), t0.9pk (middle four bars), and V0.5,h (right four bars) for recordings from animals 10–11 d old (gray bars) and 14–16 d old (striped bars). Numbers of cells are given in parentheses. None of the parameters varied significantly with age (p ≥ 0.1). τinact and t0.9pkwere measured at −15 mV.
Fig. 9.
Fig. 9.
Properties of high-threshold K currents in LII and EN. A, Current–voltage relationships derived from responses at the end of 200 msec depolarizing voltage steps from −90 mV for cells in EN (squares; n = 31) and LII (triangles; n = 16). Current was averaged over the final 5 msec of the response. Voltages were corrected for series resistance errors and the data binned at approximately equal voltage increments. Voltage within each bin was averaged. In all cases, the horizontal SE bars were smaller than the symbol size. B, Steady-state inactivation data for the slowly inactivating K current recorded from cells in EN (n = 9) and LII (n = 5). The inactivation protocol used was similar to that illustrated in Figure 1, trace b, but the conditioning pulse duration was 10 sec, and the test pulse duration was 200 msec. Boltzmann fit parameters are LII: V0.5 = −57.0 ± 6.8 mV, k = 11.0 ± 2.8 mV; EN: V0.5 = −55.2 ± 3.9 mV, k = 11.2 ± 2.1 mV.
Fig. 10.
Fig. 10.
Simulated IAfrom a compartmental model of an LII cell (see Materials and Methods, Table 1). Simulations mimicked the inactivation protocol used in Figure6. A, Response of the model withIA confined to the somatic compartment (L = 0). B, Steady-state inactivation functions derived from the data in A (circles) and C(diamonds), as well as four otherIA distributions. Boltzmann fit parameters (in mV; V0.5,h, kh) are as follows: Uniform: −63.3, 7.15; Soma(L = 0): −65.8, 6.88; L = 0.05: −64.6, 6.93; L = 0.1: −61.5, 7.14; L = 0.15: −57.3, 7.87; L = 0.2: −47.0, 12.9. C, Same asA, but with IA confined to the third dendritic compartment (L = 0.15). Note that decays no longer appear exponential.

References

    1. Adams JC. Heavy metal intensification of DAB-based HRP reaction product. J Histochem Cytochem. 1981;29:775. - PubMed
    1. Aguayo LG. Postnatal development of K+ currents studied in isolated rat pineal cells. J Physiol (Lond) 1989;414:283–300. - PMC - PubMed
    1. Augustine CK, Bezanilla F. Phosphorylation modulates potassium conductance and gating current of perfused giant axons of squid. J Gen Physiol. 1990;95:245–271. - PMC - PubMed
    1. Bader CR, Bertrand D, Dupin E. Voltage-dependent potassium currents in developing neurones from quail mesencephalic neural crest. J Physiol (Lond) 1985;366:129–151. - PMC - PubMed
    1. Baldwin TJ, Tsaur ML, Lopez GA, Jan YN, Jan LY. Characterization of a mammalian cDNA for an inactivating voltage-sensitive K+ channel. Neuron. 1991;7:471–483. - PubMed

Publication types