. 1996 Jun 15;16(12):3877-86.
doi: 10.1523/JNEUROSCI.16-12-03877.1996.

Homeostasis of synaptic transmission in Drosophila with genetically altered nerve terminal morphology

Affiliations

Homeostasis of synaptic transmission in Drosophila with genetically altered nerve terminal morphology

B A Stewart et al. J Neurosci. .

Abstract

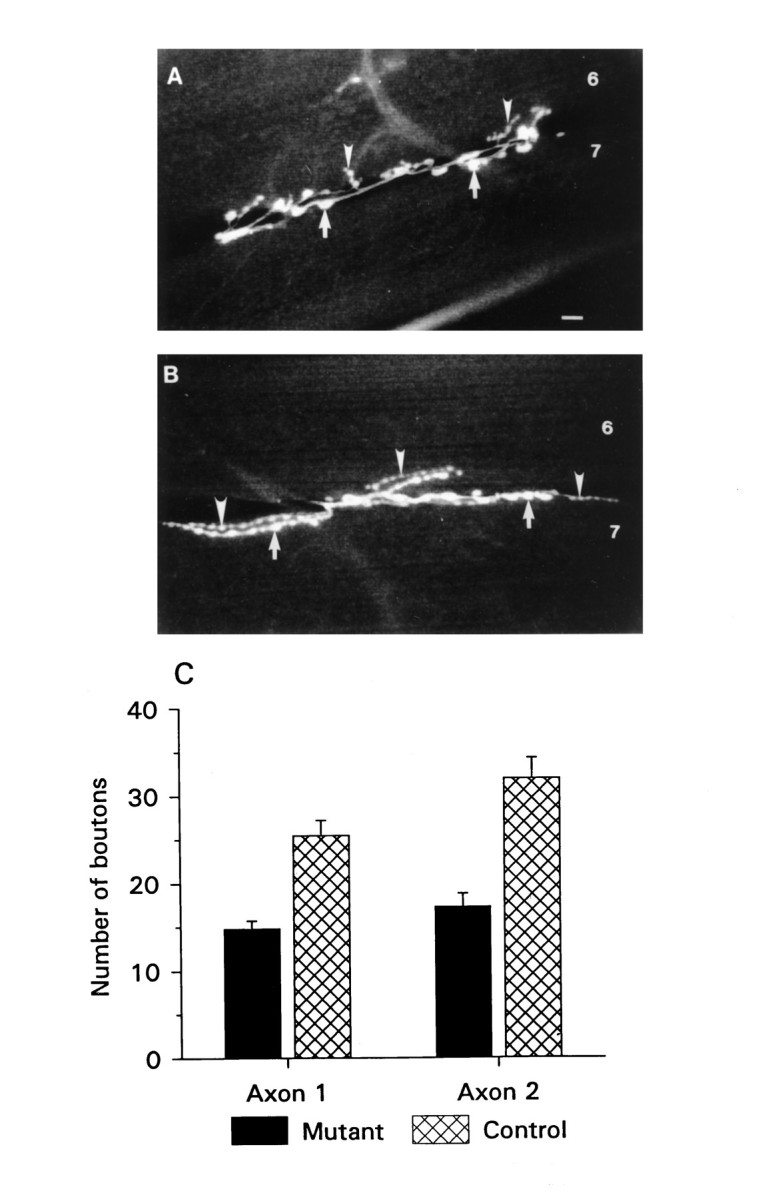
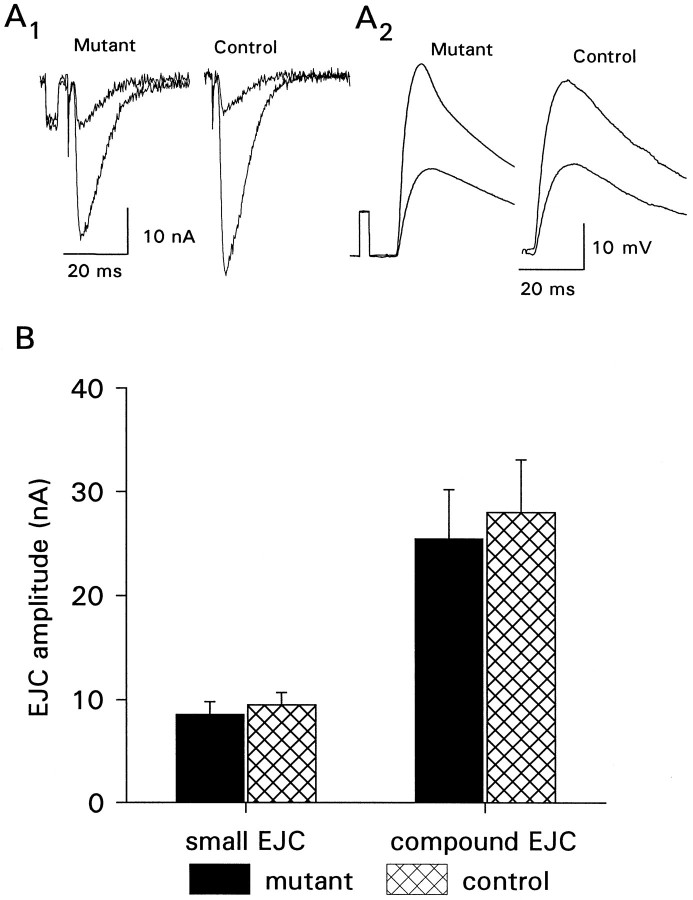
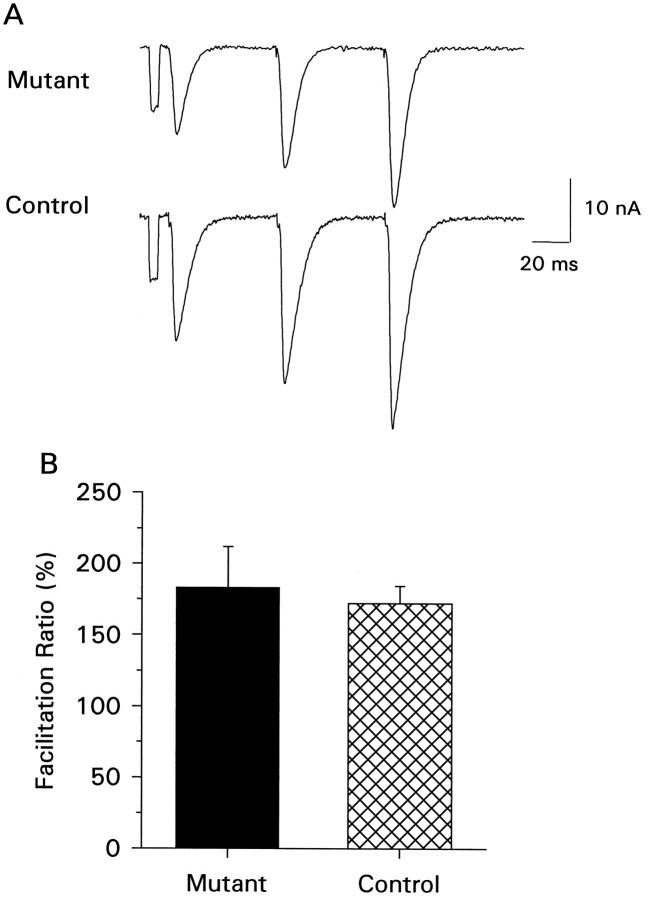
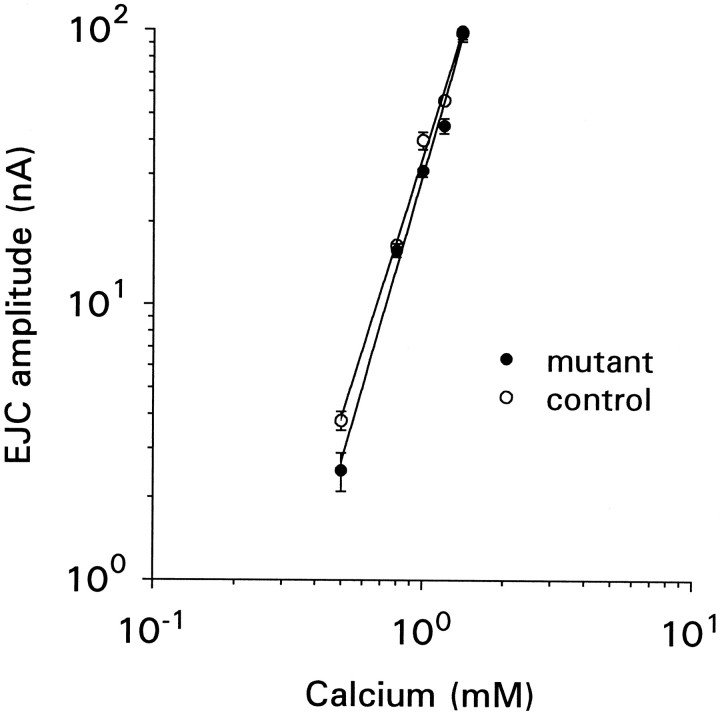
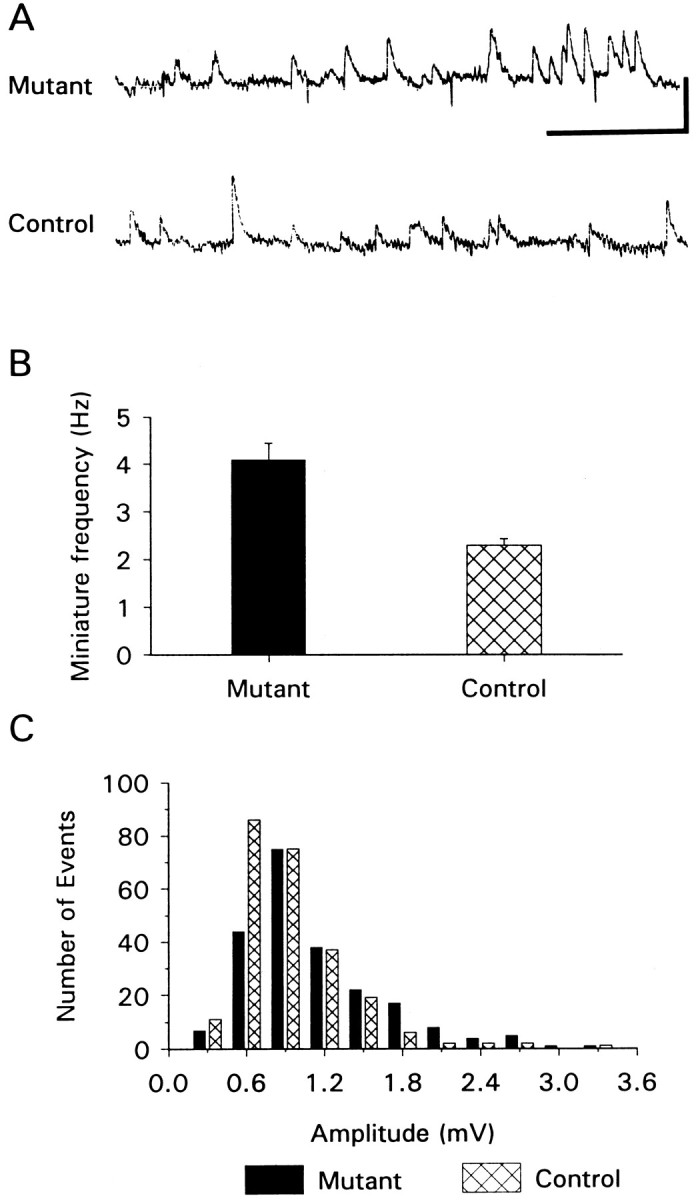
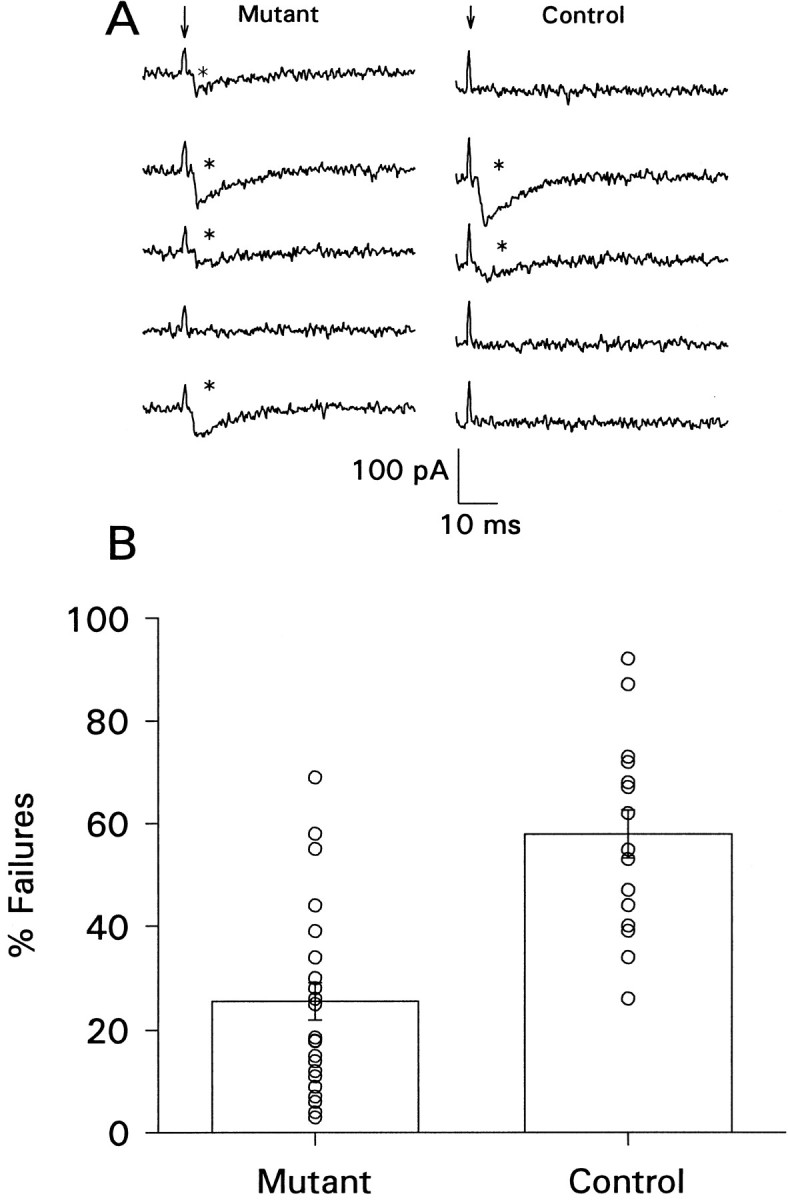
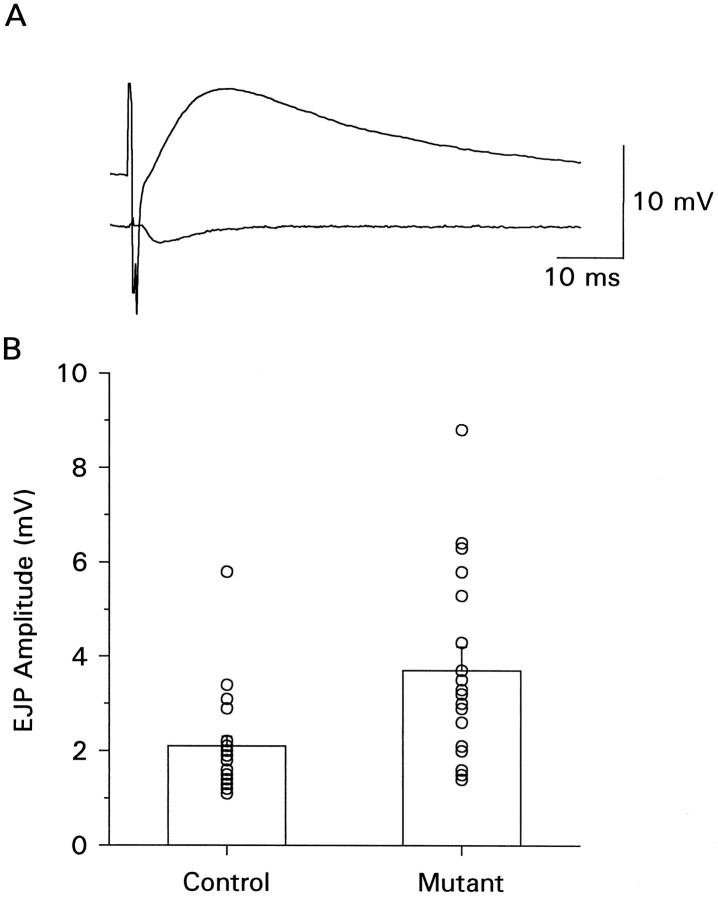
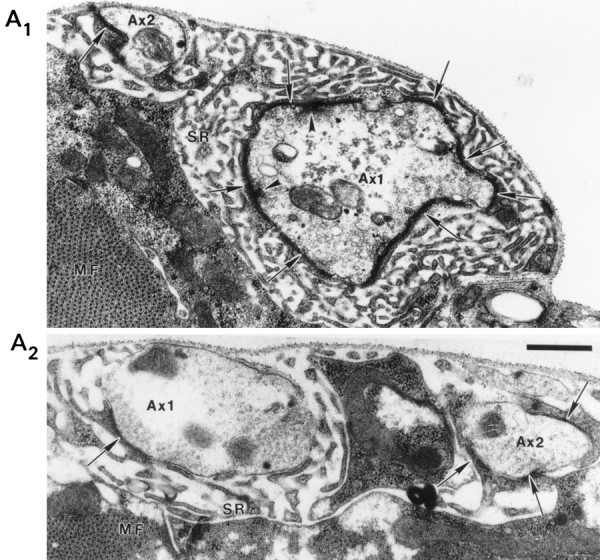
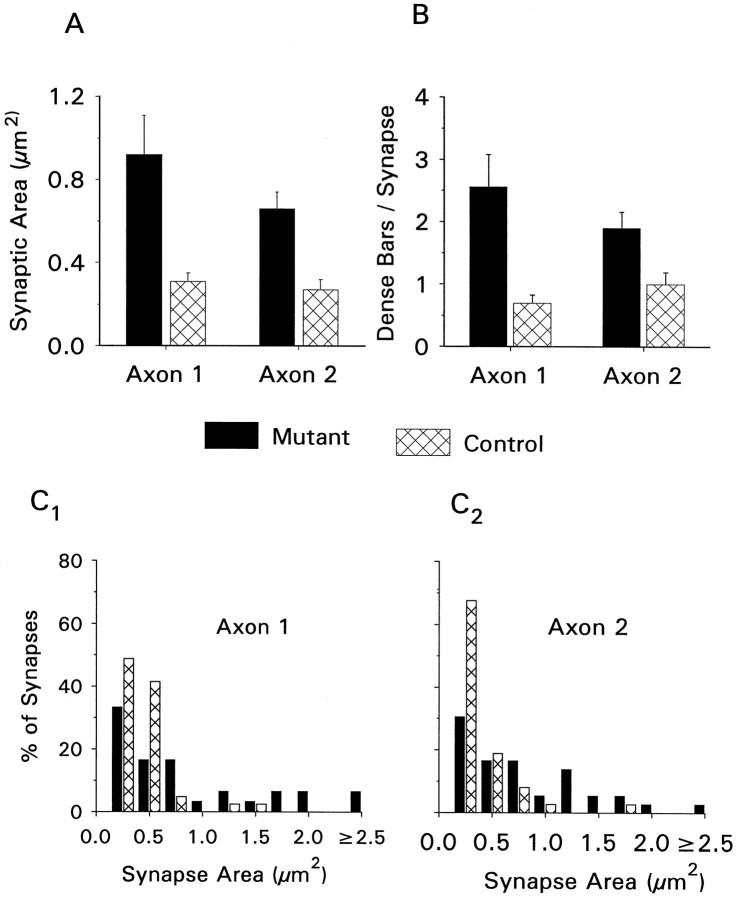
We present a new test of the hypothesis that synaptic strength is directly related to nerve terminal morphology through analysis of synaptic transmission at Drosophila neuromuscular junctions with a genetically reduced number of nerve terminal varicosities. Synaptic transmission would decrease in target cells with fewer varicosities if there is a relationship between the number of varicosities and the strength of synaptic transmission. Animals that have an extreme hypomorphic allele of the gene for the cell adhesion molecule Fasciclin II possess fewer synapse-bearing nerve terminal varicosities; nevertheless, synaptic strength is maintained at a normal level for the muscle cell as a whole. Fewer failures of neurotransmitter release and larger excitatory junction potentials from individual varicosities, as well as more frequent spontaneous release and larger quantal units, provide evidence for enhancement of transmitter release from varicosities in the mutant. Ultrastructural analysis reveals that mutant nerve terminals have bigger synapses with more active zones per synapse, indicating that synaptic enlargement and an accompanying increase in synaptic complexity provide for more transmitter release at mutant varicosities. These results show that morphological parameters of transmitting nerve terminals can be adjusted to functionally compensate for genetic perturbations, thereby maintaining optimal synaptic transmission.


Figures

Fig. 1.
Fig. 1.
Aberrant neuromuscular morphology in Fas II mutants. A, B, Fluorescence micrographs of NMJs of ventral longitudinal muscles 6 and 7 in mutant (A) and control (B) animals. Arrows point to varicosities of axon 1, and arrowheads point to varicosities of axon 2. Scale bar (shown in A), 10 μm. C, Summary of varicosity counts obtained from 18 mutant and 13 control NMJs from abdominal segment 4. The error bars represent the SEM in this and subsequent figures. Mutant and control animals are from the e76 and e93 P-element excision lines described in Grenningloh et al. (1991).
Fig. 2.
Fig. 2.
Synaptic transmission at the whole muscle level is not affected by aberrant NMJ morphology. A, Examples of single traces showing EJCs (A1) and EJPs (A2). Two thresholds of excitation are shown.B, Summary of EJC amplitudes in mutants and controls measured in 1.0 mm calcium from muscle 6 of abdominal segments 4 and 5 from mutant and control animals (n = 15 mutant cells and 9 control cells). There is no significant difference between controls and mutants.
Fig. 3.
Fig. 3.
Short-term facilitation. A, Example of frequency-dependent short-term facilitation of the maximal evoked response for mutant and control animals. The traces show synaptic facilitation observed with a 3 pulse train of 20 Hz stimulation recorded in 0.75 mm calcium and represents the average of five individual traces. B, Summary of facilitation ratios (third pulse amplitude/first pulse amplitude × 100) observed from six mutant and nine control cells. There is no significant difference.
Fig. 4.
Fig. 4.
Calcium dependency of transmitter release. Maximal EJC amplitude is plotted as a function of external calcium concentration on log–log scales. Each point is the average of data collected from 10 to 14 muscle fibers.
Fig. 5.
Fig. 5.
Frequency of spontaneous neurotransmitter release is higher, and amplitude of quantal events is larger, in mutant animals. A, Traces of membrane potential showing spontaneous transmitter release (miniature potentials) in mutants and controls. Calibration bar: 2 mV, 1 sec. The downward deflections in the mutant trace are 1 mV calibration pulses; ∼4 sec of data are shown.B, Summary of frequency of spontaneous miniature potentials from 10 mutant and 8 control cells. C, Amplitude histogram of spontaneous miniature potentials recorded from mutant and control animals. These histograms were constructed from data recorded from four mutant (244 events) and four control (222 events) cells. The data are grouped into 0.3 mV bins.
Fig. 6.
Fig. 6.
Mutant varicosities have fewer failures of transmitter release. A, Single traces of focally recorded synaptic current from mutant (left) and control (right) animals. Arrows point to stimulus artifacts, and asterisks indicate events scored as release of transmitter. The events in these traces are unitary quantal events, as judged by their similarity to spontaneously occurring events recorded at the same time. In this recording configuration, the current records represent only a fraction of the total membrane current because of the relatively low seal resistance between the micropipette and the muscle; thus, the scale bars do not represent total membrane current.B, Summary of the mean number of failures of evoked release for mutants (n = 20 sites) and controls (n = 17 sites). The symbols show results obtained from each individual recording site. One hundred stimuli from each site were scored for failure or release.
Fig. 7.
Fig. 7.
EJPs recorded with focal calcium application. A micropipette containing 2 mm calcium was placed over several regions of the nerve terminal on each muscle fiber and covered areas of both varicosity types. The segmental nerve was stimulated at a voltage to recruit both axons, and EJPs were recorded with an intracellular electrode. The bathing solution contained 0 calcium. A, Example of raw trace showing evoked EJP (top trace) and synaptic event recorded through the focal pipette (bottom trace). B, The bar graph shows the mean EJP amplitude of data collected from mutant (n = 18) and control (n = 19) sites. The symbolsrepresent the results obtained from individual recording sites.
Fig. 8.
Fig. 8.
Nerve terminal ultrastructural of a Fas II mutant. Electron micrographs of mutant (A1) and control (A2) larval NMJ from abdominal segment 4 showing densely staining synapses (arrows), presynaptic dense bodies (arrowheads), subsynaptic reticulum (SR), and muscle fibers (MF). Axons 1 and 2 are labeled Ax1 andAx2, respectively. The scale bar is 0.5 μm and applies to both A1 andA2.
Fig. 9.
Fig. 9.
Summary of ultrastructural data. Reconstructed nerve terminals were analyzed for synaptic area (A) and the number of presynaptic dense bodies per synapse (B). The frequency distribution of synapse size is shown for axon 1 (C1) and axon 2 (C2).

Similar articles

Cited by

References

    1. Atwood HL, Govind CK, Wu C-F. Differential ultrastructure of synaptic terminals on ventral longitudinal abdominal muscles in Drosophila larvae. J Neurobiol. 1993;24:1008–1024. - PubMed
    1. Bailey CH, Kandel ER. Structural changes accompanying memory storage. Annu Rev Physiol. 1993;55:397–426. - PubMed
    1. Budnik V, Zhong Y, Wu C-F. Morphological plasticity of motor axons in Drosophila mutants with altered excitability. J Neurosci. 1990;10:3754–3768. - PMC - PubMed
    1. Connor EA, Smith MA. Retrograde signalling in the formation and maintenance of the neuromuscular junction. J Neurobiol. 1994;25:722–739. - PubMed
    1. Cooper RL, Marin L, Atwood HL. Synaptic differentiation of a single motor neuron: conjoint definition of transmitter release, presynaptic calcium signals, and ultrastructure. J Neurosci. 1995a;15:4209–4222. - PMC - PubMed

Publication types

MeSH terms

Substances

LinkOut - more resources