. 1996 Jun 15;16(12):3968-78.
doi: 10.1523/JNEUROSCI.16-12-03968.1996.

Visual stimulation regulates the expression of transcription factors and modulates the composition of AP-1 in visual cortex

Affiliations

Visual stimulation regulates the expression of transcription factors and modulates the composition of AP-1 in visual cortex

B Kaminska et al. J Neurosci. .

Abstract

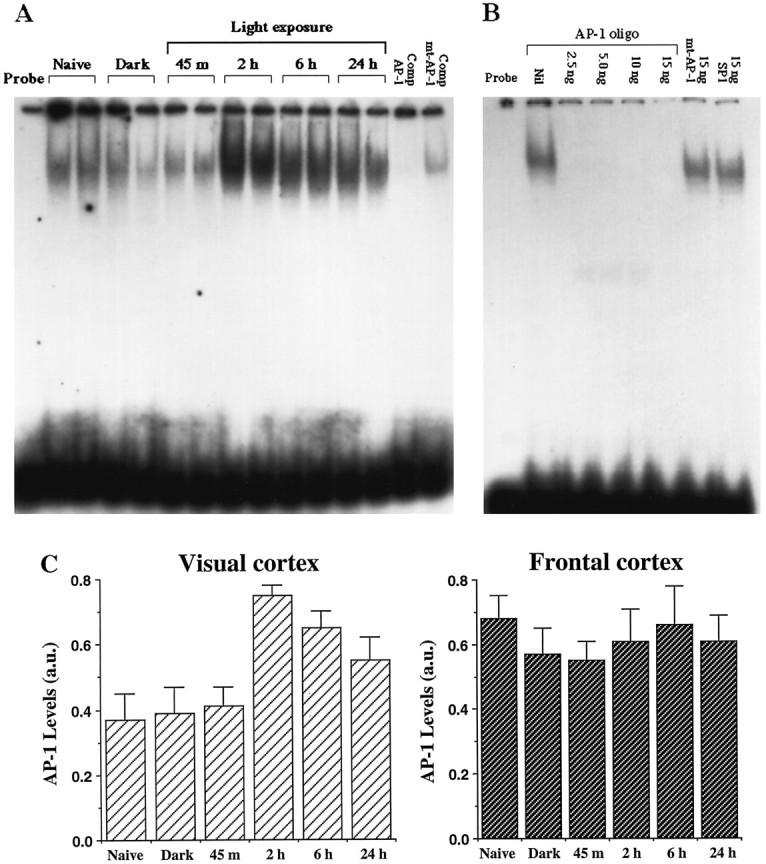
It is believed that long-term changes in neuronal function are orchestrated by transcription factors, such as AP-1 and ZIF 268, which are in turn regulated by synaptic stimulation. To further our understanding of the functional effects of such expression, we have examined the DNA-binding activities of both AP-1 and ZIF 268 by way of electrophoretic mobility shift assays (EMSA) on nuclear extracts from visual cortices of rats treated with selective light exposure. Visual stimulation after dark rearing increased the DNA-binding activities of both AP-1 and ZIF 268 to their highest levels within 2 hr. ZIF 268 thereafter dropped to levels similar to that observed in naive animals, whereas AP-1 DNA-binding activity continued to remain elevated even after 24 hr of stimulation. The components of the AP-1 complex, when assessed by EMSA-supershift analysis, showed considerable variability under different conditions of exposure. FosB and JunD were the major constituents of AP-1 in both naive and dark-reared animals. Brief visual stimulation (2 hr) added c-Fos, c-Jun, and JunB to this complex, whereas prolonged stimulation (6-24 hr) reduced c-Fos and c-Jun levels significantly, leaving only FosB, JunB, and JunD as the major components of AP-1. These results suggest that transcriptional control by AP-1 may be generated by selective combinatorial interactions of different members of the Fos and Jun families and that are guided by activity-dependent processes.


Figures

Fig. 1.
Fig. 1.
The levels of ZIF 268 DNA-binding activity in nuclear extracts from visual cortex of rats exposed to different light conditions. A, EMSA reactions were made using 20 μg of nuclear extracts from two different animals for each condition. The retarded bands in the level marked I represent the specific ZIF 268 DNA-binding activity. B, Competition studies showing the specificity of binding to ZIF 268 consensus sequence. The first lane (Probe) shows 0.25 ng of end-labeled probe without extract; the second (Nil) shows the retardation of the ZIF 268 probe caused by nuclear proteins from visual cortex of rats exposed to light for 2 hr in the absence of unlabeled probe. In the following lanes, this retarded band is specifically inhibited by progressively increasing amounts of unlabeled ZIF 268 oligonucleotide. The inclusion of 15 ng of mutant ZIF 268 and SP-1 oligonucleotides, representing a 60-fold excess, failed to inhibit binding. The inclusion of antibody against ZIF 268 protein diminished binding.
Fig. 2.
Fig. 2.
The reproducibility of increased ZIF 268 DNA-binding activity in visual cortex by light stimulation. Representative autoradiogram showing the level of ZIF 268 DNA-binding activity in visual cortices of five rats kept 1 week in darkness and another five that were dark-reared and then exposed to light for 2 hr. The specificity of the binding was shown by a competition experiment with a 60-fold excess of unlabeled ZIF 268 consensus sequence. Excess mutant ZIF 268 oligonucleotide had no effect on binding protein extract (rat 6).
Fig. 3.
Fig. 3.
The levels of AP-1 DNA-binding activity in nuclear extracts from visual cortex of rats exposed to different light conditions. A, EMSA reactions using 20 μg of nuclear extracts from two different rats. B, Competition studies showing the specificity of binding to AP-1 consensus sequence. The first lane (Probe) shows 0.25 ng of end-labeled probe without extract; the second (Nil) shows the retardation of the AP-1 probe caused by nuclear proteins from visual cortex of rats exposed to light for 2 hr in the absence of unlabeled probe. In the following lanes, this retarded band is specifically inhibited by progressively increasing amounts of unlabeled AP-1 oligonucleotide. The inclusion of 15 ng of mutant AP-1 and SP-1 oligonucleotides, representing a 60-fold excess, failed to inhibit binding. C, Densitometry-based analysis of AP-1 DNA-binding activity levels in visual and frontal cortices of rats exposed to various light conditions. EMSA reactions with AP-1 consensus sequence were carried out in parallel with nuclear extracts from visual (n = 5 for all groups) and frontal cortex (n = 5 for Naive,n = 3 for both Dark and Light groups of various durations). Naive, Animals kept under normal dark/light cycle and killed during the light phase; Dark, animals kept for 7 d in complete darkness and killed in the darkness;Light, animals kept for 7 d in complete darkness and killed after 45 min and 2, 6, and 24 hr exposure to light. The results shown are means expressed in arbitrary units (a.u.) of AP-1 densitometry values that were normalized to those obtained for CRE-binding activity under similar exposure conditions. Error bars represent SD.
Fig. 4.
Fig. 4.
The levels of CRE DNA-binding activity in visual cortex of rats exposed to different light conditions. EMSA reactions with CRE consensus sequence were carried out in parallel with the same amount of protein extracts as for ZIF 268 and AP-1. The figure illustrates that CRE DNA-binding activity remained unaffected under the different light conditions. The lane marked as CompCRE shows that a 20-fold excess of unlabeled CRE consensus sequence abolished the retarded band.
Fig. 5.
Fig. 5.
The protein composition of the AP-1 transcription factor in visual cortex of rats. Ten micrograms of protein extract from naive, dark-reared, and light-reared rats exposed to light for 2, 6, or 24 hr were subjected to EMSA-supershift analysis. The results are shown for two animals for each condition. The designations at thetop indicate which antibody was added to each sample. The supershifted bands, the positions of which are indicated witharrows, show the participation of specific proteins in the AP-1 complex. As a negative control, the inclusion of antibody against c-Fos had no effect on binding to the CRE consensus sequence in animals that were light-exposed for 2 hr. The specificity of the AP-1 binding was confirmed by competition assay with 20-fold excess of unlabeled AP-1 or mutant AP-1 oligonucleotides and performed on nuclear extracts from animals with 6 hr of light exposure.
Fig. 6.
Fig. 6.
EMSA-supershift analysis of c-Jun. Ten micrograms of protein extract from naive, dark-reared, and light-reared rats exposed to light for 2 or 6 hr were subjected to EMSA-supershift analysis. The results are shown for two representative animals out of a total of four that were tested for each light exposure condition. A discernible supershifted band at the level of the arrowheadis evident 2 hr after light exposure, whereas bands of reduced intensity are present in naive animals and those exposed to light for 6 hr. The dark-reared animal failed to show a c-Jun-supershifted band. The control conditions (no antibody to reaction mixture) also did not yield a supershifted band.
Fig. 7.
Fig. 7.
Immunocytochemical localization of c-Fos. Rats were monocularly enucleated, dark-reared for 6 d, and exposed to light for 2 hr. The figure shows a composite of the c-Fos immunostaining in both visual cortex and superior colliculus. The side contralateral to the open eye showed immunostained neurons throughout visual cortex and along dorsal margin of the superior colliculus. On the ipsilateral side, staining was confined to a narrow zone that represented the binocular representation within visual cortex (region betweenarrowheads). The superior colliculus on this side was not stained. Scale bar, 1 mm.
Fig. 8.
Fig. 8.
Immunocytochemical localization of Zif 268. Rats were monocularly enucleated, dark-reared for 6 d, and exposed to light for 2 hr. The figure shows a composite of the Zif 268 immunostaining in both visual cortex and superior colliculus. As with c-Fos immunostaining, the side contralateral to the open eye showed immunoreactive neurons throughout visual cortex and also along the dorsal margin of the superior colliculus. On the ipsilateral side, staining was confined to a narrow zone that represented the binocular representation (region between arrowheads) and flanked by reduced staining. The superior colliculus on this side was not stained. Scale bar, 1 mm.

Similar articles

Cited by

References

    1. Aronin N, Sagar SM, Sharp FR, Schwartz WJ. Light regulates expression of a Fos-related protein in rat suprachiasmatic nuclei. Proc Natl Acad Sci USA. 1990;87:5959–5962. - PMC - PubMed
    1. Angel P, Karin M. The role of Jun, Fos and the AP-1 complex in cell-proliferation and transformation. Biochim Biophys Acta. 1991;1072:129–157. - PubMed
    1. Beaver CJ, Mitchell DE, Robertson HA. An immunohistochemical study of the rapid pattern of expression of c-Fos protein in the visual cortex of dark-reared kittens following initial exposure to light. J Comp Neurol. 1993;333:469–484. - PubMed
    1. Benson DL, Huntsman MM, Jones EG. Activity dependent changes in GAD and preprotachykinin mRNAs in visual cortex of adult monkeys. Cereb Cortex. 1994;4:40–51. - PubMed
    1. Castren E, Zafra F, Thoenen H, Lindholm D. Light regulates expression of brain-derived neurotrophic factor mRNA in rat visual cortex. Proc Natl Acad Sci USA. 1992;89:9444–9448. - PMC - PubMed

Publication types

MeSH terms

Substances

LinkOut - more resources