. 1996 Jun 7;259(2):249-63.
doi: 10.1006/jmbi.1996.0317.

Conserved features in papillomavirus and polyomavirus capsids

Affiliations

Conserved features in papillomavirus and polyomavirus capsids

D M Belnap et al. J Mol Biol. .

Abstract

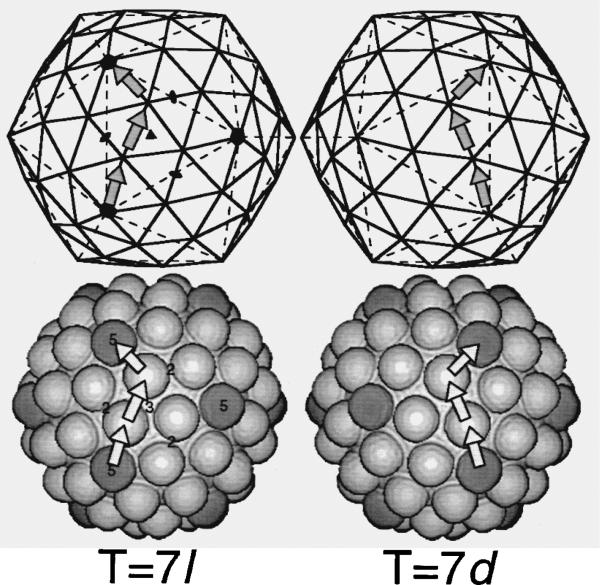
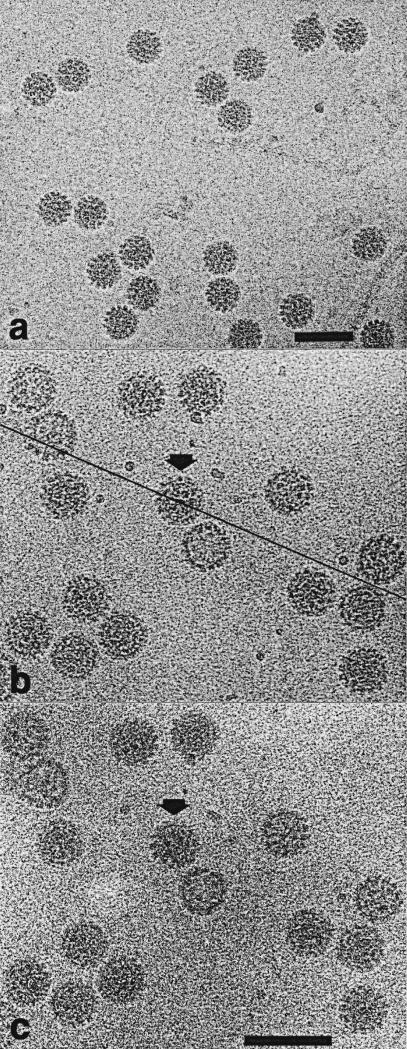
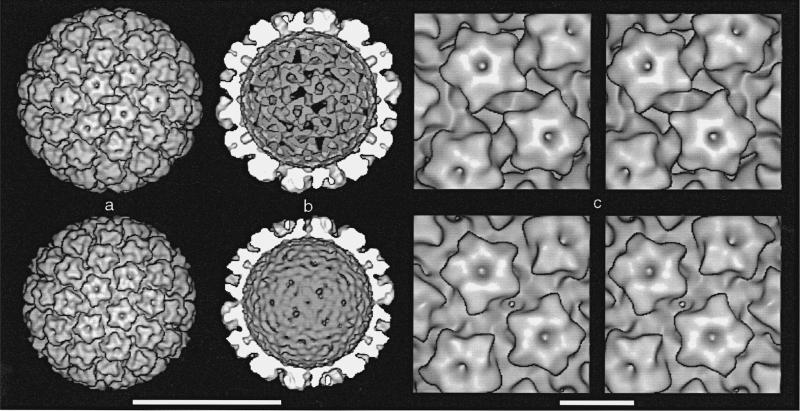
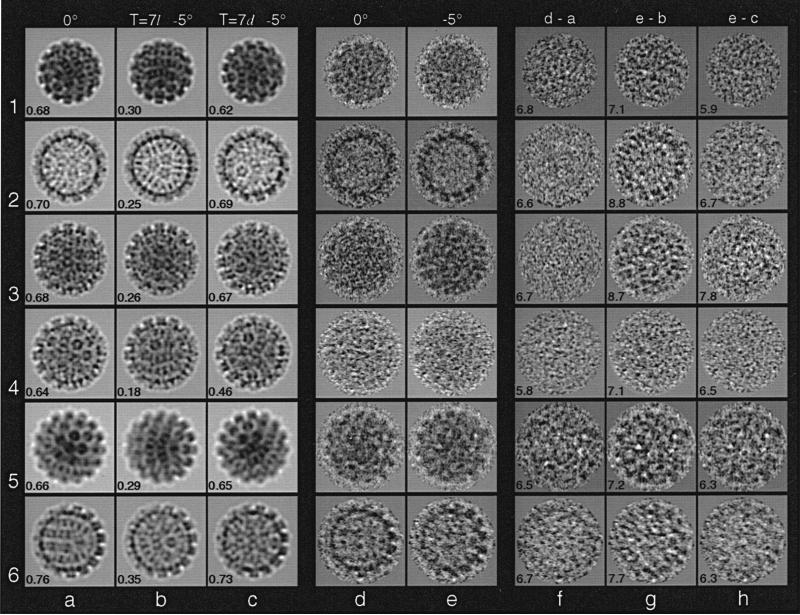
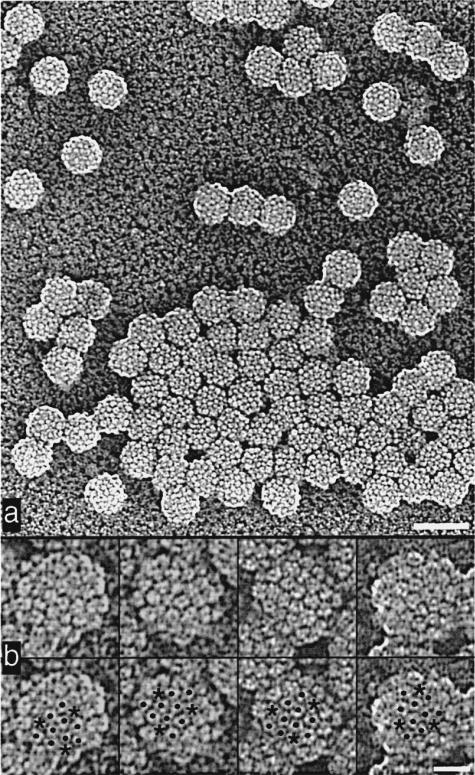
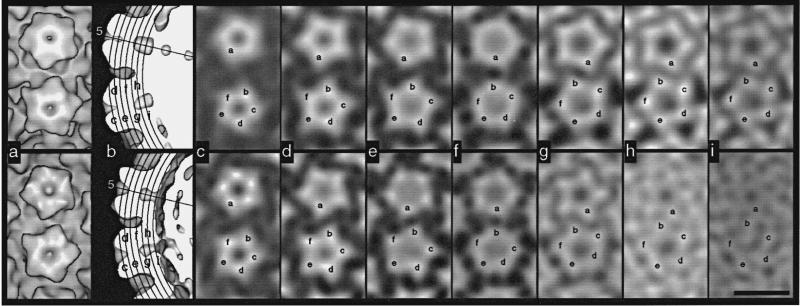
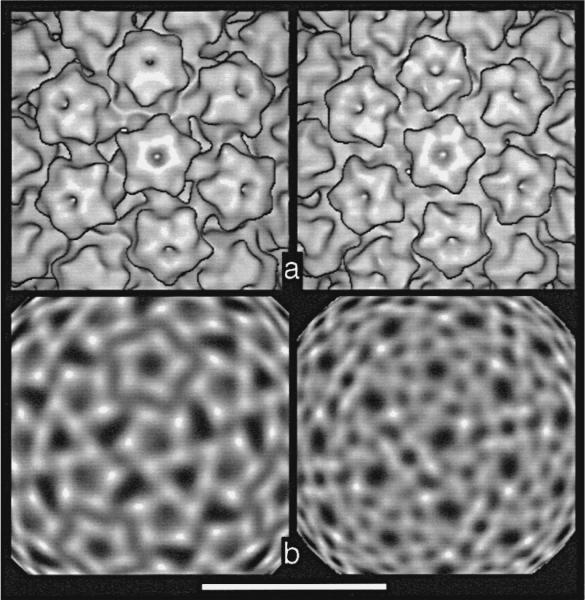
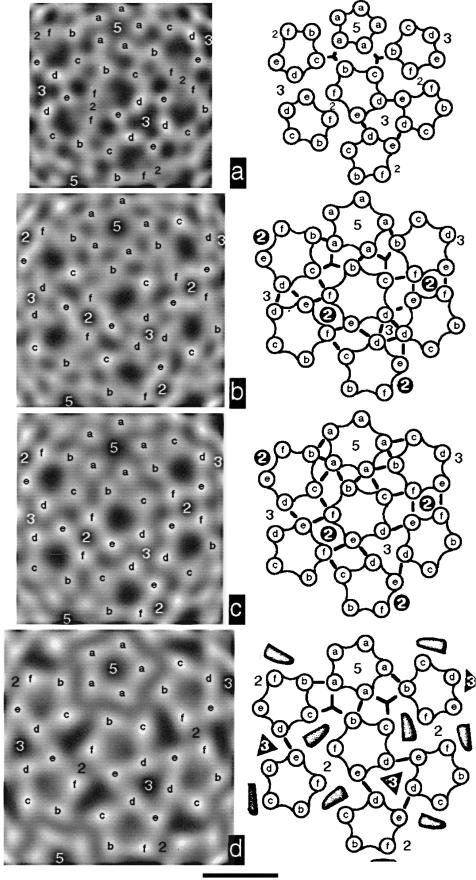
Capsids of papilloma and polyoma viruses (papovavirus family) are composed of 72 pentameric capsomeres arranged on a skewed icosahedral lattice (triangulation number of seven, T = 7). Cottontail rabbit papillomavirus (CRPV) was reported previously to be a T = 7laevo (left-handed) structure, whereas human wart virus, simian virus 40, and murine polyomavirus were shown to be T = 7dextro (right-handed). The CRPV structure determined by cryoelectron microscopy and image reconstruction was similar to previously determined structures of bovine papillomavirus type 1 (BPV-1) and human papillomavirus type 1 (HPV-1). CRPV capsids were observed in closed (compact) and open (swollen) forms. Both forms have star-shaped capsomeres, as do BPV-1 and HPV-1, but the open CRPV capsids are approximately 2 nm larger in radius. The lattice hands of all papillomaviruses examined in this study were found to be T = 7dextro. In the region of maximum contact, papillomavirus capsomeres interact in a manner similar to that found in polyomaviruses. Although papilloma and polyoma viruses have differences in capsid size (approximately 60 versus approximately 50 nm), capsomere morphology (11 to 12 nm star-shaped versus 8 nm barrel-shaped), and intercapsomere interactions (slightly different contacts between capsomeres), papovavirus capsids have a conserved, 72-pentamer, T = 7dextro structure. These features are conserved despite significant differences in amino acid sequences of the major capsid proteins. The conserved features may be a consequence of stable contacts that occur within capsomeres and flexible links that form among capsomeres.


Figures

Figure 1
Figure 1
Icosahedra with a triangulation number of seven (T = 7) are left (T = 7laevo) or right (T = 7dextro) handed. Here, T = 7l and T = 7d lattices (top row, continuous lines) and computer-generated models (bottom row) are displayed. Vertices in the lattices are replaced by spheres in the models. For the papovaviruses, each sphere represents a pentameric capsomere. Three adjacent, 5-fold-symmetry axes (filled pentagons, top left) define the vertices of one of the 20 triangular faces in the basic, T = 1 icosahedron (broken lines, top row). Both 2-fold and 3-fold symmetry elements (filled ovals and triangle, respectively) are depicted also within this triangular face. (Filled symbols are replaced by numbers in the lower left figure.) A T = 7 lattice has 72 vertices or lattice points that define the corners of 140 smaller triangles. The 12 pentavalent vertices at the 5-fold axes are each surrounded by five hexavalent vertices, giving a total of 60 hexavalent lattice points (three in each face of the T = 1 lattice). Each hexavalent lattice point is surrounded by one pentavalent and five hexavalent points. Pentava-lent spheres in the computer models (bottom row) are shaded dark grey to distinguish them from hexavalent spheres. The absolute hand of a T = 7 lattice is defined by the arrangement of lattice points between neighboring pentavalent points, analogous to the moves a knight makes in the game of chess. Thus, in a T = 7l lattice (top left) or structure (bottom left) the path between adjacent pentavalent lattice points or capsomeres consists of two “steps” forward onto adjacent hexavalent points followed by one step to the left (arrows). Similarly, a T = 7d lattice (top right) or structure (bottom right) exhibits a “two steps forward followed by one to the right” pattern. The lattices and computer models are enantiomorphs (i.e. mirror related). However, if all spheres in each model were replaced by chemically identical, chiral, pentameric capsomeres as are found in all papovaviruses, the resulting T = 7l and T = 7d structures would not be an enantiomorphic pair.
Figure 2
Figure 2
Electron micrographs of vitrified CRPV samples. CRPV particles are distributed in a monodisperse layer indicating that the frozen-hydrated sample is about as thick as the diameter of the particles. Capsomeres appear as “knob-like” structures, which are prominent especially along particle edges. a, CRPV dialyzed against 10 mM Tris-HCl and 1 mM EDTA (pH 8.0). These particle images were used to compute the 3D reconstruction seen in Figure 3. Bar represents 100 nm. b and c, Tilting experiment with CRPV dialyzed against 20 mM Tris-HCl, 1 M NaCl (pH 7.4). View of particles with specimen stage at 0° (b) and –5° (c) tilt. The tilt axis (line in b) is approximately 23° from the horizontal. The particle highlighted with the arrows also appears in Figure 4. Bar represents 100 nm.
Figure 3
Figure 3
Surface-shaded representations of CRPV (top row) and HPV-1 (bottom row) reconstructions viewed along a 2-fold symmetry axis. The CRPV capsid has an “open” form and the HPV-1 has a “closed” form. a, Outside view of virions. b, Inside view of capsids (back half). Chromatin cores were computationally removed from the virion density map (radii < 46 nm for CRPV and < 42 nm for HPV-1). c, Closeup stereo views. In CRPV (top), elongated holes lie on opposite sides of the 2-fold axis. Triangular holes on the 3-fold axes can be seen at the top and bottom center, just behind the protruding point of the capsomere. In HPV-1 (bottom), there is a single, small hole on the 2-fold axis. Bars represent: a,b, 50 nm; c, 10 nm.
Figure 4
Figure 4
Representative images from the hand determinations of SV40, BPV-1 capsid, BPV-1, CRPV closed form, CRPV open form, and HPV-1 VLPs (rows 1 to 6, respectively). Darkest features represent the highest projected densities. Each panel is 70 nm square. a–c, Projection images of 3D models at orientations corresponding to images of the untilted (d) and tilted (e) particles. Correlation coefficients at the bottom left of each panel quantify the agreement between the model projections (a to c) and particle images (d and e). a, Untilted view and correlation coefficient between a and d. b, Tilted view of T = 7l model and correlation coefficient between b and e. c, Tilted view of T = 7d model and correlation coefficient between c and e. d and e, Electron images of a given virus particle untilted (d) and tilted by –5° (e). The particles in row 4 appear in Figure 2b and c. f to h, Difference images computed by subtracting projection images (a to c) from particle images (d and e), after appropriate scaling (Baker et al., 1990). The average density in each difference map (from the center to the particle edge) is 0.0. Standard deviations are listed at the lower left of each panel. f, Image d – projection a. g, Image e – projection b. h, Image e – projection c.
Figure 5
Figure 5
Representative images of BPV-1 particles shadowed with Pt-C. Images are shown in reverse contrast. a, Low magnification view. Bar represents 100 nm. b, Unmarked (top) and marked (bottom) views of four shadowed particles. Asterisks identify pentavalent capsomeres and dots indicate hexavalent capsomeres. The path between adjacent capsomeres (see Figure 1) indicates that the surface lattice of BPV-1 has T = 7d symmetry. Bar represents 25 nm.
Figure 6
Figure 6
Skew in capsomeres of open CRPV (top) and closed HPV-1 (bottom) structures. A pentavalent capsomere lies directly above a hexavalent capsomere in each panel. Bar represents 10 nm. a, Surface-shaded views. b, Surface-shaded, side views of the left half of each structure shown in a. The level of each radial section depicted in c to i is indicated by the labeled arcs. The 5-fold symmetry axis is also identified. The slightly larger radius of the open CRPV form compared with the closed HPV-1 structure is apparent. The reason for the presence (bottom, r ≈ 21 nm) or absence (top, r ≈ 23 nm) of a gap between the capsid shell and the chromatin core is unknown but appears to be unrelated to the open or closed state of the capsid. c to i, Projected density at radii from 30 to 24 nm (CRPV) and 28 to 22 nm (HPV-1) in 1 nm steps, and with contrast reversed relative to that shown in Figure 4. All projections in the CRPV series are at radii 2 nm larger than the corresponding projections of HPV-1. The highest average density occurs at level h. Six strong density features (subunits) are labeled a to f as described by Baker et al. (1991) and are traced through the capsid structure. These six make up an icosahedral asymmetric unit (1/60th of an icosahedron). The path of each subunit becomes somewhat ambiguous at levels where capsomere features blur (e.g. f). Hence, it is impossible at this resolution to follow unambiguously the density unique to a given subunit. However, subtle subunit skewing is observed in capsomeres of a 2.5 nm resolution reconstruction of murine polyomavirus (Belnap, D., Olson, N. & Baker T., unpublished results), and this is confirmed by comparison to the high-resolution structure of VP1 whose elongated mass lies in a nearly radial orientation (Stehle et al., 1994).
Figure 7
Figure 7
Views of open CRPV (left) and closed HPV-1 (right) structures. The view direction coincides with the axis of a hexavalent capsomere. A pentavalent capsomere appears directly above the central hexavalent capsomere. Bar represents 25 nm. a, Surface-shaded views. b, Density at radii of 25 nm (CRPV) and 23 nm (HPV-1) showing density in center of shell region (Figure 6h) with contrast the same as in Figure 6c to i.
Figure 8
Figure 8
Intercapsomere interactions in papovavirus capsids viewed as in Figure 7. Capsid density is projected at the radius of maximum average density in the shell (left). Interpretive diagrams of mass arrangements and intercapsomere interactions are shown to the right of each image. Numbers identify icosahedral symmetry axes. Labeling of subunits corresponds to that used in Figure 6. Arcs depict intracapsomere contacts and thick lines represent intercapsomere connections not on 2- or 3-fold axes. Holes seen in the papillomavirus capsid shells are depicted in the diagram as shaded regions. Bar represents 10 nm. a, Murine polyomavirus, r = 20 nm. b, Closed HPV-1, r = 23 nm. Holes in the shell occur on 2-fold symmetry axes and are bounded by e and f subunits. c, Closed BPV-1, r = 23 nm, from Baker et al. (1991). Holes are located in the same positions as in b. d, Open CRPV, r = 25 nm. Holes in the shell are bounded by b, c, d, e and f subunits. They also appear on the 3-fold axes where they are bounded by d and e subunits.

Similar articles

Cited by

References

    1. Adolph KW, Caspar DLD, Hollingshead CJ, Lattman EE, Philips WC, Murakami WT. Polyoma virion and capsid crystal structures. Science. 1979;203:1117–1120. - PubMed
    1. Adrian M, Dubochet J, Lepault J, McDowall AW. Cryo-electron microscopy of viruses. Nature. 1984;308:32–36. - PubMed
    1. Anderer FA, Schlumberger HD, Koch MA, Frank H, Eggers HJ. Structure of simian virus 40: II. symmetry and components of the virus particle. Virology. 1967;32:511–523. - PubMed
    1. Baker CC. Sequence analysis of papillomavirus genomes. In: Salzman NP, Howley PM, editors. The Papovaviridae, vol. 2, The Papillomaviruses. Plenum Press; New York: 1987. pp. 321–385.
    1. Baker TS. Cryo-electron microscopy and three-dimensional image reconstruction of icosahedral viruses. In: Megías-Megías L, Rodríquez-García MI, Ríos A, Arias JM, editors. Electron Microscopy 92: Proceedings of the 10th European Congress on Electron Microscopy held in Granada, Spain, 7-11 September 1992. Vol. 3. Secretariado de Publicaciones de la Universidad de Granada; Granada: 1992. pp. 275–279.

Publication types

MeSH terms

Substances