

Profound loss of layer II entorhinal cortex neurons occurs in very mild Alzheimer's disease
- PMID: 8699259
- PMCID: PMC6578866
- DOI: 10.1523/JNEUROSCI.16-14-04491.1996
Profound loss of layer II entorhinal cortex neurons occurs in very mild Alzheimer's disease
Abstract
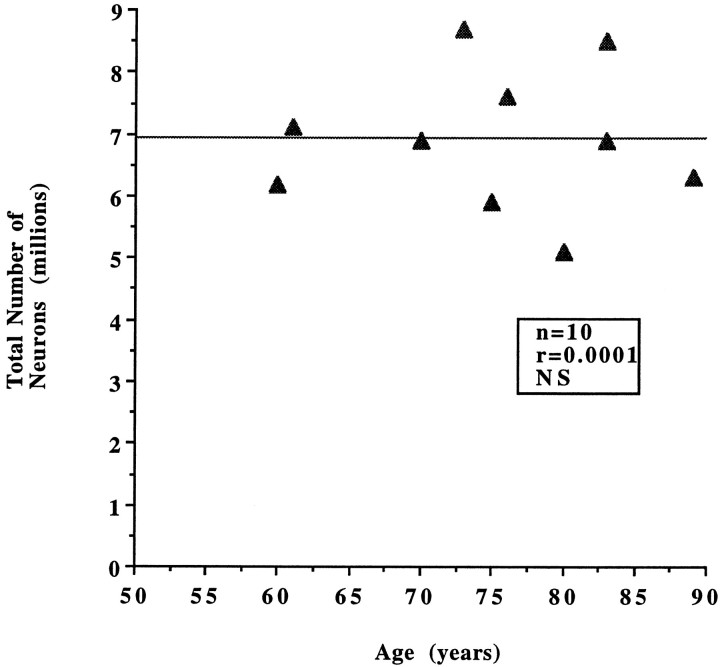
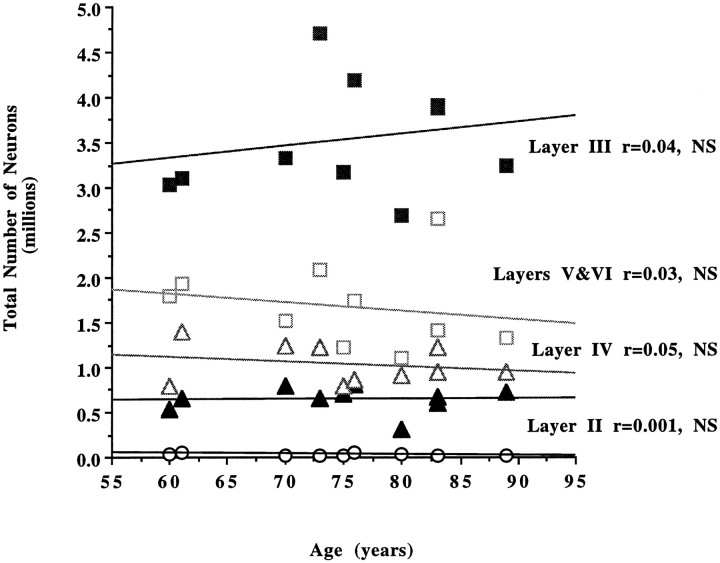
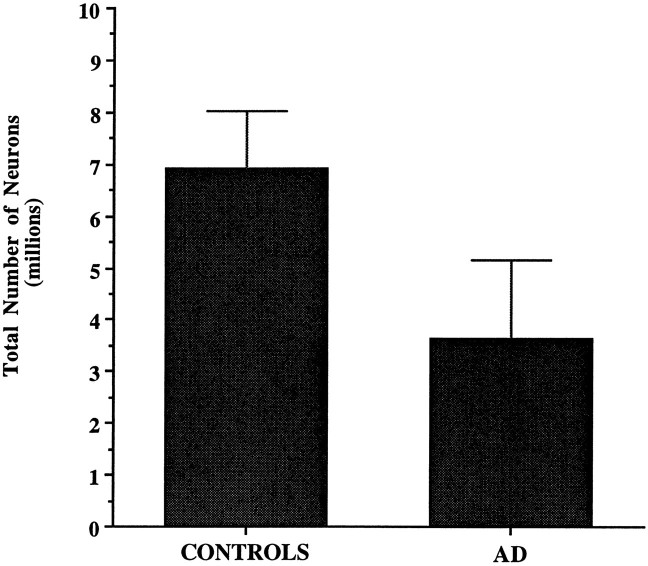
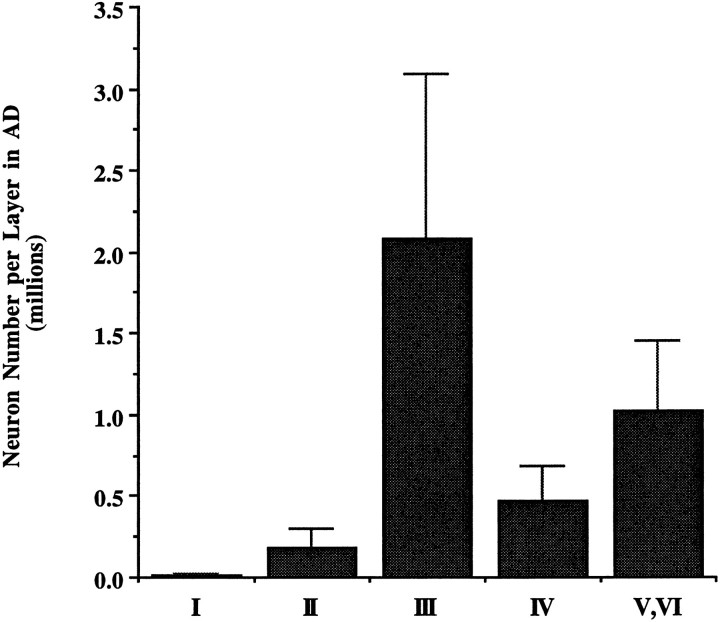
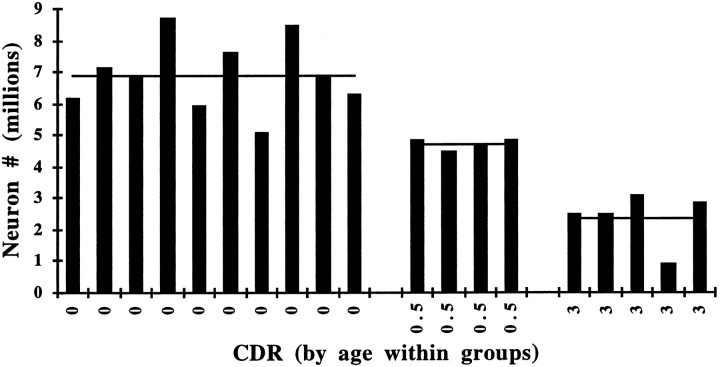
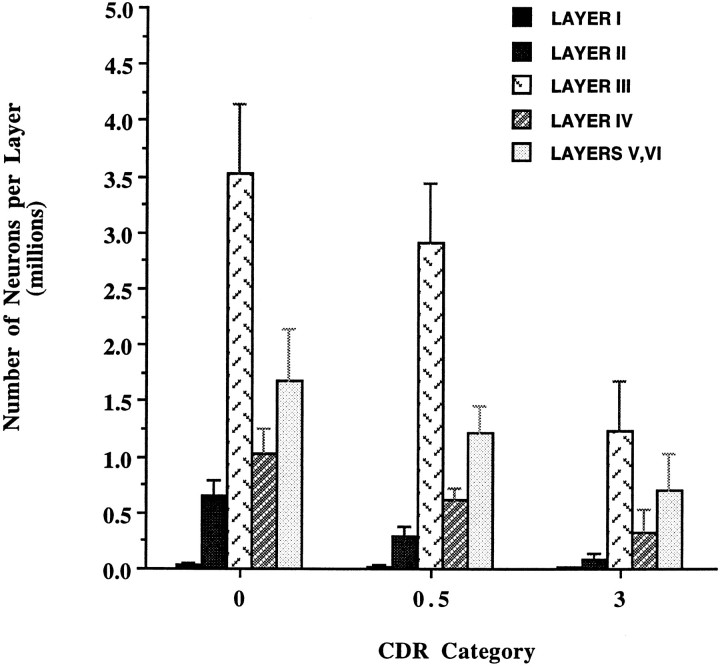
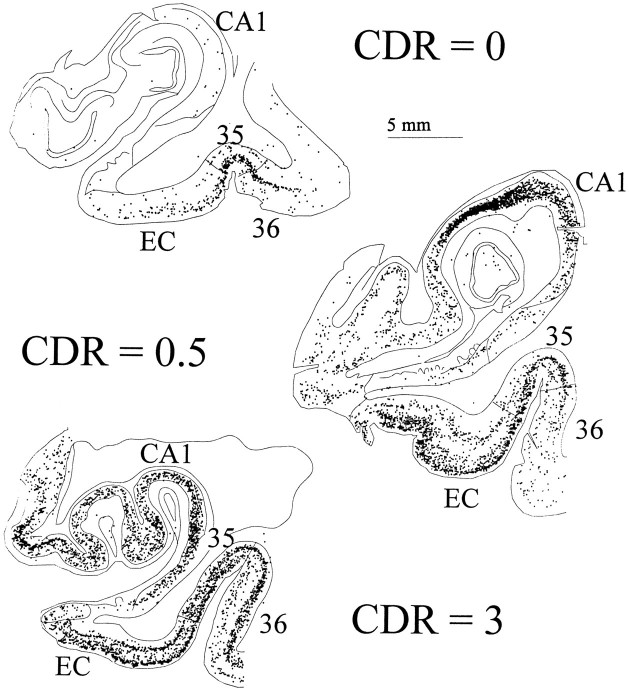
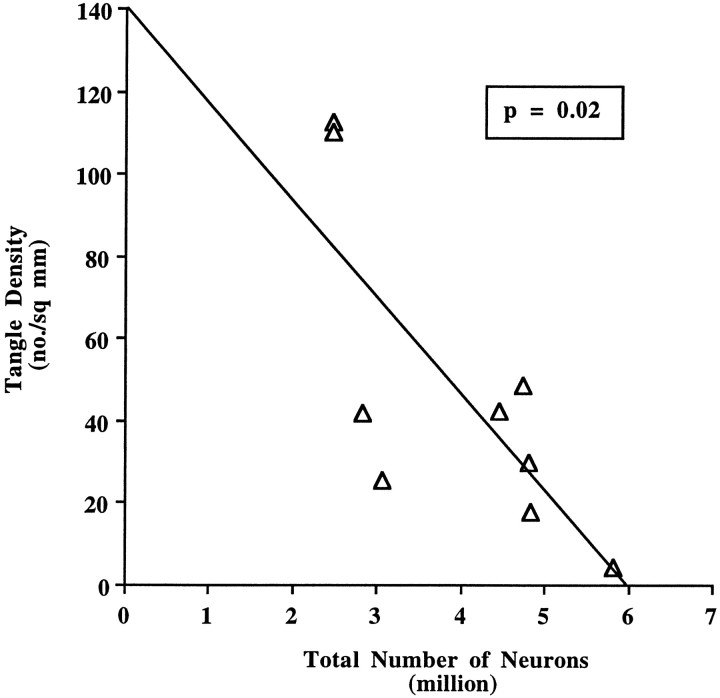
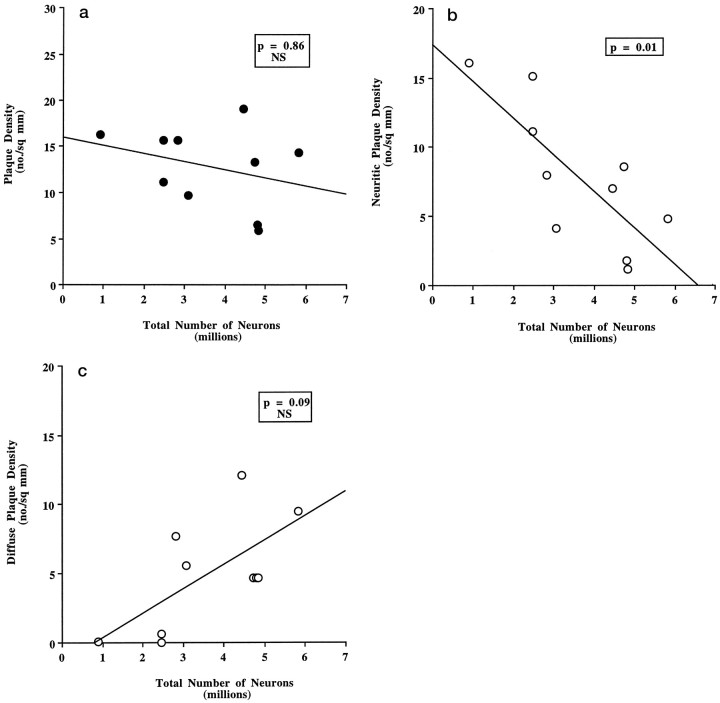
The entorhinal cortex (EC) plays a crucial role as a gateway connecting the neocortex and the hippocampal formation. Layer II of the EC gives rise to the perforant pathway, the major source of the excitatory input to the hippocampus, and layer IV receives a major hippocampal efferent projection. The EC is affected severely in Alzheimer disease (AD), likely contributing to memory impairment. We applied stereological principles of neuron counting to determine whether neuronal loss occurs in the EC in the very early stages of AD. We studied 20 individuals who at death had a Clinical Dementia Rating (CDR) score of 0 (cognitively normal), 0.5 (very mild), 1 (mild), or 3 (severe cognitive impairment). Lamina-specific neuronal counts were carried out on sections representing the entire EC. In the cognitively normal (CDR = 0) individuals, there were approximately 650,000 neurons in layer II, 1 million neurons in layer IV, and 7 million neurons in the entire EC. The number of neurons remained constant between 60 and 90 years of age. The group with the mildest clinically detectable dementia (CDR = 0.5), all of whom had sufficient neurofibrillary tangles (NFTs) and senile plaques for the neuropathological diagnosis of AD, had 32% fewer EC neurons than controls. Decreases in individual lamina were even more dramatic, with the number of neurons in layer II decreasing by 60% and in layer IV by 40% compared with controls. In the severe dementia cases (CDR = 3), the number of neurons in layer II decreased by approximately 90%, and the number of neurons in layer IV decreased by approximately 70% compared with controls. Neuronal number in AD was inversely proportional to NFT formation and neuritic plaques, but was not related significantly to diffuse plaques or to total plaques. These results support the conclusion that a marked decrement of layer II neurons distinguishes even very mild AD from nondemented aging.
Figures
References
-
- Amaral DG, Insausti R. Hippocampal formation. In: Paxinos G, editor. The human nervous system. Academic; San Diego: 1990. pp. 19–31.
-
- Arnold SE, Hyman BT, Flory J. The topographical and neuroanatomical distribution of neurofibrillary tangles and neuritic plaques in cerebral cortex of patients with Alzheimer’s disease. Cereb Cortex. 1991;1:103–116. - PubMed
-
- Arriagada PV, Growdon JH, Hedley-Whyte ET, Hyman BT. Neurofibrillary tangles but not senile plaques parallel duration and severity of Alzheimer’s disease. Neurology. 1992a;42:631–639. - PubMed
-
- Arriagada PV, Marzloff K, Hyman BT. Distribution of Alzheimer-type pathological changes in nondemented elderly matches the pattern in Alzheimer’s disease. Neurology. 1992b;42:1681–1688. - PubMed
-
- Ball MJ. Neuronal loss, neurofibrillary tangles and granulovacuolar degeneration in the hippocampus with ageing and dementia. A quantitative study. Acta Neuropathol (Berl) 1977;37:111–118. - PubMed
Publication types
MeSH terms
Grants and funding
LinkOut - more resources
Full Text Sources
Other Literature Sources
Medical